Yi Zhang* | Jiafeng Yang | Wei Hu | Ying Pei | Xue Xia | Qingjing Wu
© 2021 IIETA. This article is published by IIETA and is licensed under the CC BY 4.0 license (http://creativecommons.org/licenses/by/4.0/).
OPEN ACCESS
In view of the problems such as high carbon emissions and low return on investment in conventional power planning, this paper proposed a low-carbon thermal energy power planning model based on a green certificate allocation mechanism. First, considering the uneven distribution of power generation resources in the power sector and the significant differences in power generation technologies in various regions of China, a green certificate allocation mechanism was established based on regional comparison to ensure a fair allocation of carbon quotas; then, based on the idea of full life cycle, an in-depth and comprehensive analysis was conducted on the low-carbon thermal energy power technologies, and a new low-carbon thermal energy power planning mode was established; on this basis, with investment costs, operation and maintenance costs, power generation costs and low-carbon benefits as the objective functions, a low-carbon power planning model with the maximum net benefit was established; after that, the proposed low-carbon thermal energy power planning model was optimized and solved with the discrete bacterial colony chemotaxis algorithm, and the results were compared with the optimized results of conventional power planning, and the roles of various low-carbon power elements in different low-carbon scenarios were analyzed. The results of the example analysis show that the proposed model can effectively reduce the carbon emissions of the power sector and increase the power generation benefits of the units, so it will provide a useful reference for the low-carbon power planning work in the future.
low carbon, power planning, carbon emission reduction, green certificate, thermal energy
With the launch of the carbon peaking and carbon neutrality strategies, the power sector, as a major energy consumer, needs to carry out low-carbon planning for its power supply structure to achieve sustainable development in the green economy [1, 2]. Therefore, it is of great practical significance to introduce low-carbon power technologies and the carbon quota trading mechanism in power planning.
Scholars at home and abroad have conducted a lot of research on power planning [3, 4]. Lin et al. [5] took the minimization of power generation cost as the objective function, and established a low-carbon dispatching model with collaborative optimization. Wang et al. [6] explored the use of energy permits in the economic dispatching model and conducted quantitative analysis. Wang et al. [7] proposed a low-carbon incentive type carbon trading mechanism to comprehensively analyse the thermal power generation environment and optimize the allocation of renewable energy. Chen et al. [8] compared the power planning schemes under different renewable energy power generation scenarios, and selected the optimal power planning and investment scheme. Abdin and Zio [9] conducted periodic evaluation of the operation indicators of the power planning model to generate the optimal power planning indicator system. Hamidpour et al. [10] proposed a low-carbon indicator for power systems based on AC power flow constraints, energy storage and coordinated response at the demand side. The above literatures have done some work on power planning, but most of them are based on the conventional carbon quota trading mechanism or low-carbon power elements, without in-depth analysis.
Based on the above analysis, this paper introduced the green certificate trading mechanism and low-carbon power technologies into the decision making on power planning, and established a low-carbon power planning model with the objective of maximizing the net benefit of the system during the planning period. Through experimental analysis, the rationality and effectiveness of the proposed model and method were verified.
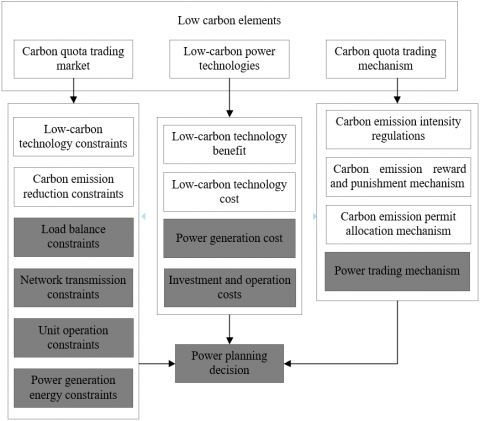
According to the load demand of the power system, the conventional power planning makes decisions on the production plan during the power planning period under various constraints such as the limitation of power grid transmission capacity and the supply of energy resources, to ensure the lowest overall investment cost during the planning period [11, 12]. On this basis, this paper introduced various low-carbon elements to optimize the decision-making process and formed a low-carbon power planning framework, as shown in Figure 1.
In Figure 1, the 8 grey modules constitute the conventional power planning mode, while the grey and white modules are coupled to form a low-carbon power planning framework. Compared with the conventional power planning mode, the low-carbon power planning can not only ensure the operational safety and economic benefits of the system, but also achieve the coordinated development of energy, environment and economy. With the incorporation of low-carbon power technology elements, the decision content and objectives of the conventional power supply planning are expanded; with the introduction of the carbon quota allocation and reward and punishment mechanism, the low-carbon power planning process is optimized; and low-carbon technologies and carbon quota trading constitute new constraints [13].
Figure 1. Low-carbon power planning framework
3.1 Green certificate allocation mechanism
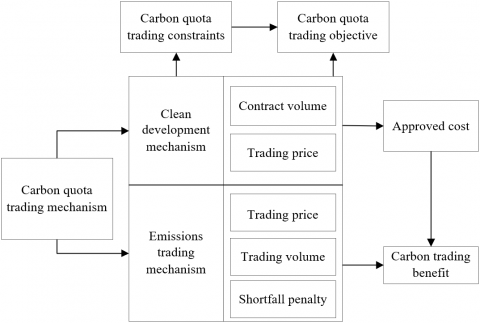
The United Nations designed three carbon quota trading mechanisms, namely Joint Implementation (JT), Clean Development Mechanism (CDM) and Emissions Trading (ET), among which, CDM and ET will directly affect power planning, as shown in Figure 2.
Figure 2. Planning process of the carbon quota trading mechanism
Due to the uneven distribution of power generation resources, especially clean power generation resources, in different regions of China, to coordinate the development of all regions, this paper, on the basis of CDM and ET, proposed a green certificate allocation mechanism based on regional comparison, to achieve rational allocation of carbon quotas [14, 15]. According to the actual power generation of the power companies in each region, the government authority converts the green electricity generated into a certain number of green certificates and allocates corresponding carbon quotas.
To establish the carbon quota allocation model, a local region is divided into N areas, which are sorted in descending order by per capita GDP [16]. Assuming that the area c comes before the area i, the carbon quota allocation model for the area i is:
$E_{i}^{t}=\alpha (E_{i,c}^{t}+E_{i,r}^{t}+\Delta E_{i}^{t})$ (1)
where, $E_{i}^{t}$ and $E_{i, c}^{t}$ are the carbon quota allocated to the area i in the year t and the comparative carbon quota component allocated based on the area c, respectively; $E_{i, r}^{t}$ and $\Delta E_{i}^{t}$ are the compensatory carbon quota component allocated to the area i in the year t according to their actual energy resources distribution, and the cumulative carbon quota component allocated based on the optimal area , respectively; and $\alpha$ is the allocation coefficient of carbon quotas [17].
1) Area-comparative carbon quota component $E_{i, c}^{t}$
$E_{i, c}^{t}= \begin{cases}e_{c}\left(q_{i}^{t}\right) p_{i}^{t} & c \neq i \\ p_{i}^{t}\left(e_{i}^{t-1}-\frac{e_{i}^{t-1}-e_{i}^{T}}{T-t+1}\right) & c=i\end{cases}$ (2)
where, $e_{c}\left(q_{i}^{t}\right)$ represents the per capita carbon quota for the area c when the per capita electricity consumption is $q_{i}^{t}$; $p_{i}^{t}$ is the population of the area i in the year t; $e_{i}^{t-1}$ is the per capita carbon emission in the area i in the year t-1; $e_{i}^{T}$ is the per capita carbon emission in the target year T set according to the carbon emission reduction constraint.
2) Resource-compensatory carbon quota component $E_{i, r}^{t}$
The additional installed capacity $W_{i, f}^{t}$ of fossil energy power generation required due to the lack of clean power generation resources in the area i in the year t is:
$W_{i,f}^{t}=\max \{0,W_{i}^{t}{{\mu }^{t}}-W_{i,c}^{t-1}-W_{i,r}^{t}\}$ (3)
where, $\mu^{t}$ is the proportion of the installed capacity of clean energy power generation in China in the year t according to the carbon emission reduction requirements; $W_{i}^{t}$ and $W_{i, r}^{t}$ are the total installed capacity and the available installed capacity of clean energy power generation in the area i in the year t, respectively; and $W_{i, c}^{t-1}$ is the installed capacity of clean energy power generation in the area i in the year t-1.
The compensatory carbon quota $E_{i, r}^{t}$ for the area i in the year area t is:
$E_{i, r}^{t}=\left\{\begin{array}{cl}W_{i, f}^{t} H_{f}^{t} \delta_{f}^{t} & W_{i, f}^{t}>0 \\ -\frac{W_{i, f}^{t}}{\sum_{i} W_{i, f}^{t}} \sum_{i}\left(W_{i, f}^{t} H_{f}^{t} \delta_{f}^{t}\right) & W_{i, f}^{t} \leq 0\end{array}\right.$ (4)
where, $H_{f}^{t}$ and $\delta_{f}^{t}$ are the average utilization hours and carbon emission intensity of fossil energy power generation equipment in the year t, respectively.
3) Cumulative carbon quota component $\Delta E_{i}^{t}$
$\Delta E_{i}^{t}=\frac{q_{i}^{t}p_{i}^{t}}{\sum\limits_{k=t}^{T}{q_{i}^{j}p_{i}^{j}}}\sum\limits_{j={{T}_{0}}}^{t-1}{(e_{first}^{j}-e_{i}^{j})}p_{i}^{j}$ (5)
where, $T_{0}$ is the reference year; $e_{\text {first }}^{j}$ and $e_{i}^{j}$ are the per capita carbon emission of the area that ranks the first and the target area i in the year j, respectively.
4) Carbon quota allocation coefficient α
$\alpha =\frac{E_{\sum }^{T}}{\sum\limits_{I=1}^{N}{E_{i}^{t}}}$ (6)
where, $E_{\sum}^{T}$ is the total carbon quota to be allocated in the power sector in a certain local area in the year t.
3.2 Analysis and modelling of low-carbon power technologies
The current main low-carbon power technologies include efficient power generation energy utilization technologies, low-carbon power supply technologies and carbon capture and storage technologies, etc [18, 19]. The incorporation of various low-carbon technologies into power planning will affect the conditions, costs and benefits of the whole power planning process, as shown in Figure 3.
Considering the different development stages of low-carbon technologies and to eliminate uncertainties, the low-carbon technologies are managed throughout through the whole life cycle [20]. First, decisions should be made on the selection and application of low-carbon technologies in the power planning model, to change their periodic priorities and application degrees during the planning period. Second, a comparative analysis should be conducted on the technology costs and carbon emission reduction benefits of various low-carbon technologies, to determine their maturity, development scales and implementation stages [21, 22].
Figure 3. New low-carbon power planning mode
Two key factors - the low-carbon technology maturity year $Y_{R}$ and the annual technological progress rate were introduced. The following constraints are for $Y_{R}$:
$\left\{\begin{array}{c}X_{k}^{T}\left(y_{i}\right) \geq 0 \\ X_{k}^{T}\left(y_{i}\right)\left(y_{i}-Y_{R}\right) \geq 0\end{array}, y_{i}>Y_{R}\right.$ (7)
where, $X_{k}^{T}\left(y_{i}\right)$ represents the application degree of the low-carbon technology k in the planning year $y_{i}$; $X_{k}^{T}\left(y_{i}\right)$ is the decision variable for the selection and application of the new low-carbon technology.
According to the learning curve effect, with the research and development time going, $r_{T}$ will continuously increase and the operating cost will continuously decline. The annual cost $c_{i}^{T}\left(y_{i}\right)$ resulting from the technological progress is:
$c_{i}^{T}({{y}_{i}})=c_{i}^{T}({{Y}_{0}}){{(1-{{r}_{T}})}^{{{y}_{i}}-{{Y}_{0}}}}$ (8)
where, $c_{i}^{T}\left(y_{i}\right)$ is the power generation cost of the low-carbon technology i in the planning year $y_{i}$; $c_{i}^{T}\left(Y_{0}\right)$ is the power generation cost of this technology in the planning year $Y_{0}$; $c_{i}^{T}\left(Y_{0}\right)$ is the new low-carbon technology progress rate component in the objective function.
3.3 Low-carbon power planning model
According to the green certificate allocation mechanism based on regional comparison, the low-carbon elements are introduced into the conventional power planning model, and the objective function and constraints of the low-carbon power planning model are obtained as follows:
$\min C=\sum_{t=1}^{T} C_{R F}\left(C_{I}^{t}+C_{O}^{t}+C_{G}^{t}-C_{C O_{2}}^{t}\right)$
$C_{I}^{t}=\sum_{k} Y_{k}^{t} c_{I K}^{t}$
$C_{O}^{t}=\sum_{k} H_{k}^{t} c_{O K}^{t}$
$C_{G}^{t}=\sum_{k} A_{k}^{t} c_{G K}^{t}$
$C_{C O_{2}}^{t}=\left(E_{i}^{t}-\sum_{k} A_{k}^{t} e_{k}^{t}\right) P_{E T}^{t}+E_{C D M}^{t} P_{C D M}^{t}$ (9)
where, T is the total power planning period; $C_{R F}$ is the capital recovery factor; $C_{I}^{t}$, $C_{O}^{t}$, $C_{G}^{t}$ and $\mathrm{C}_{\mathrm{CO}_{2}}^{t}$ are the equipment investment cost, operation and maintenance cost, power generation cost and low-carbon benefit of the year t, respectively; $Y_{k}^{t}$, $H_{k}^{t}$ and $A_{k}^{t}$ are the total newly installed capacity, total installed capacity and total power generation of the type-k power generator units in the year t, respectively; $c_{I K}^{t}$, $c_{O K}^{t}$ and $c_{G K}^{t}$ are the investment cost, operation and maintenance cost and power generation cost per unit capacity (electricity) of all the type-k power generator units in the year t, respectively; $P_{E T}^{t}$ and $P_{C D M}^{t}$ are the trading prices under CDM and ET in the carbon quota market in the year t; $E_{i}^{t}$ is the carbon emission permits obtained through the allocation mechanism based on regional comparison in the year t; and $e_{k}^{t}$ is the carbon emission intensity of the type-k power generator units in the year t.
$E_{C D M}^{t}$ is the total certified carbon emissions obtained from CDM trading, which should meet the following conditions:
$E_{CDM}^{t}=\sum\limits_{k}{E_{Cm}^{t}}$ (10)
$E_{C m}^{t}=\left\{\begin{array}{lr}E_{C m} & t_{m 0} \leq t \leq t_{m 0}+L_{m} \\ 0 & t<t_{m 0} \text { or } t>t_{m 0}+L_{m}\end{array}\right.$ (11)
where, $E_{C m}^{t}$ is the total certified carbon emissions obtained from the m-th concluded transaction in the year t; $E_{C m}$, $t_{m 0}$ and $L_{m}$ are respectively the annual average total certified carbon emissions of the m-th project, the starting year of carbon emission reduction certification and the certified emission reduction period (years).
Considering the technological progress factors will affect the carbon emission intensity of various types of generator units, $e_{k}^{t}$ should meet the following condition:
$e_{k}^{t}=e_{k}^{t-1}(1-{{\varsigma }_{k}})\text{ 0}<{{\varsigma }_{k}}<1$ (12)
where, ςk is the technological progress factor of the type k power generating units.
In addition to the constraints for conventional power planning, the constraints for low-carbon power planning also include carbon emission intensity constraints, including the restriction on the annual carbon emission intensity of the entire power sector [23, 24]. At the same time, the green certificate allocation mechanism based on regional comparison and the total carbon quota trading control and distribution system also restrict the total carbon quotas for each area. The carbon emission reduction constraints are divided into two parts – the constraint within the planning period and that at the end of the planning period:
(1) Carbon emission reduction constraint within the planning period
This constraint forces power generation companies to trade the surplus and shortage in carbon quotas according to their own carbon emissions, and use market means to achieve flexible carbon emission reduction in the energy structure adjustment process.
$\sum\limits_{k}{(A_{k}^{t}e_{k}^{t})}+E_{i,s}^{t}-E_{i,B}^{t}\le E_{i}^{t}$ (13)
(2) Carbon emission reduction constraint at the end of the planning period
This constraint ensures that the power planning scheme will ultimately achieve the goal of carbon emission reduction through the gradual adjustment of the power supply structure during the planning period.
$\sum\limits_{k}{(A_{k}^{t}e_{k}^{t})}\le E_{i}^{t}$ (14)
4.1 Discrete bacterial colony chemotaxis algorithm
The bacterial chemotaxis (BC) algorithm optimizes the objective by simulating the movement behaviours of bacteria in the chemical attractant environment, and with the idea of colony incorporated, the bacterial colony chemotaxis (BCC) algorithm was obtained [25]. The power planning problem proposed in this paper is essentially a multi-period discrete optimization problem. Therefore, the discrete bacterial colony chemotaxis algorithm (DBCC) was used to solve the problem [26]. The discrete update mechanism and the convergence process are as follows:
(1) Discrete update mechanism
Suppose that the year t is the starting point. if the unit j is put into construction, the unit will still be under construction in the years after the year t; if the unit is put into construction in the year t, the unit will not be under construction in the years before the year t. The discrete update mechanism is as follows:
$\begin{cases}N_{t-1, j}=0 & N_{t, j}=0 \\ N_{t+1, j}=1 & N_{t, j}=1\end{cases}$ (15)
where, $N_{t, j}$ is the construction state of the unit j in the year t.
(2) Convergence process
According to the initialized and updated positions of the bacterial colony, set the fitness value of each bacterial objective function, and determine the bacteria at favourable and unfavourable positions in the colony. Move the bacteria that are currently at unfavourable positions close to those at favourable positions to build an elite-centric colony of bacteria:
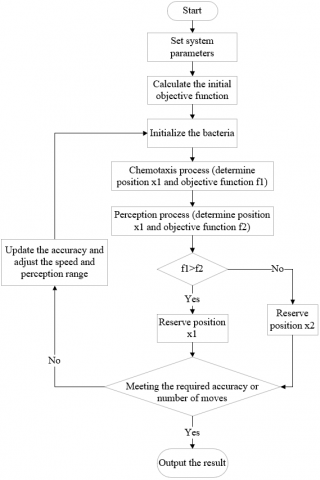
Figure 4. Solution process of the DBBC algorithm
$x_{w t}=x_{w t}+2 r_{a n d} \mathrm{()} \cdot\left(x_{b t}-x_{w t}\right)$ (16)
where, $r_{\text {and }} \mathrm{()}$ returns a function value that obeys the uniform distribution in (0, 1); $x_{w t}$ and $x_{b t}$ are the bacteria at unfavourable and favourable positions in the current bacterial colony, respectively.
4.2 Process flow of the algorithm
The solution process of the DBCC algorithm model is shown in Figure 4, and the specific process flow is described as follows;
Step 1: Initialize colony 1 and colony 2 according to the predicted load results, and check whether they meet the total resources and annual resources constraints. If the constraints are not met, regenerate the particles and check again until the constraints are met; if the constraints are met, go to step 2.
Step 2: Form a fitness function with the objective function and the constraint conditions of the low-carbon power planning, obtain the fitness value of each particle, compare the optimal particles in colony 1 and colony 2, and obtain the global optimal particle.
Step 3: Determine whether to converge or end the iteration. If yes, output the global optimal particle as the low-carbon power planning scheme; if no, use the global optimal particle to update colony 1 and colony 2 according to the DBCC algorithm, and return to step 2.
The initial particle size in the DBCC algorithm used was 300 particles/colony, and the maximum number of iterations was 2000. The maximum weight was 0.9, the minimum weight 0.4, the learning factor 2.0, and the mutation rate 0.8.
5.1 Test data
The proposed low-carbon power supply planning model was applied to optimize the planning of the power supply structure in a certain area from 2022 to 2031. Under the baseline scheme, the forecast data of the load growth during the planning period are shown in Table 1. The parameters of the original units in the system and the new units that can be installed are shown in Table 2 and Table 3, respectively. Suppose that a green certificate will be issued for every 1 $M W \bullet h$ of electric energy produced by renewable energy generator units, that the feed-in tariff of each unit during the planning period is shown in Table 4, and that the quotas and emissions for each year are shown in Table 5. For the convenience of calculation, it is assumed that each wind farm has 50 wind turbines.
5.2 Simulation results
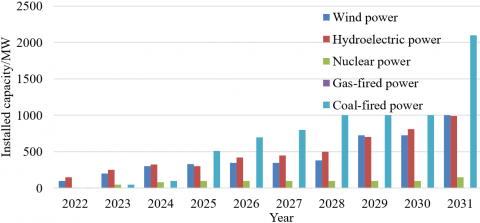
Under the baseline scheme, the DBCC algorithm was used to simulate the proposed model, and the cumulative newly installed capacity in each year of the planning period was obtained, as shown in Figure 5.
Table 1. Forecast data of load growth during the planning period
|
Year |
Annual maximum load /MV |
Annual electricity consumption /108kWh |
|
2022 |
3190 |
132 |
|
2023 |
3509 |
145.2 |
|
2024 |
3859.9 |
159.72 |
|
2025 |
4246 |
175.692 |
|
2026 |
4670.49 |
193.27 |
|
2027 |
5137.55 |
212.63 |
|
2028 |
5651.25 |
233.86 |
|
2029 |
6216.43 |
257.18 |
|
2030 |
6887.54 |
282.92 |
|
2031 |
7521.8 |
311.3 |
Table 2. Parameters of the original generator units
|
Type |
Coal-fired power |
Hydro-electric power |
Gas-fired power |
Wind power |
|
Capacity per unit/MW |
330 |
110 |
440 |
2.2 |
|
Number of units |
3.3 |
4.4 |
2.2 |
440 |
|
Annual utilization hours/h |
6600 |
6600 |
5500 |
2750 |
|
Minimum technical output |
0.33 |
0.33 |
0.33 |
0 |
Table 3. Parameters of the units that can be installed during the planning period
|
Type of unit |
Capacity per unit /MW |
Operating cost /(yuan/MW•h) |
Carbon emission intensity /(t/MW•h) |
Annual utilization hours/h |
Investment cost /(108 yuan/each) |
Minimum technical output |
Qty. |
Construction period/a |
|
Coal-fired units |
800 |
286.66 |
0.7491 |
8000 |
24.42 |
33 |
4 |
3 |
|
Coal-fired units |
500 |
314.16 |
0.8206 |
8000 |
14.19 |
0.4 |
11 |
2 |
|
Gas-fired units |
600 |
670.45 |
0.4851 |
7000 |
13.53 |
0.4 |
4 |
2 |
|
Nuclear power units |
1400 |
129.03 |
0 |
9800 |
132 |
0.5 |
1 |
55 |
|
Wind turbine generator units |
202 |
560.45 |
0 |
4500 |
0.22 |
0 |
550 |
1 |
|
Hydroelectric units |
300 |
495.55 |
0 |
5200 |
3.3 |
0.2 |
11 |
2 |
Table 4. Feed-in tariffs of different power sources during the planning period
|
Year |
Coal-fired units/(yuan/MW•h) |
Gas-fired units/(yuan/MW•h) |
Nuclear power units/(yuan/MW•h) |
Wind turbine generator units/(yuan/MW•h) |
Hydroelectric units/(yuan/MW•h) |
|
2022-2026 |
407 |
741.4 |
462 |
638 |
550 |
|
2027-2031 |
427.35 |
778.47 |
485.1 |
669.9 |
577.5 |
Table 5. Parameters of the different incentives in each year of the planning period
|
Year |
Carbon tax/(t/MW•h) |
Green certificate Price/(yuan/certificate) |
Carbon emission allowance/104 t |
Renewable energy quota factor |
|
2022 |
119 |
0.66 |
97.90 |
0.07 |
|
2023 |
125 |
0.77 |
96.80 |
0.08 |
|
2024 |
131 |
0.88 |
95.70 |
0.09 |
|
2025 |
138 |
0.99 |
94.60 |
0.10 |
|
2026 |
145 |
1.10 |
93.50 |
0.11 |
|
2027 |
152 |
1.21 |
92.40 |
0.12 |
|
2028 |
160 |
1.32 |
91.30 |
0.13 |
|
2029 |
165 |
1.43 |
90.20 |
0.14 |
|
2030 |
169 |
1.54 |
89.10 |
0.15 |
|
2031 |
177 |
1.65 |
88.00 |
0.17 |
Table 6. Costs and benefits during the planning period
|
Year |
Annual income / 108 yuan |
Electricity sales income / 108 yuan |
Investment costs / 108 yuan |
Operating costs / 108 yuan |
Income from trading of green certificates /104 yuan |
Income from carbon trading / 108 yuan |
|
2022 |
10.26 |
57.84 |
1.6 |
47.61 |
69.23 |
1.63 |
|
2023 |
10.52 |
63.96 |
1.7 |
53.03 |
70.26 |
1.27 |
|
2024 |
10.09 |
66.91 |
2.88 |
54.16 |
60.9 |
0.21 |
|
2025 |
11.89 |
71.02 |
1.77 |
56.43 |
37.87 |
-0.94 |
|
2026 |
13.99 |
77.7 |
0 |
61.51 |
14.36 |
-2.2 |
|
2027 |
13.19 |
87.18 |
3.21 |
66.75 |
-25.09 |
-4.03 |
|
2028 |
14.16 |
100.37 |
2.72 |
75.86 |
-79.7 |
-7.63 |
|
2029 |
14.7 |
105.52 |
2.52 |
80.58 |
-114.09 |
-7.71 |
|
2030 |
17.03 |
117.71 |
0 |
90.54 |
-167.2 |
-10.11 |
|
2031 |
14.96 |
124.96 |
2.03 |
93.7 |
-236.94 |
-14.25 |
Table 7. Comparison of the key indicators of the two models
|
Model |
Net income / 108 yuan |
Electricity sales income/ 108 yuan |
Total investment cost/108 yuan |
Total operating cost /108 yuan |
Total carbon emissions / 108 t |
|
Low-carbon scenario |
117 |
680.14 |
15.01 |
534.43 |
1.03 |
|
Conventional scenario |
148 |
630.98 |
17.04 |
521.44 |
1.07 |
It can be seen from Figure 5 that, during the planning period, hydroelectric units with lower investment costs and higher feed-in tariffs will be given priority for construction. Due to the higher investment costs and lower annual utilization hours, wind turbines will not be put into construction at a large scale in the early stage. With the increasingly stricter carbon emission and renewable energy quota constraints, more wind turbines will be put into construction. Due to the high operating costs and investment costs of gas-fired units, gas-fired units are not competitive under the baseline scheme and will not be put into construction; nuclear power units have the advantages of less resource consumption, less environmental impact and greater supply capacity, but due to their high investment costs and the long construction period (up to 5 years), these units will not be put into construction. The various costs and benefits of the system during the planning period (allocated to each planning year, and the investment costs are presented as dynamic investment costs) are shown in Table 6.
Figure 5. Cumulative newly installed capacity in the planning period
According to Table 6, in the early stage of planning, due to the high carbon emission quotas and the low renewable energy quota coefficient, the system will be able to meet the relevant targets set by the government, so it will gain income by selling carbon quotas and green certificates. With the carbon emission quotas and renewable energy quota constraints getting stricter, the carbon emission of the system in 2025 will exceed the carbon emission quota set in the same year, and thus it must purchase emission quotas to meet the relevant targets, and accordingly, the purchase of carbon emission quotas will gradually increase; in 2027, since the power generation of renewable energy generators will fail to meet the specified targets, that is, the specified renewable energy quota targets, set by the government, the system will have to purchase green certificates to meet the targets, and accordingly, this purchase will be on an upward trend year by year.
5.3 Comparison of scenarios
In this paper, a conventional model, which involves no low-carbon power technologies and carbon emission quota trading mechanism, was established for comparison with the low-carbon power planning model. The newly installed capacities of the two planning models in the last year of the planning period are shown in Figure 6, and the key indicators (converted to present values) under the two planning models during the planning period are shown in Table 7.
As can be seen from Figure 6, compared with the conventional planning model, under the low-carbon power planning model, the installed capacity of renewable energy generators and of gas-fired units, which have smaller unit emissions, will increase significantly. From Table 7, it can be seen that, during the planning period, the income of the proposed low-carbon power planning model will be reduced by 3.1 billion yuan, but the emissions of the system will be reduced by 4 million t, showing that it will promote the reduction of CO2 emissions from the system.
Figure 6. Installed capacities of different models in 2031
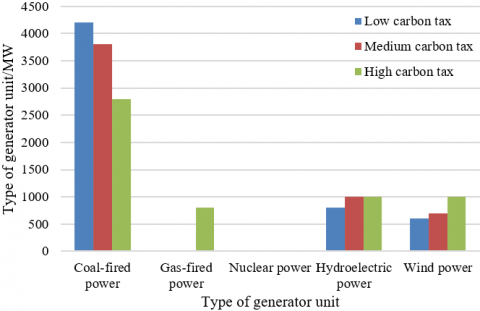
Figure 7. Newly installed capacities of the system under different carbon tax levels
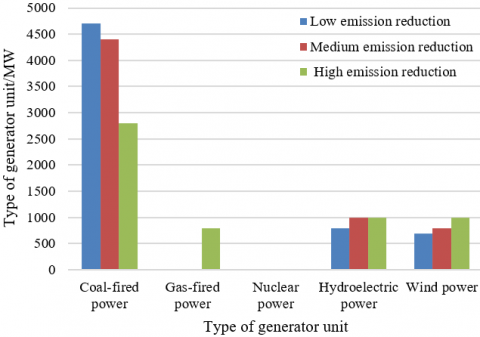
Figure 8. Newly-installed capacities of the system under different quota ratios
(1) Comparison under different carbon tax levels
Increase the carbon tax level under the baseline scheme by 20% and decrease it by 20% to form a high carbon tax scheme and a low carbon tax scheme. Apply the proposed low-carbon power planning model under different carbon tax levels to obtain different power planning schemes, as shown in Figure 7.
It can be seen from Figure 7 that changes in carbon tax will have great impacts on the construction of coal-fired and gas-fired units. When the carbon tax level is low, coal-fired units will be given priority due to their low operating costs; and the installed capacity of wind turbines will decrease due to their high investment costs and operating costs. When the carbon tax level is high, the installed capacities of both wind turbines and hydroelectric units will increase. And when such installed capacities reach the upper limit for hydroelectric units and wind turbines, considering that the gradual increase in the proportion of carbon emission permits trading costs in the objective function, gas-fired units will see their installed capacity increase to some extent due to their lower carbon emission intensity compared with that of coal-fired units.
(2) Impacts of different renewable energy quota ratios
Under the baseline scheme, with 2024 as the target year, increase the proportion of renewable energy quotas by 20% and decrease it by 20% respectively to obtain the planning schemes with different quota ratios, as shown in Figure 8.
It can be seen from Figure 8 that, with the increase in the proportion of renewable energy quotas, the installed capacity of the system will lean towards green energy generator units, and at the same time, the proportion of gas-fired units, which have relatively smaller carbon emissions, will increase.
This paper proposed a low-carbon power planning model based on the green certificate allocation mechanism. First, a new low-carbon power planning mode was established incorporating the green certificate allocation mechanism based on regional comparison and low-carbon power technologies. Then, with the goal of maximizing the net benefits of the system during the planning period, the low-carbon power planning model was constructed, and the DBCC algorithm was used to solve and optimize the model. After that, various low-carbon elements were designed in different low-carbon scenarios, and the results of the proposed model were compared with those of conventional power planning. The experiment verified the effectiveness of the proposed model in reducing carbon emissions in the power sector and increasing power generation income, showing that this paper has a certain guiding effect for low-carbon power planning.
This paper was supported by the National Social Science Foundation (Grant No.: 19BGL003).
[1] Lou, S.H., Lv, M.X., Wang, Y.C., Wu, Y.W. (2019). Generation investment expansion planning for wind power accommodation considering investment risk. Proceedings of the CSEE, 39(7): 1944-1955. http://dx.chinadoi.cn/10.13334/j.0258-8013.pcsee.172410
[2] Palmintier, B.S., Webster, M.D. (2015). Impact of operational flexibility on electricity generation planning with renewable and carbon targets. IEEE Transactions on Sustainable Energy, 7(2): 672-684. https://doi.org/10.1109/TSTE.2015.2498640
[3] Abdmouleh, Z., Alammari, R.A., Gastli, A. (2015). Review of policies encouraging renewable energy integration & best practices. Renewable and Sustainable Energy Reviews, 45: 249-262. https://doi.org/10.1016/j.rser.2015.01.035
[4] Pereira, S., Ferreira, P., Vaz, A.I.F. (2016). Optimization modeling to support renewables integration in power systems. Renewable and Sustainable Energy Reviews, 55: 316-325. https://doi.org/10.1016/j.rser.2015.10.116
[5] Lin, Z., Jiang, C., Chen, M., et al. (2020). Low-carbon economic operation of integrated energy system considering flexible loads. Electric Power Construction, 41(5): 9-18. http://dx.chinadoi.cn/10.12204/j.issn.1000-7229.2020.05.002
[6] Wang, X., Feng, X., Liu, T., Lan, Y., Cui, Y. (2020). A low-carbon economic dispatching for power grid integrated with wind power system considering right of using energy. Acta Energiae Solaris Sinica, 41(1): 255-263.
[7] Wang, H., Chen, B., Liao, K. (2019). Bi-optimal model for trans-provincial power generation trading based on low-carbon incentive clearing method. Renewable Energy Resources, 37(12): 1842-1849. http://dx.chinadoi.cn/10.3969/j.issn.1671-5292.2019.12.015
[8] Chen, X., Lv, J., McElroy, M.B., Han, X., Nielsen, C.P., Wen, J. (2018). Power system capacity expansion under higher penetration of renewables considering flexibility constraints and low carbon policies. IEEE Transactions on Power Systems, 33(6): 6240-6253. https://doi.org/10.1109/TPWRS.2018.2827003
[9] Abdin, I.F., Zio, E. (2018). An integrated framework for operational flexibility assessment in multi-period power system planning with renewable energy production. Applied Energy, 222: 898-914. https://doi.org/10.1016/j.apenergy.2018.04.009
[10] Hamidpour, H., Aghaei, J., Pirouzi, S., Dehghan, S., Niknam, T. (2019). Flexible, reliable, and renewable power system resource expansion planning considering energy storage systems and demand response programs. IET Renewable Power Generation, 13(11): 1862-1872. https://doi.org/10.1049/iet-rpg.2019.0020
[11] Koltsaklis, N.E., Georgiadis, M.C. (2015). A multi-period, multi-regional generation expansion planning model incorporating unit commitment constraints. Applied Energy, 158: 310-331. https://doi.org/10.1016/j.apenergy.2015.08.054
[12] Lund, P.D., Lindgren, J., Mikkola, J., Salpakari, J. (2015). Review of energy system flexibility measures to enable high levels of variable renewable electricity. Renewable and Sustainable Energy Reviews, 45: 785-807. https://doi.org/10.1016/j.rser.2015.01.057
[13] Kargarian, A., Hug, G., Mohammadi, J. (2016). A multi-time scale co-optimization method for sizing of energy storage and fast-ramping generation. IEEE Transactions on Sustainable Energy, 7(4): 1351-1361. https://doi.org/10.1109/TSTE.2016.2541685
[14] Oree, V., Hassen, S.Z.S., Fleming, P.J. (2017). Generation expansion planning optimisation with renewable energy integration: A review. Renewable and Sustainable Energy Reviews, 69: 790-803. https://doi.org/10.1016/j.rser.2016.11.120
[15] Pereira, S., Ferreira, P., Vaz, A.I.F. (2017). Generation expansion planning with high share of renewables of variable output. Applied Energy, 190: 1275-1288. https://doi.org/10.1016/j.apenergy.2017.01.025
[16] Tong, D., Zhang, Q., Zheng, Y., et al. (2019). Committed emissions from existing energy infrastructure jeopardize 1.5 C climate target. Nature, 572(7769): 373-377. https://doi.org/10.1038/s41586-019-1364-3
[17] Davis, S.J., Lewis, N.S., Shaner, M., et al. (2018). Net-zero emissions energy systems. Science, 360(6396): eaas9793. https://doi.org/10.1126/science.aas9793
[18] Jenkins, J.D., Luke, M., Thernstrom, S. (2018). Getting to zero carbon emissions in the electric power sector. Joule, 2(12): 2498-2510. https://doi.org/10.1016/j.joule.2018.11.013
[19] Schlachtberger, D.P., Brown, T., Schäfer, M., Schramm, S., Greiner, M. (2018). Cost optimal scenarios of a future highly renewable European electricity system: Exploring the influence of weather data, cost parameters and policy constraints. Energy, 163: 100-114. https://doi.org/10.1016/j.energy.2018.08.070
[20] Sepulveda, N.A., Jenkins, J.D., de Sisternes, F.J., Lester, R.K. (2018). The role of firm low-carbon electricity resources in deep decarbonization of power generation. Joule, 2(11): 2403-2420. https://doi.org/10.1016/j.joule.2018.08.006
[21] Luo, J., Lu, C., Meng, F. (2016). Generation Expansion Planning and Its Benefit Evaluation Considering Carbon Emission and Coal Supply Constraints. Automation of Electric Power Systems: 40(11): 47-52. http://dx.chinadoi.cn/10.7500/AEPS20150714011
[22] Chen, S., Liu, P., Li, Z. (2020). Low carbon transition pathway of power sector with high penetration of renewable energy. Renewable and Sustainable Energy Reviews, 130: 109985. https://doi.org/10.1016/j.rser.2020.109985
[23] Luderer, G., Vrontisi, Z., Bertram, C., et al. (2018). Residual fossil CO2 emissions in 1.5–2 C pathways. Nature Climate Change, 8(7): 626-633. https://doi.org/10.1038/s41558-018-0198-6
[24] Clack, C.T., Qvist, S.A., Apt, J., et al. (2017). Evaluation of a proposal for reliable low-cost grid power with 100% wind, water, and solar. Proceedings of the National Academy of Sciences, 114(26): 6722-6727. https://doi.org/10.1073/pnas.1610381114
[25] Hanak, D.P., Powell, D., Manovic, V. (2017). Techno-economic analysis of oxy-combustion coal-fired power plant with cryogenic oxygen storage. Applied Energy, 191: 193-203. https://doi.org/10.1016/j.apenergy.2017.01.049
[26] He, L., Lu, Z., Zhang, J., Geng, L., Zhao, H., Li, X. (2018). Low-carbon economic dispatch for electricity and natural gas systems considering carbon capture systems and power-to-gas. Applied Energy, 224: 357-370. https://doi.org/10.1016/j.apenergy.2018.04.119