Andriyanto Setyawan* | Susilawati Susilawati | Tandi Sutandi | Hafid Najmudin
© 2021 IIETA. This article is published by IIETA and is licensed under the CC BY 4.0 license (http://creativecommons.org/licenses/by/4.0/).
OPEN ACCESS
An experiment has been carried out for examining the performance of an air conditioning unit under constant outdoor wet-bulb temperature and varied dry-bulb temperature. During the experiment, the wet-bulb temperature of the compartment for outdoor unit was maintained at 22℃ and the dry-bulb temperature was varied from 24℃ to 36℃. The increase of outdoor air temperature results in the increase of supply air temperature, discharge temperature, suction temperature, and liquid line temperature. These cause the degradation of the air conditioner performance. An increase of power consumption by 1.4% and decrease of cooling capacity by 0.8% were observed for each 1℃ increase of outdoor air temperature. As a result, the energy efficiency ratio drops by 2% for each 1℃ increase of outdoor air temperature.
air conditioning, cooling capacity, energy efficiency ratio, outdoor air temperature
One of the important factors affecting the performance of an air conditioning unit is the outdoor air condition. When the outdoor air is hot and humid, the condenser ability to reject heat decreases. This causes the increase discharge and condensing temperature. Consequently, the compression ratio and work of compression increase, power consumption increases, and the overall efficiency decreases. Meanwhile, the energy supplied for air conditioning could reach 30% to 45% in commercial and residential buildings [1, 2]. Even, in Middle East the portion of energy consumption for building air conditioning could reach 70% [3].
Yau and Pean [4] reported that for every increase of 1℃ of outdoor air, the cooling capacity and coefficient of performance (COP) drops by 2%. The data was obtained from their study in an office building in Malaysia. It was also reported that the use of liquid-suction heat exchanger could improve the COP, especially for high outdoor ambient temperature
The reduced condenser air flow, as well as the increase of outdoor air temperature, also causes the increase of condensing temperature. This results degradation of air conditioner performance. A reduction of COP by 45% and increase of power consumption by 36% were reported by Elsayed et al. [5] when the temperature of air entering the condenser increase from 28℃ to 43℃. The data were resulted from their experiment with a split air conditioner with nominal capacity of 2.64 kW.
The presence of obstruction in the outdoor unit could also reduce the performance of air conditioner. A reduction of cooling capacity by about 46% and increase of power consumption by 31% were reported when an air-cooled condenser was subjected by an obstruction located in the front of condenser at a distance of 10 cm [6]. It was also informed that at distances of 50 cm or more, the obstruction has no significant effect on the performance of the air conditioner.
Avoiding the harmful effect of high outdoor air temperature is therefore needed to reduce the performance degradation of air conditioning system. Many efforts have been carried out. One of the efforts is by using evaporative cooling. A reduction of power drawn by compressor and improvement of COP were reported when evaporative coolers were used for in air cooled chiller [7]. The use of cold mist water was experimentally investigated instead of conventional evaporative cooler. The mist water was introduced in the inlet side of the condenser. Although producing the cold water itself needs an amount of energy, they reported that the overall performance of the chiller was improved with the use of such evaporative cooler.
Martinez et al. [8] claimed an improvement of COP by 10.6% by reducing the ambient air temperature before entering the condenser. It was accomplished by using an evaporative cooling pad with a certain thickness. This technique could also reduce the power consumption by 11.4% and increase cooling capacity by 1.8%. It was also reported that the use of the use of water condensate to cool the entering air of a condenser could reduce the power consumption as high as 6% and improvement of COP by 21.4% [9]. With this method, it was claimed that the compressor will have a longer life time due to the lower thermal stresses on its components.
Experiment of lowering outdoor air temperature before entering condenser of a window air conditioner has been carried out by Sawant et al. [10]. The evaporative cooling media was made from a type of grass. It was informed that a reduction of energy consumption up to 13% could be reached. Very wide variations of COP, cooling capacity, and condenser heat rejection of a split air conditioning unit were proposed by Tarish et al. [11]. They utilized EES software for analyzing the performance of the split unit by varying indoor and outdoor air temperature from 17℃ to 27℃ and 30℃ to 55℃, respectively. Climatic data from six selected locations in Iraq were employed in this study. The advantage of R-161 over R-22 and R-134a was reported for both exergy efficiency and COP when operated at the same conditions.
A high energy saving in the range of 42.5% to 64.0% was proposed [12] when hybrid air conditioning system is used. This system consists of a compressor, two evaporators and a heat exchanger and was combined into an ordinary air conditioning system and a fresh air conditioner.
Other popular methods for improving the performance of air conditioning system are replacing the expansion device with ejector, using nanoparticles and mix it with refrigerant or compressor oil, and increasing subcooling of liquid refrigerant [13]. Sumeru et al. [14] informed a reduction of exergy loss with the use of ejector for expansion device with refrigerant R290. Meanwhile, an improvement of COP by 16.4% and reduction of energy consumption by 5.9% were reported from an experiment with water condensate to increase refrigerant subcooling in the condenser outlet [15].
On the contrary to outdoor air temperature, the outdoor humidity has no significant influence on the performance of an air conditioning unit. Setyawan dan Badarudin [16] informed an almost constant cooling capacity, power consumption, and energy efficiency ratio (EER) of air conditioning when it was tested at relative humidity of 40, 50, 60, and 70% while the temperature of outdoor air was constant at 35℃. The variation of cooling capacity, power consumption, and EER were only 0.2%, 0.23%, and 0.15%, respectively.
Other factor that affects the performance of an air conditioner, especially the cooling capacity, is the heat transfer in the evaporator. This parameter depends on the flow pattern of refrigerant in the evaporator [17].
This paper evaluates the performance of an air conditioning unit when it was subjected to the variation of outdoor dry-bulb temperature while the wet-bulb temperature was kept at a constant value. The change of operating conditions due to the variations of outdoor temperature will be discussed. The performance of the air conditioning unit, i.e. the cooling capacity, power consumption, and energy efficiency ratio, will also be examined.
2.1 Experimental setup
The experiment for observing the performance of air conditioning unit was conducted in a psychrometric chamber. In this experiment, the outdoor and indoor units of the air conditioner were placed in outdoor and indoor compartments of the chamber (Figure 1). The outdoor air dry-bulb temperature was varied at 24 to 36℃ while the wet-bulb temperature was maintained constant at 22℃ (Figure 2 and Table 1). For the range of test conditions, the relative humidity of the outdoor compartment varies from 29.1% to 84.2%. The highest relative humidity is found for the lowest dry-bulb temperature.
To obtain the desired outdoor compartment condition, a cooling coil, heater, and humidifier were installed in the chamber. When the temperature of outdoor side is too high, the cooling coil cools the air to the desired value. The heater is used when the air temperature in the outdoor side is too low. Humidifier is used to add the moisture content of the air. When moisture content is too high, it will be condensed in the cooling coil. The fan is used to supply air with the desired flow rate in the outdoor side.
In the indoor compartment, the air dry-bulb and wet-bulb temperature were maintained at 27.3℃ and 19.3℃, respectively, according to ISO 5151:2017. This combination gives a room dew point of 15.5°C. Therefore, the air conditioning unit should be operated at evaporator coil temperature below the dew point to handle sensible and latent load in the compartment. In this study, the evaporator temperature or the apparatus dew point of the air conditioning unit was set at about 5°C. To maintain the desired compartment condition, an electric heater and a cooling coil were also installed to add and subtract sensible energy in the indoor compartment. In addition, a humidifier was prepared to add latent energy to this compartment.
Figure 1. Experimental setup. During the experiment, the outdoor side was maintained at the conditions based on Table 1 and the performance of indoor unit was observed by the measurement of Tr, Twr, Ts, Tws, and vs
Figure 2. Outdoor design condition for the experiment. Points 1-7 represent the air conditions of the outdoor compartment. Dry-bulb temperature is varied while wet-bulb temperature is maintained constant at 22℃
Table 1. Outdoor air conditions for experiment
|
Run # |
Tdb (℃) |
Twb (℃) |
RH (%) |
|
1 |
24 |
22 |
84.2 |
|
2 |
26 |
22 |
70.9 |
|
3 |
28 |
22 |
59.6 |
|
4 |
30 |
22 |
50.0 |
|
5 |
32 |
22 |
41.8 |
|
6 |
34 |
22 |
34.9 |
|
7 |
36 |
22 |
29.1 |
2.2 Calculation of cooling capacity
The measurement of return air and supply air temperature and air flow rate at supply side in Figure 1 were carried out to obtain the cooling capacity. These parameters were measured after the system reaches a stable operation. Calculation of the cooling capacity employs the following formula:
$q_{e}=\dot{m}\left(h_{R A}-h_{S A}\right)$ (1)
where, qe represents the cooling capacity, $\dot{m}$ is mass flow rate of air across evaporator, and h is the air specific enthalpy. Subscripts RA and SA represent return and supply air. Once the dry and wet-bulb temperatures are known, the air enthalpy could be determined. The supply air mass flow rate was measured at the supply side of the evaporator as shown in Figure 1.
The specific enthalpy of moist air (mixture of dry air and water vapor) can be calculated by
$h=h_{a}+x h_{w}$ (2)
where, hais specific enthalpy of air (kJ/kg), x is humidity ratio (kg of water vapor/kg of dry air), and hw is specific enthalpy of water vapor.
For dry air, the specific enthalpy at constant pressure condition can be calculated by
$h_{a}=c_{p a} t$ (3)
In Eq. (3), t is the air temperature (℃) and cpa represents the air specific heat at constant pressure (kJ/kg×℃). For the range of air temperature between -100℃ and +100℃, the air specific heat is 1.006 kJ/kg×℃.
For the water vapor, the specific enthalpy at constant pressure can be expressed by
$h_{w}=c_{p w} t+h_{w e}$ (4)
Here, hw is the enthalpy of water vapor (kJ/kg), cpw is specific heat of water vapor (kJ/kg×℃), and hwe is latent heat of evaporation of water (kJ/kg).
By using the expressions of Eq. (2-4), the enthalpy of moist air can be calculated by
$h=c_{p a} t+x\left(c_{p w} t+h_{w e}\right)$ (5)
The mass flow rate of the supply air can be expressed by using the multiplication of air flow rate (Q) and air density (r), or
$\dot{m}=Q \rho$ (6)
In Eq. (6), the volumetric flow rate is expressed in m3/s while the air density is expressed in kg/m3.
Another expression for mass flow rate of air is
$\dot{m}=\frac{Q}{v}$ (7)
In the last equation, v represents the specific volume of air and can be found in psychrometric chart.
The amount of energy added by the heater, cooling coil, and humidifier can also be used to determine the cooling capacity of the air conditioning unit, bot sensible and latent capacity.
2.3 Energy efficiency ratio
To calculate the energy efficiency ratio (EER), the power consumption of the air conditioning system must be measured first. This includes the power for the compressor, evaporator fan, condenser fan, and control system. Once the power consumption (P) is measured, the EER is then calculated as follows
$E E R=\frac{\text { cooling capacity }}{\text { power consumption }}=\frac{q_{e}}{P}$ (8)
2.4 Refrigeration cycle
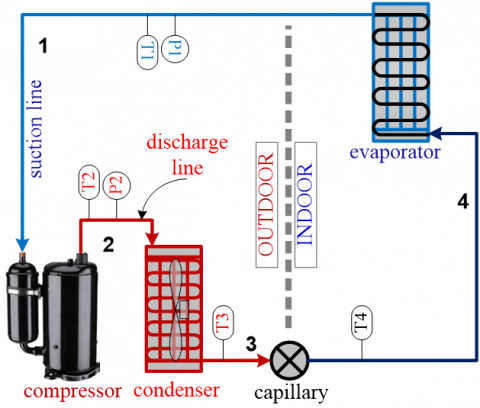
The operating conditions of the air conditioning unit could be determined by the measurement of pressure and temperature of refrigerant in the refrigeration cycle. Figure 3 shows the diagram of refrigeration cycle for the air conditioning unit and its measuring points. The cycle of refrigerant in the following passage. Low temperature and low pressure vapor refrigerant from the evaporator (1) is sucked and compressed by the compressor and results in high temperature and high pressure refrigerant vapor (2). The hot refrigerant is then cooled and condensed by the condenser. Here, the refrigerant temperature drops and the there is a phase change from vapor to liquid. In condenser coil, two-phase flow of refrigerant is found. The liquid refrigerant (3) flows across the capillary tube, in which its pressure and temperature is reduced. At the outlet of capillary tube, the low temperature and low-pressure refrigerant is in mixture of liquid and vapor (4). In the evaporator, refrigerant absorb heat from surrounding and evaporates. Two-phase flow of refrigerant is generally found in this system [18, 19]. The flow pattern of refrigerant commonly found in evaporator is slug, annular, and wavy [17].
Figure 3. Diagram of air conditioning system and its measuring points
By referring to Figure 3, the suction pressure and temperature of refrigerant could be obtained by measurement at point 1. The discharge pressure and temperature are measured at point 2. Point 3 represents the measurement point for liquid line temperature, while point 4 is for the measurement of refrigerant temperature entering the evaporator.
The experiment was carried out by using a split-type air conditioner with a nominal capacity of 9000 Btu/h. This unit uses refrigerant R32 as working fluid. The refrigerant has a normal boiling point (NBP) of -51.65℃, molecular weight of 52.02 kg/kmol, and critical temperature of 78.11℃. At atmospheric pressure, it has a latent heat of vaporization of 381.86 kJ/kg and saturated vapor density of 2.9879 kg/m3.
The time-series sample data for supply-air temperature, refrigerant suction temperature, refrigerant discharge temperature, and refrigerant liquid line temperature are presented in Figures 4-7. These data were collected during the tests with 7 different outdoor air conditions, in which the dry-bulb temperature was varied while the wet-bulb temperature was kept constant at 22℃.
3.1 Supply-air temperature
The supply air temperature represents the temperature of air at the outlet of evaporator or indoor unit. The plot of supply air temperature as a function of time is shown in Figure 4. The plot is presented to show the fluctuation of supply air temperature during the experiment. It is evident that the supply air temperature is also influenced by the outdoor air temperature.
As can be seen in Figure 4, for the lowest outdoor air temperature (24℃), the supply air temperature ranges from 13.74 to 14.21℃ with an average of 13.95℃. As the temperature of outdoor air increases to 26℃, the supply air temperature increases to 14.07℃ in average. At the highest outdoor dry-bulb temperature, the supply air has an average temperature of 14.76℃.
Figure 4. Time-series sample data for supply air temperature
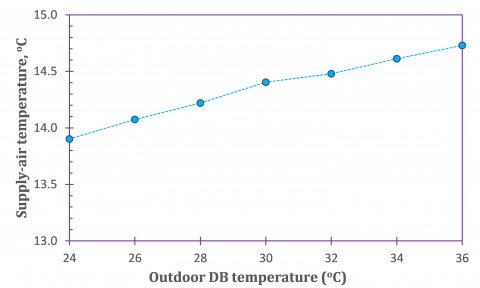
Averaging the supply-air temperature and plotting it against outdoor air temperature results in the chart of Figure 5. This chart represents the effect of outdoor air temperature on the supply air temperature. As the outdoor air temperature increase, the supply air gets warmer. Linear interpolation of the line in Figure 5 results in the increase of supply air temperature 0.068℃ for each 1℃ increase of outdoor air temperature under constant wet bulb temperature of 22℃. The relationship between the supply air temperature and outdoor air dry-bulb temperature is expressed in the following expression:
$t_{S A}=0.0681 t_{D B, O A}+12.302$ (9)
where, tSA is supply air temperature and tDB,OA represents the outdoor air dry-bulb temperature.
Figure 5. Effect of outdoor air temperature on supply air temperature
3.2 Refrigerant discharge temperature
During the test, the temperature of refrigerant at the discharge side was measured. The plots discharge temperature as a function of time is presented in Figure 6. It represents the temperature of refrigerant in the vapor phase after being compressed by the compressor. The measurement of this parameter was conducted in point 2 of Figure 3.
As the outdoor temperature increases, the discharge temperature also increases. For outdoor air temperature of 24℃, the discharge temperature is 88.38℃ in average. It increases to 89.5℃ when the outdoor air temperature increases to 26°C. Further increase of outdoor air to 28, 30, and 32℃ result in the increase of discharge temperature to 90.88, 92.72, and 94.04℃, respectively. For the outdoor air temperature of 32 and 34℃, the discharge temperature increases to 94.79 and 96.76℃, respectively.
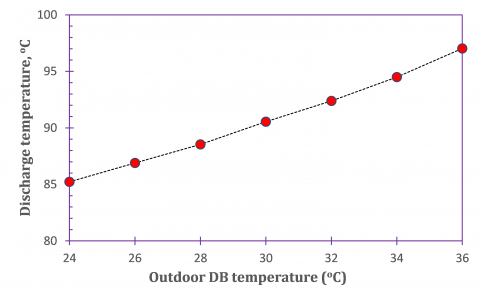
The plot of the average refrigerant discharge temperature as a function of outdoor air temperature is shown in Figure 7. For outdoor temperature of 24 to 36℃, the average discharge temperature changes from 88.4 to 96.7℃.
By using linear interpolation, an increase of discharge temperature by 0.97℃ is resulted for each 1℃ increase of outdoor air temperature. The effect of outdoor air dry-bulb temperature on discharge temperature of refrigerant is presented in the following expression
$t_{D}=0.9718 t_{D B, O A}+61.574$ (10)
where, tD represents the discharge temperature of refrigerant.
Figure 6. Discharge temperature of refrigerant for outdoor air temperature of 24℃ to 36℃. The discharge temperature increases with the increase of outdoor air temperature
Figure 7. Effect of outdoor air temperature on refrigerant discharge temperature
3.3 Refrigerant suction temperature
The suction line temperature of refrigerant was measured at the compressor inlet. This parameter represents the refrigerant condition leaving the evaporator after absorbs heat from the surroundings. In Figure 3, the measurement location is given by point 1. The fluctuation of suction temperature as a function of time is presented in Figure 8.
For the lower outdoor temperatures of 24, 26, and 28℃, the average suction temperatures of refrigerant are 10.15, 10.32, and 10.56℃, respectively. Meanwhile, for the higher outdoor air temperature of 32, 34, and 36℃, the refrigerant suction temperatures are 10.94, 11.14, and 11.62℃, respectively. Therefore, it is apparent that the increase of outdoor air temperature causes the increase of refrigerant suction temperature, as can be seen in Figure 9. By using linear interpolation, each 1℃ increase of outdoor temperature with constant wet-bulb temperature of 22℃ gives an increase of refrigerant suction temperature by 0.115℃. The influence of outdoor air dry-bulb temperature on suction temperature of refrigerant (tS) is expressed as follows
$t_{S}=0.115 t_{D B, O A}+7.32$ (11)
In this case, the increase of suction line temperature is probably caused by the increase of the suction pressure. When the discharge pressure increase, the suction pressure will also increase as the pressure drop of the capillary tube (as an expansion device) in the refrigeration machine is relatively constant.
Figure 8. Refrigerant suction temperature
Figure 9. Effect of outdoor air temperature on suction temperature
3.4 Refrigerant liquid line temperature
In the experiment, the refrigerant liquid line temperature was also measured at the condenser outlet before entering the capillary tube (point 3 in Figure 3). It represents the temperature of high-pressure refrigerant in liquid phase after being condensed by the condenser. In a refrigeration system, the lower liquid line temperature usually gives the better performance. The fluctuation of liquid line temperature as a function of time for varied outdoor air temperature is depicted in Figure 10. The average liquid line temperatures are 25.60℃, 29.02℃, and 31.17℃ for outdoor air temperature of 24℃, 26℃, and 28℃, respectively. The liquid line temperature increases to 34.07℃, 35.18℃, and 37.7℃ when the outdoor temperature increases to 32℃, 34℃, and 36℃, respectively. The increase of liquid line temperature with the increase of outdoor air temperature is mainly caused by the reduction of heat dissipation of refrigerant in the condenser when the outdoor temperature increase.
Figure 11 shows the average liquid line temperature as a function of outdoor air temperature. It represents the effect of outdoor air temperature on the temperature of liquid refrigerant in the liquid line. To decrease the temperature of liquid line, the use of liquid-suction heat exchanger was suggested. It was reported that this method can upgrade the performance of air conditioning unit using R22, R32, R410A, and R290 [13].
Figure 10. Liquid line temperature of refrigerant for outdoor air temperature of 24℃ to 36℃. The temperature of liquid refrigerant increases with the increase of outdoor air temperature
Based on linear interpolation, each 1℃ increase of outdoor air temperature from 24 to 36℃ provides an increase of liquid line temperature by 1.01℃. For this experiment, the effect of outdoor air dry-bulb temperature on the liquid line temperature of refrigerant can be written by the following expression
$t_{L L}=1.01 t_{D B, O A}+1.214$ (12)
where, tLL represents the liquid line temperature of refrigerant.
Figure 11. Effect of outdoor air temperature on liquid line temperature
3.5 Power consumption
The power consumption represents the power drawn by all components of air conditioning unit, including the compressor, condenser fan, evaporator fan, and control system. For the lowest outdoor air temperature (24℃), the average power absorbed by the cooling unit is 814.6 W. The power increases to 833.2 W when the outdoor air temperature increases to 26℃. Further increase of outdoor air temperature to 28℃ causes the power increases to 858.4 W. The power continuously increases to 950.3 W for the highest outdoor air temperature of 36℃. It can be seen in Figure 12 that for outdoor temperature range of 24℃ to 36℃, the required power to operate the cooling unit almost linearly increases with the increase of outdoor air temperature. For the given range, the power consumption increases by approximately 11.3 W for each 1℃ increase of outdoor air temperature. If expressed in percentage, each 1℃ increase of outdoor air temperature under constant wet-bulb temperature gives 1.4% increase of power required to operate the air conditioning unit. For this experiment, the effect of outdoor air temperature on the power consumption in Watts (P) can be expressed as follows
$P=11.333 t_{D B, O A}+540.99$ (13)
Figure 12. Power consumption of air conditioning unit for outdoor air temperature of 24℃ to 36℃. The power drawn by the unit increases with the increase of outdoor air temperature
As a comparison, it was reported that obstruction of the air flow in the front and side of condenser gives an increase of power consumption by 2.4% for each 1℃ of increase of condensing temperature [6]. Kumbhar et al. [20], whereas, informed that each 1℃ increase of condensing temperature gives an increase of input power by 1.7% based on their experiment using water chiller.
3.6 Cooling capacity
The cooling capacity represents the ability of the air conditioning unit to remove heat from the air passing through the evaporator. Operated under the lowest outdoor air temperature, the cooling capacity was found to be 2804.5 W. It decreases to 2773 and 2724 W when the outdoor air temperature increases to 26 and 28℃, respectively. For the highest outdoor air temperature (36℃), the capacity drops to 2534.7 W (Figure 13). In average, each increase of 1℃ of outdoor air temperature under constant wet-bulb temperature results in the decrease of cooling capacity by 22.5 W. By percentage, the decrease of cooling capacity is 0.8% per 1℃ increase of outdoor air temperature. The expression for the effect of outdoor air temperature on the cooling capacity (qe) is as follows
$q_{e}=-22.812 t_{D B, O A}+3355.6$ (14)
Figure 13. Effect of outdoor air temperature on cooling capacity
3.7 Energy efficiency ratio
The energy efficiency ratio can be calculated when the power consumption and cooling capacity data are available. Simply, EER is the ratio between cooling capacity and power consumption. Here, the cooling capacity is expressed in Btu/hr, while the power consumption is expressed in Watts. The EER of the air conditioning unit resulted from experiment is presented in Figure 14.
The highest EER is found for the lowest outdoor temperature of 24℃. In this condition, the EER is found to be 11.75. As the outdoor temperature increases to 26℃, the EER decreases to 11.33. Further increase of outdoor air to 28, 30, and 32℃ result in the decrease of EER to 10.82, 10.24, and 9.96, respectively. When the outdoor temperature increases to 34 and 36℃, the EER drops to 9.52 and 8.97, respectively. For this experiment, the relationship between outdoor air temperature and EER can be expressed as follows
$E E R=-0.228 t_{D B, O A}+17.22$ (15)
In percentage, each 1℃ increase of outdoor air temperature results in the drop of EER by 2%, averagely. The reduction of EER was also confirmed from an experiment by varying wind orientation in air condenser [21]. Using wind velocity of 6.2 m/s, it was informed that the EER could drop by 16.5% when the wind is normally subjected to the front of the outlet of air-cooled condenser.
Figure 14. Effect of outdoor air temperature on energy efficiency ratio
Experiment on the performance of an air conditioning unit has been carried out. During the test, the wet-bulb temperature of the compartment for outdoor unit was maintained at 22℃ and its dry-bulb temperature was varied from 24℃ to 36℃.
Generally, the increase of outdoor air temperature changes the operating conditions of the air conditioner. It can be seen from the increase of supply air temperature, discharge temperature, suction temperature, and liquid line temperature. An increase of supply air temperature by 0.068℃ is resulted for each 1℃ increase of outdoor air temperature. Refrigerant discharge, suction, and liquid line temperature increase by 0.97℃, 0.115℃, and 1.01℃, respectively, for each 1℃ of the increase of outdoor air temperature.
The changes of the operating conditions result in the degradation of the performance of the air conditioner. An increase of power consumption by 11.3 Watts (or 1.4%) is observed for each 1℃ increase of outdoor air temperature. For the same case, the cooling capacity decreases by 22.5 Watts (or 0.8%). As a result, the energy efficiency ratio drops by 2% for each 1℃ increase of outdoor air temperature.
The authors wish to thank to the Ministry of Education and Culture of the Republic of Indonesia, Politeknik Negeri Bandung, and Balai Besar Bahan dan Barang Teknik (B4T) for the kind supports of this research.
|
COP |
coefficient of performance |
|
cp |
specific heat (kJ/kg·℃) |
|
EER |
energy efficiency ratio |
|
h |
specific enthalpy of refrigerant/air (kJ/kg) |
|
$\dot{m}$ |
mass flow rate (kg/s) |
|
P |
power required (Watt) |
|
q |
cooling capacity (Watt) |
|
Q |
volumetric flow rate (m3/s) |
|
t |
temperature (℃) |
|
x |
humidity ratio (kg water vapor/kg dry air) |
|
Greek symbols |
|
|
ρ |
density (kg/m3) |
|
Subscripts |
|
|
a |
air |
|
D |
discharge |
|
DB |
dry-bulb |
|
LL |
liquid line |
|
OA |
outdoor air |
|
RA |
return air |
|
S |
suction |
|
SA |
supply air |
|
w |
water vapor |
|
WB |
wet-bulb |
[1] Jahangeer, K.A., Tay, A.A.O., Islam, M.R. (2011). Numerical investigation of transfer coefficients of an evaporatively cooled condenser. Applied Thermal Engineering, 31(10): 1655-1663. https://doi.org/10.1016/j.applthermaleng.2011.02.007
[2] Kalkan, N., Young, E.A., Celiktas, A. (2012). Solar thermal air conditioning technology reducing the footprint of solar thermal air conditioning. Renewable and Sustainable Energy Reviews, 16(8): 6352-6383. https://doi.org/10.1016/j.rser.2012.07.014
[3] Al Horr, Y., Tashtoush, B., Chilengwe, N., Musthafa, M. (2020). Operational mode optimization of indirect evaporative cooling in hot climates. Case Studies in Thermal Engineering, 18: 100574. https://doi.org/10.1016/j.csite.2019.100574
[4] Yau, Y.H., Pean, H.L. (2014). The performance study of a split type air conditioning system in the tropics, as affected by weather. Energy and Buildings, 72: 1-7. https://doi.org/10.1016/j.enbuild.2013.12.010
[5] Elsayed, A.O., Hariri, A.S., Ikwebe, J., et al. (2011). Effect of condenser air flow on the performance of split air conditioner. World Renewable Energy Congress, Sweden, pp. 2134-2141. http://dx.doi.org/10.3384/ecp110572134
[6] Setyawan, A. (2020). Effect of air flow obstruction in a condensing unit on split air conditioner performance. Jurnal Teknologi, 82(5): 23-30. https://doi.org/10.11113/jt.v82.14185
[7] Kabeel, A.E., El-Samadony, Y.A.F., Khiera, M.H. (2017). Performance evaluation of energy efficient evaporatively air-cooled chiller. Applied Thermal Engineering, 122: 204-213. https://doi.org/10.1016/j.applthermaleng.2017.04.103
[8] Martinez, P., Ruiz, J., Cutillas, C.G., Martinez, P.J., Kaiser, A.S., Lucas, M. (2016). Experimental study on energy performance of a split air-conditioner by using variable thickness evaporative cooling pads coupled to the condenser. Applied Thermal Engineering, 105: 1041-50. https://doi.org/10.1016/j.applthermaleng.2016.01.067
[9] Ibrahim, N.I., Al-Farayedhi, A.A., Gandhidasan, P. (2017). Experimental investigation of a vapor compression system with condenser air pre-cooling by condensate. Applied Thermal Engineering, 110: 1255-1263. https://doi.org/10.1016/j.applthermaleng.2016.09.042
[10] Sawant, A.P., Agrawal, N., Nanda, P. (2012). Performance assessment of an evaporative cooling-assisted window air conditioner. International Journal of Low-Carbon Technologies, 7(2): 128-136. https://doi.org/10.1093/ijlct/ctr029
[11] Tarish, A.L., Hamzah, M.T., Jwad, W.A. (2020). Thermal and exergy analysis of optimal performance and refrigerant for an air conditioner split unit under different Iraq climatic conditions. Thermal Science and Engineering Progress, 19: 1-12. https://doi.org/10.1016/j.tsep.2020.100595
[12] Yang, Y., Ren, C., Wang, Z., Luo, B. (2020). Theoretical performance analysis of a new hybrid air conditioning system in hot-dry climate. International Journal of Refrigeration, 116: 96-107. https://doi.org/10.1016/j.ijrefrig.2020.03.015
[13] Tritjahjono, R.I., Sumeru, K., Setyawan, A., Sukri, M.F. (2019). Evaluation of subcooling with liquid-suction heat exchanger on the performance of air conditioning system using R22/R410A/R290/R32 as refrigerants. Journal of Advanced Research in Fluid Mechanics and Thermal Sciences, 55(1): 1-11.
[14] Sumeru, K., Pratikto, Setyawan, A., Abioye, A.M. (2019). The influence of room and ambient temperatures of exergy loss in air conditioning using ejector as an expansion device with R290 as working fluid. E3S Web of Conferences, 130: 01019. https://doi.org/10.1051/e3sconf/201913001019
[15] Sumeru, K., Pramudantoro, T.P., Setyawan, A. (2018). Experimental investigation on the performance of residential air conditioning system using water condensate for subcooling. MATEC Web of Conferences, 197: 08002. https://doi.org/10.1051/matecconf/201819708002
[16] Setyawan, A., Badarudin, A. (2020). Performance of a residential air conditioning unit under constant outdoor air temperature and varied relative humidity. IOP Conference Series: Materials Science and Engineering, 830: 042032. https://doi.org/10.1088/1757-899X/830/4/042032
[17] Setyawan, A. (2020). Effects of evaporating temperature on flow pattern in a horizontal evaporator. Frontiers in Heat and Mass Transfer (FHMT), 14(22): 1-6. http://dx.doi.org/10.5098/hmt.14.22
[18] Setyawan, A., Indarto, I., Aan, D. (2019). Measurement of liquid holdup by using conductance probe sensor in horizontal annular flow. Journal of Advanced Research in Fluid Mechanics and Thermal Sciences, 53(1): 11-24.
[19] Setyawan, A., Indarto, I., Aan, D. (2019). Simplified correlation for liquid holdup in a horizontal two phase gas-liquid annular flow. Journal of Advanced Research in Fluid Mechanics and Thermal Sciences, 62(1): 20-30.
[20] Kumbhar, A., Gulhane, N., Pandure, S. (2017). Effect of various parameters on working condition of chiller. Energy Procedia, 109: 479-486. https://doi.org/10.1016/j.egypro.2017.03.076
[21] Setyawan, A. (2020). The effects of wind orientation on the performance of a split air conditioning unit. AIP Conference Proceedings, 2248: 070002. https://doi.org/10.1063/5.0013163