Guglielmina Mutani* | Edoardo De Nicolò | Laura Blaso | Simonetta Fumagalli | Antonella Tundo
© 2021 IIETA. This article is published by IIETA and is licensed under the CC BY 4.0 license (http://creativecommons.org/licenses/by/4.0/).
OPEN ACCESS
This paper aims to propose a procedure for calculating the energy performance indexes of buildings considering the seasonality of internal gains due to artificial lighting with a monthly quasi-steady-state energy balance. The proposed methodology evaluates the heat gains due to the integrated natural-artificial lighting system with the Lighting Energy Numerical Indicator (LENI). For the evaluation of buildings’ global energy performance and for some energy services, this contribution cannot be considered constant annually as depend strongly by climate conditions. The effect of daylighting, type of light sources-luminaires, building orientation and shading devices could influence lighting contribution of the internal heat gains. Then, the proposed methodology evaluates the internal heat gains with monthly energy balances. This methodology was applied to the case study of the "Brancaccio" retirement home in Matera (IT) for which the values of the energy performance indexes were compared with the standard normative approach using constant internal heat gains. The results of this work underline the importance of performing a detailed analysis that considers the availability of natural light in the different months of the year, the efficiency of the different lighting systems and their power installed per unit of area as a function of the lighting comfort requirements in the different types of environments.
LENI, artificial lighting, energy performance indicator, energy certification, heat gains, light control systems, nZEB, smart buildings
The energy consumption of buildings has a strong environmental impact and has been widely debated and constantly a developing topic. The European Union has issued a series of specific directives that require the verification of the energy performance of all buildings (existing and new construction) in terms of global consumption, with limit values not to be exceeded. Electrical energy covered an important quota of final energy consumption and lighting can be a significant part of this electrical consumption, especially in residential buildings [1].
In Italy, the Ministerial Decree of 26/06/2015, which entered into force on October 1st 2015, introduced important innovations regarding energy efficiency and low-carbon technologies. Among these, the energy class of buildings must be assessed in terms of non-renewable primary energy through the global non-renewable energy performance index EPgl,nren as the sum of the non-renewable energy indexes for each energy service [2, 3]:
$\mathrm{EP}_{\mathrm{gl}, \text { nren }}\quad=\mathrm{EP}_{\text {H,nren }}\quad+\mathrm{EP}_{\text {C,nren }}\quad+\mathrm{EP}_{\mathrm{W}, \text { nren }}\quad+\mathrm{EP}_{\mathrm{V}, \text { nren }}\quad+\mathrm{EP}_{\mathrm{T}, \text { nren }}\quad+\mathrm{EP}_{\mathrm{L}, \text { nren }}$ (1)
This energy performance index EP is expressed in kWh/m2/year so as to consider only the level of energy efficiency of the building and not its size. It takes into account the non-renewable primary energy requirement for all energy services in a building: space heating and cooling (EPH,nren and EPC,nren), hot water production (EPW,nren), ventilation (EPV,nren), and, for non-residential sectors, transport of people or things (EPT,nren) and artificial lighting (EPL,nren).
The annual energy performance indicator EPgl,nren is also used to classify the buildings with an energy performance certification [4, 5] and the EPgl,nren is therefore calculated through methodologies codified by technical standards and national legislation, in transposition of European directives.
The “family” of UNI/TS 11300 Technical Standards was created with the aim of defining a unique calculation methodology for determining the energy performance of buildings with a monthly quasi-steady-state calculation method. In these six Standards, the internal heat gains, due to people, electrical equipment and lighting systems, are evaluated through a constant annual average value depending on the type of user. In this work, this approach is investigated in particular with regard to the role played by heat gains due to the lighting system [6]. The use of a standardized average value [7] does not consider crucial factors such as the differences in: the availability of natural light in the various months of the year and for different climates [8], the effect of shading devices, the efficiency of the lighting systems and the electrical power installed per unit of surface area as a function of the lighting comfort requirements in the different environments. The calculation of internal heat gains for lighting must, therefore, be approached with greater precision, since it can contribute significantly to the final energy performance of a building.
Moreover, in Eq. (1) the different contributions (heating, cooling, hot water production, ventilation, transport and lighting) can be considered separately, evaluating the mutual influence on the global non-renewable energy performance index EPgl,nren. For example, the use of inefficient light sources results in a greater contribution of thermal energy to the environment, which translates into a decrease in energy consumed for space heating (EPH), a greater consumption of energy for space cooling (EPC) and an increase of the consumption of the lighting system (EPL).
The analysis conducted in this work starts from previous research about the investigation of the lighting system on the energy performance of an office building [9]. Further research will analyze the effect of various lighting systems on the energy performance of buildings with an hourly time step [10].
The description of the methodology used in this work is explained in Section 2, the case study is presented in Section 3 and the results are discussed in Section 4.
The proposed work aims to identify a new procedure for the calculation of internal heat gains related to the integrated natural-artificial lighting system for the calculation of the energy performance of buildings. Moreover, for a case study, a comparison of the energy performance indexes that are obtained through the two different approaches: with constant internal heat gains and with a monthly variation due to influence of the lighting system, as suggested by the authors.
The calculation of energy performance indicators is carried out, in both cases, according to the monthly quasi-steady-state calculation method of the technical standards UNI/TS 11300; only the evaluation of internal heat gains follows two different paths.
If the above-mentioned standards consider the total internal heat gains with a constant annual average value (e.g. 6 W/m2 for office buildings and 8 W/m2 for buildings used as hospitals, retirement homes and similar), the proposed procedure evaluates separately the contribution of internal heat gains for lighting and then adds it to the other contributions related to the occupation and use of electrical appliances. In particular, the heat gains for lighting are calculated on the basis of energy efficiency of the lighting system, evaluated with the Lighting Energy Numerical Indicator (LENI) according to the European Standards EN 15193-1:2017 [11] (in Italy: UNI EN 15193-1:2017, "Energy performance of buildings - Energy requirements for lighting - Part 1").
The LENI index represents the energy consumption of lighting equipment that is equal to the energy delivered to the building neglecting the losses of the distribution system inside the building. The primary energy index EPL can be obtained multiplying the delivered energy by the primary energy factors for electricity: fp,ren = 0.47 and fp,nren =1.95 [2]. Then, the energy performance for the artificial lighting service is:
$\mathrm{EP}_{\mathrm{L}, \mathrm{ren}}=\mathrm{LENI} \cdot \mathrm{f}_{\mathrm{p}, \mathrm{ren}}$ (2)
$\mathrm{EP}_{\mathrm{L}, \text { nren }}=\mathrm{LENI} \cdot \mathrm{f}_{\mathrm{p}, \text { nren }}$ (3)
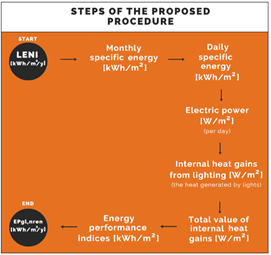
Figure 1. Suggested procedure
The procedure proposed in this article (Figure 1) is structured in the following steps:
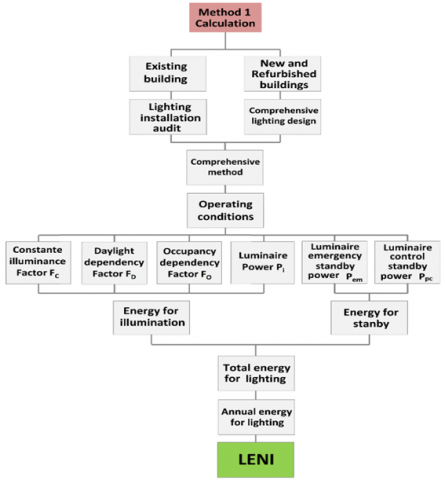
Figure 2. Flow diagram of Method 1: EN 15193-1:2017
The calculation on a monthly basis is of very important, because it helps to understand how the energy performance index for lighting affects the total energy consumption of a building. While the internal heat gains related to the occupants and electrical equipment do not undergo substantial variations over the months, the internal heat contribution due to lighting strongly depends on the availability of daylight in the different months of the year and therefore requires to be calculated through a more detailed procedure considering the monthly and seasonal variations of the integrated natural-artificial lighting system.
2.1 Heat emitted by lighting sources
Before using the literature values (point 5) a more in-depth study was performed to estimate the amount of thermal energy released into the environment by the entire light source– luminaire–control lighting system.
In laboratory tests, a spectroradiometer coupled with an integrating sphere has been used, providing both photometric and radiometric values on the test surface and in particular luminance Lv [cd/m2 or lm/(sr m2)] and radiance Le [W/(sr m2)]. From these measures it emerged that the ratio:
$\frac{L v}{L e}=\frac{d^{2} \Phi /(d A \cdot \cos \theta \cdot d \Omega)}{d^{2} P /(d A \cdot \cos \theta \cdot d \Omega)}=\frac{\text { luminous flux }}{\text { radiant power }}$ (4)
remains almost constant in relation to the lighting technology (e.g. 335 lm/W for LED sources and 310 lm/W for fluorescent sources). The type of spectrum is in fact characteristic of each technology with a specific correlated colour temperature (CCT).
Given Lv/Le value and remembering that the luminous flux is the radiant power weighted by the sensitivity of the human eye to light, it was possible to proceed as follows in energetic terms:
For LED sources, everything that is not light has been considered heat (the spectrum of LEDs is almost entirely in the visible). Then, considering the presence of the electrical transformer, the amount of heat emitted into the environment by the LED luminaires examined can be approximately estimated as the 60% of the supplied electrical power.
Fluorescent light sources emit some electromagnetic radiation also in the wavelengths of infrared (IR) and ultraviolet (UV) spectrum range. In this analysis, the UV quota has been neglected, for simplicity.
There is still the problem, at luminaire level, to split the NLE amount into light trapped within the luminaire (e.g. internal reflections) and heat released to the environment.
For this reason, it has been decided to utilize literature values [12], limited only to the light source, not the whole light source-luminaire-control lighting system.
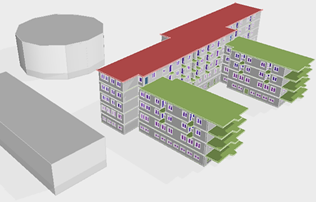
The case study is the “Brancaccio” retirement home in Matera (in South Italy at a latitude: 40.7° N). The structure, dating back to the 1970s, covers approximately 7500 m2 (on 5 levels) and can accommodate 250 guests including elderly people and health workers. The hospital rooms are distributed on the last three floors of the residence, with differences in relation to the degree of self-sufficiency and the needs of the patients. In the first two levels of the structure there are the common rooms of the “multifunctional center” and the offices of the “Fondazione Brancaccio”, the “Il Sicomoro” group and the non-profit association “Amici del cuore”. Figure 3 shows a three-dimensional (3D) view of the case study and of surrounding buildings (obstructions). The type of structure and the surrounding elements can influence heat dispersions and solar heat gains. About the building structure, in Table 1 the thermal transmittances assumed for the envelope are shown.
Table 1. Building envelope components characteristics
|
Envelope element |
Thermal Transmittance [W/m2/K] |
|
Vertical wall |
1.14 |
|
Lower slab (dispersing towards the ground) |
1.69 |
|
Slab between floors |
1.55 |
|
Flat roof Windows |
1.69 3.16 |
Figure 3. 3D view of Brancaccio and its surrounding spaces
Figure 4. Thermal zones of Brancaccio retirement home
As required by UNI/TS 11300-1, the building has been divided into "thermal zones" (in chapter 7) shown in Figure 4.
The technological systems were installed starting from 2016 following energy retrofit interventions of the entire structure. The thermal power plant that serves most of the building (zone 1) is located on the ground floor and includes a hybrid system with condensation boilers and heat pumps, used for space heating services and the production of domestic hot water. In six different rooms (zones 2 to 7), Variable Refrigerant Volume (VRV) systems were installed guaranteeing individual climate control of air conditioning for space heating, cooling and mechanical ventilation. Floor three (zone 8) is served by an independent thermal power plant, located on the terrace of the building, consisting of two gas boilers and a steam compression refrigeration machine.
The solar thermal collectors and the photovoltaic modules, installed on the roof of the retirement home, increase the global efficiency of the systems and reduce the greenhouse gas emissions. There is also a people/things transport service with two elevators.
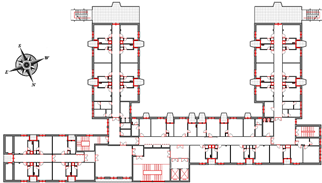
As it is possible to observe from Figure 5, almost all the rooms in the building can also benefit from daylight, thanks to the presence of numerous windows (double glass with light transmission value τ = 81%). The usable area and the total transparent area are respectively 6495 m2 and 1090 m2.
The lighting fixtures are installed on the ceiling and, for the first four floors, are equipped with LED sources. In the hospital rooms on the last level, there are wall-mounted lighting luminaries, equipped with fluorescent sources. The control systems are all manual ON/OFF with the exception of the corridors (environments without natural light) in which there are control systems based on occupancy, with manual ON/auto OFF type.
The lighting system is sized according to the regulatory minimum requirements, with power density values shown in Table 2. For further confirmation, the average illuminance value of the different environments was calculated with the lighting engineering software Dialux Evo 9.1, obtaining values of approximately 130 lux for the hospital rooms and 200 lux for the bathrooms.
Figure 5. First floor plan (similar to second floor)
Table 2. Installed power density of lighting systems
|
Zone |
Power Density [W/m2] |
Intended use of the zones (D.P.R 412/93) |
|
1 |
2.7 |
E.3. retirement home |
|
2 |
5.9 |
E.2. offices |
|
3 |
6 |
E.2. offices and similar |
|
4 |
4 |
E.6 (2) gym |
|
5 |
5.4 |
E.1 (3) hotels and guesthouses |
|
6 |
4.2 |
E.4. recreational activity |
|
7 |
5.9 |
E.2. offices |
|
8 |
7.6 |
E.3. retirement home |
4.1 Lighting energy numerical indicator
The assessment of the energy needs for the lighting of the "Brancaccio" retirement home was performed with the LENICALC v.3 software.
Table 3 shows the values of the LENI index for each floor ("Floor calculation") and the entire building ("Building calculation"). It is possible to observe that the value of the LENI related to the third floor is much higher than that of the other levels; this is due to a higher installed power per unit area and the use of fluorescent lighting sources.
Table 3. LENI index values
|
|
Installed power [W] |
Area [m2] |
LENI [kWh/m2/y] |
|
Ground floor |
4939.8 |
1478 |
13.83 |
|
Mezzanine floor |
5707.1 |
1470 |
11.54 |
|
First floor |
3667.5 |
1340 |
7.43 |
|
Second floor |
3667.5 |
1340 |
7.43 |
|
Third floor |
6540.2 |
866 |
30.68 |
|
Building |
24522.1 |
6494 |
12.92 |
Table 4. Monthly specific energy for artificial lighting
|
Building monthly specific energy [kWh/m2/month] |
|||||
|
Jan |
Feb |
Mar |
Apr |
May |
June |
|
1.10 |
1.08 |
1.07 |
1.06 |
1.05 |
1.05 |
|
July |
Aug |
Sept |
Oct |
Nov |
Dec |
|
1.06 |
1.06 |
1.07 |
1.09 |
1.11 |
1.13 |
Figure 6. Monthly specific energy per floor kWhL/m2/month
More interesting is the calculation of the monthly specific energy for the lighting service (Table 4, Figure 6). From the analysis of the results, the following consideration can be made:
The monthly specific energy values for the thermal zones of the case study have been calculated, as the sum of the monthly energy of the individual rooms, and used to calculate the internal lighting contributions according to the procedure proposed in paragraph 2.
4.2 Internal heat gains
As previously mentioned, the value of internal heat gains for the presence of people (W/m2) was calculated as a function of occupancy density (UNI/TS 11300-1, Table 16). To accurately assess this contribution, the actual hours of daily presence were assumed for each environment, based on the typical day of the "Brancaccio" retirement home. In this way, it was possible to consider the influence of various factors such as the time of external visits of relatives and friends, the maximum crowding allowed for each environment and the time spent in the different rooms in relation to the degree of self-sufficiency of the patients.
The internal contributions for the electric appliances are instead calculated, according to the intended use of the environments, through a constant average value (UNI/TS 11300-1, Table 17 [6]).
To these contributions, was then added the internal contributions for artificial lighting, calculated on the basis of the LENI index, according to the procedure in Figure 1. Table 5 shows the annual values of the internal heat gains for the different thermal zones of the case study considering the minimum and maximum lighting monthly contribution. On average, the lighting corresponds to about 19% but this percentage depends on the zone: highest value of 33% can be observed for zone 8 in wintertime and lowest value of 11% for zone 7 in summertime.
While the values of heat gains for the presence of people and electrical appliances are considered constant throughout the year (e.g. retirement home in operation 365 days); those for lighting vary from month to month, depending on the LENI and therefore on the availability of natural light. Consequently, the values shown in Table 5 are to be understood as average annual values, while the third column represents the monthly variation of lighting.
Table 5. Internal heat gains per thermal zone
|
Zone |
ɸint,occ+el |
ɸint,lighting (min–max)monthly |
|
|
[W/m2] |
[W/m2] |
|
1 |
4.84 |
0.78 – 0.88 |
|
2 |
4.63 |
1.22 – 1.37 |
|
3 |
5.70 |
2.15 – 2.42 |
|
4 |
3.32 |
1.18 – 1.33 |
|
5 |
4.24 |
0.67 – 0.78 |
|
6 |
3.43 |
0.79 – 0.92 |
|
7 |
6.35 |
0.80 – 0.94 |
|
8 |
6.25 |
2.65 – 3.02 |
|
Average* |
4.98 |
1.08 – 1.23 |
* value weighed on the m2 of each area
Table 6. Percentage variation of lighting contributions during the year
|
Thermal Zone |
|||||||
|
1 |
2 |
3 |
4 |
5 |
6 |
7 |
8 |
|
1.8 |
2.5 |
3.4 |
3.3 |
2.2 |
3.0 |
1.9 |
4.1 |
*[(ϕ(max) - ϕ(min)) / ϕ(medium].100
Table 6 shows, for each thermal zone, the percentage variation between the maximum monthly value and the minimum value of total internal contributions:
4.3 Energy performance results
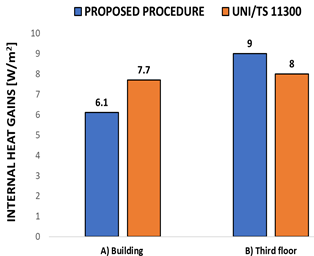
The calculation of the energy performance indexes for the "Brancaccio" retirement home was carried out by considering the two cases shown in Figure 7:
A) Entire building, with total internal heat gains equal to:
B) Third floor, with total internal heat gains equal to:
The low heat gains variation is certainly due to the low installed power of lighting systems.
Figure 7. Internal heat gains for occupancy, electrical appliances and lighting systems used
The legislation/standard overestimates the actual value of internal heat gains for case A, while it underestimates them for case B. These discrepancies are attributable to the share of contributions for artificial lighting: if for the entire building the average value of ϕint,ill is 1.12 W/m2, for the third floor (with fluorescent lighting sources) this value is 2.74 W/m2.
In general, it emerges the importance of carrying out a detailed analysis considering the installed power per unit of surface area, the typology of light source-luminaire-control system used and the availability of natural light, in order to evaluate the variation of the energy performance indicators in the different months of the year, concerning the different contribution provided by the variation of internal heat gains.
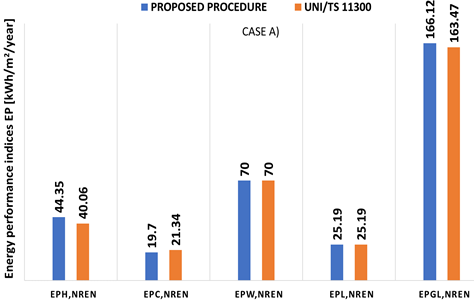
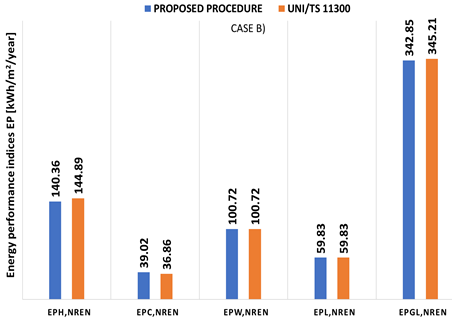
The calculation of the performance indexes, in terms of non-renewable primary energy, was therefore carried out on an annual basis and, for the proposed procedure, also on a monthly basis. The differences found between the two methodologies concern the non-renewable primary energy for space heating and cooling (EPH,nren ed EPC,nren), that depend also on the value of the internal heat gains. The value of the lighting energy performance index EPL,nren varies concerning the LENI index and is therefore very different in the two cases considered depending on lighting technology used.
Figures 8 and 9 show the annual values of the non-renewable primary energy requirement respectively for space heating and cooling, domestic hot water production and lighting services, as well as the value of the global energy performance index EPgl,nren (in this work, the primary energy for transport and ventilation was also evaluated, although not graphed).
Figure 8. EPn,ren indexes for retirement home, case A
Figure 9. EPn,ren indexes for retirement home, case B
The non-renewable energy performance index for lighting was calculated, in both cases, multiplying the LENI value by the non-renewable conversion factor of electricity (i.e. fp,nren = 1.95 in equation 3) to obtain the primary energy.
Using the normative approach leads to differences compared to the proposed procedure, both in terms of overall and single-service consumption.
The value of the EPgl,nren index varies in relation to the energy indicators for space heating and cooling (EPH,nren and EPC,nren), which in turn depend on the contribution of internal heat gains: higher internal heat gains means lower EPH,nren, higher EPC,nren and, overall, a slightly lower EPgl,nren. Conversely, lower internal heat gains means higher EPH,nren and lower EPC,nren.
In both cases, the EPgl,nren value varies little between the two procedures, because the increase or decrease of the EPH is balanced by the inverse change in EPC. However, the monthly variations of the performance indexes should not be neglected.
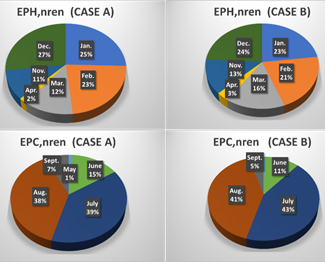
Figure 10. Monthly percentages (%) of space heating and cooling performance indexes
The graphs in Figure 10 represent the monthly percentage values of the performance indices EPH,nren and EPC,nren (kWh/m2) compared to the annual value.
The higher power installed on the third floor for artificial lighting, due to the use of fluorescent lighting sources, results in a greater contribution of heat gains in the rooms compared to case A. This translates into a decrease in energy consumed, in the heating season, and greater energy consumption for cooling during the summertime.
In case A), in the months of December and January (months with less natural light availability and higher internal lighting contributions) the percentages of EPH,nren are proportionally higher than in case B); while in the months of July and August, the EPC,nren values for case A) are proportionally lower than those calculated for the second case.
The proposed procedure, unlike the normative approach, has therefore the merit of evaluating the influence of internal heat gains on the monthly variations of the energy performance indexes during the heating and cooling seasons.
A further validation of the proposed procedure for the evaluation of internal heat gains comes from the comparison between the actual consumption of the energy bills (Ce) and the operational consumption of the calculation model (Co). In this work, with evaluation using the normative approach, the deviation between operational and actual consumptions is greater than 5%, while evaluating the internal heat gains with the proposed procedure, the deviation decreases to 2%, which means a better calibration of the model. As already discussed, this very small difference is due mainly to the low installed power of the lighting system.
4.4 Further analysis
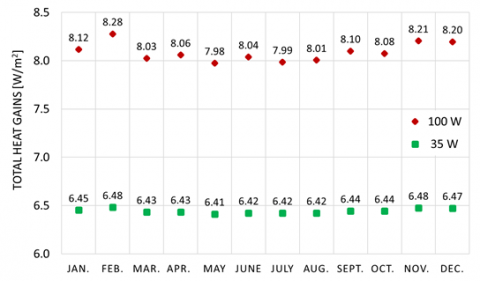
It should be noted that the results obtained are specific to this case study; indeed, the low power installed for the artificial lighting influences the final value of the internal heat gains. For this reason, it was decided to carry out a further analysis on a single hospital room, located on the first floor (Figure 5) and with an average illuminance of about 340 lux, obtained with Dialux Evo simulations considering an installed power of about 100 W (with LED luminaires).
Figure 11 shows the comparison between the monthly values of the total internal contributions calculated for a hospital room with an installed power of 100 W and 35 W respectively.
More installed power means also more internal heat gains for lighting. In both cases, the sum of the internal heat gains due to occupancy and electric appliances is about 6 W/m2 and so the different contribution from lighting has a significant effect on the total value of internal heat gains and on its monthly variation.
Figure 11. Monthly variation of the internal heat gains
At this stage it was analyzed the influence of several factors on the value of the LENI index (and therefore on the final value of the internal heat gains) for the hospital room with a higher power density than that of the case study.
In particular, the use of lighting control systems with various obstruction angles of shading devices were evaluated.
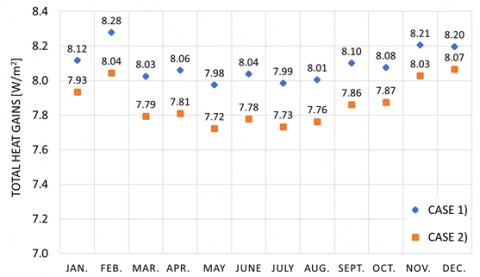
The control systems used for the "Brancaccio" rooms are manual with ON/OFF switch. Assuming the use of control logics based on occupancy and natural light, with the installation of infrared sensors and photodetectors, the annual energy for lighting (LENIsub) of a single patient room was calculated. The results, performed with LENICALC software, are shown in Table 7.
Table 7. LENIsub calculation
|
|
Occupancy |
Natural light |
LENIsub [kWh/m2/ y] |
|
Case 1 |
MANUAL |
MANUAL |
23.42 |
|
Case 2 |
MANUAL ON-AUTO OFF |
VIII * |
20.87 |
*Systems which are daylight-responsive and dim and switch off the electric lighting (“dimmed, no stand-by losses, no switch-on”)
The use of a simple lighting control systems allows an energy saving, in terms of annual energy demand for lighting, of 11%. As a consequence, there will be a reduction of the internal heat gains (Figure 12) because less energy will be consumed in the case of light flux regulation (dimming). A more effective control system would have led to better performance.
Finally, assuming to vary the value of the frontal obstruction angle θ, the influence of shading devices on the value of the LENI index was evaluated. From the results obtained, it was noted that for frontal obstruction angles due to external elements there is a variation in the LENI index with an obstruction angle between 15 and 65°. This result is due to the method provided by the UNI EN 15193-1 Standard, according to which the incidence of obstructions on the energy consumption for artificial lighting is approximated, even though both components of light, direct and diffuse, have been considered.
The results obtained in this analysis highlight, once again, the multiplicity of factors on which the value of internal heat gains depends and the need to perform a detailed assessment to establish the energy consumption of buildings.
Figure 12. Monthly variation of internal heat gains
The main result of this study is the definition of a new procedure, based on the Lighting Energy Numeric Indicator (LENI), that takes into account the integration between natural light and artificial lighting system in the calculation of heat gains due to artificial lighting systems. The amount of the heat gains due to the artificial lighting system with the heat gains of the occupants and electrical appliances, are used to calculate the energy performance indicators of a building.
The proposed procedure has the merit of considering factors such as the installed power density, the type of lighting source/luminaire/control system, the behaviour of users, as well as the availability of natural light of the case study.
In particular, the energy performance indexes for the retirement home "Brancaccio" of Matera were compared calculating the contributions of internal heath gains, both with the standard procedure provided for by technical regulations (UNI/TS 11300) and with the proposed procedure.
In summary, the following considerations can be deduced:
The several factors on which energy consumption for artificial lighting depends, combined with their influence on the monthly variations in energy performance indexes, allows to understand how the standard use of a constant average annual value for the estimation of internal heat gains cannot best represent the energy and dynamic behavior of a building.
The authors hope that a more precise procedure (although longer and more articulated) for the calculation of internal heat gains in buildings, can soon be implemented in the procedures prescribed by the technical regulations especially for nearly zero energy buildings and boosting the available renewable energy sources (which often have a behavior strongly influenced by climatic conditions) [15].
This work is part of larger projects initiated by ENEA, in particular:
|
A |
Area, m2 |
|
c |
constant illuminance |
|
C |
Cooling |
|
D |
Daylight |
|
CCT |
Correlated Colour Temperature, K |
|
ENEA |
Agency for New technologies, Energy and Environment - Ente per le Nuove tecnologie, l'Energia e l'Ambiente (in Italian) |
|
EP |
Energy Performance index, kWh/m2/year |
|
fp |
factor for non-renewable primary energy |
|
F |
Factor |
|
gl |
global |
|
H |
Heating |
|
int |
internal |
|
IR |
Infrared |
|
L |
artificial Lighting |
|
Lv |
luminance, cd m-2 |
|
Le |
radiance, W sr -1m-2 |
|
LED |
Light Emitting Diode |
|
LENI |
Lighting Energy Numerical Indicator |
|
NLE |
Not Lighting Energy |
|
nren |
non-renewable |
|
O |
Occupancy |
|
P |
radiant Power, W |
|
T |
Transport of people or things |
|
UV |
Ultraviolet |
|
V |
Ventilation |
|
VRV |
Variable Refrigerant Volume systems |
|
W |
hot Water production |
|
Greek symbols |
|
|
$\phi$ |
internal heat gains, Wm-2 |
|
$\Phi$ |
luminous flux, lm |
|
$\Omega$ |
solid angle, sr |
|
$\theta$ |
(plane) angle, ° |
[1] Caldera, M., Ungaro, P., Cammarata, G., Puglisi, G. (2018). Survey-based analysis of the electrical energy demand in Italian households. Mathematical Modelling of Engineering Problems, 5(3): 217-224. https://doi.org/10.18280/mmep.050313
[2] Belussi, L., Danza, L., Meroni, I., Salamone, F., Minutoli, S., Romeo, C. (2018). Simplified tool for the energy performance assessment of residential buildings. Modelling, Measurement and Control B, 87(3): 122-128. https://doi.org/10.18280/mmc_b.870302
[3] Magrini, A., Lazzari, S., Marenco, L., Guazzi, G. (2018). Cost optimal analysis of energy refurbishment actions depending on the local climate and its variations. Mathematical Modelling of Engineering Problems, 5(3): 268-274. https://doi.org/10.18280/mmep.050321
[4] Mutani, G., Todeschi, V. (2021). GIS-based urban energy modelling and energy efficiency scenarios using the energy performance certificate database. Energy Efficiency, 14: 47. https://doi.org/10.1007/s12053-021-09962-z
[5] Mutani, G., Beltramino, S., Schiavone, M. (2020). Place-based atlas for energy communities using energy performance certificates database. 2020 IEEE 3rd International Conference and Workshop in Óbuda on Electrical and Power Engineering (CANDO-EPE), pp. 179-184. https://doi.org/10.1109/CANDO-EPE51100.2020.9337766
[6] Italian Standard UNI/TS 11300: Part 1, Energy performance of buildings. Part 1: Evaluation of energy need for space heating and cooling (according to ISO 13790:2007), 2014, Italian Regulatory Body UNI.
[7] Mouffok, M., Aidaoui, L., Zemmouri, N. (2019). Evaluation study of energy performance and conformity to regulations for ordinary and HEP housings: Case study based on measurements at Djelfa City, Algeria. Instrumentation Mesure Metrologie, 18(2): 171-180. https://doi.org/10.18280/i2m.180212
[8] Mukherjee, S. (2017). Simulation of daylight and artificial lighting integration and energy savings. Environmental and Earth Sciences Research Journal, 4(1): 17-22. https://doi.org/10.18280/eesrj.040104
[9] Lo Verso, V.R.M., Mutani, G., Blaso, L. (2014). Methodology to link the internal heat gains from lighting to the global consumption for the energy certification of buildings in Italy. Journal of Daylighting, 1(1): 56-67. https://doi.org/10.15627/jd.2014.6
[10] Danza, L., Belussi, L., Floreani, F., Meroni, I. (2018). Application of model predictive control for the optimization of thermo-hygrometric comfort and energy consumption of buildings. Instrumentation, Mesure, Métrologie, 17(3): 375-391. https://doi.org/10.3166/I2M.17.375-391
[11] EN 15193-1:2017. Energy performance of buildings - Energy requirements for lighting - Part 1: Specifications, Module M9, European Standard.
[12] Guidelines for computerized calculation for the determination of LENI according to the complete calculation method of UNI EN 15193-1:2017.
[13] PELL buildings section to free download LENICAL. https://www.pell.enea.it/enea/, accessed on July 8th, 2021.
[14] Palazzoli Academy. Fondamenti di illuminotecnica. Vantaggi dell’illuminazione a LED, pp. 53.54.
[15] Batov, Eugeny I., (2015). The distinctive features of "smart" buildings. Procedia Engineering, 111: 103-107. https://doi.org/10.1016/j.proeng.2015.07.061
[16] Ding, L., Chen, C. (2021). Thermal environment optimization and energy saving of residential buildings under the demand of low-carbon operation. International Journal of Heat and Technology, 39(2): 659-668. https://doi.org/10.18280/ijht.390238
[17] Genco, A., Viggiano, A., Rospi, G., Cardinale, N., Magi, V. (2015). Dynamic modeling and simulation of buildings energy performance based on different climatic conditions. International Journal of Heat and Technology, 33(4): 107-116. http://dx.doi.org/10.18280/ijht.330414
[18] Guazzi, G., Bellazzi, A., Meroni, I., Magrini, A. (2017). Refurbishment design through cost-optimal methodology: The case study of a social housing in the northern Italy. International Journal of Heat and Technology, 35(1): S336-S344. https://doi.org/10.18280/ijht.35Sp0146
[19] COGITO – A COGnItive dynamic sysTem to allOw buildings to learn and adapt. https://ict.enea.it/cogito/, accessed on July 8th, 2021.