Catur Harsito* | Ariyo Nurachman Setiya Permata
© 2021 IIETA. This article is published by IIETA and is licensed under the CC BY 4.0 license (http://creativecommons.org/licenses/by/4.0/).
OPEN ACCESS
The HVAC (heating, ventilation, and air conditioning) systems utilization has increased in the last decade. It conducts global warming which has an impact on the rising of global temperatures. An excellent air conditioning system will make the room comfortable conditions. This paper aims to investigate the mosque space with a cooling model of wall-mounted air conditioning and the difference in inlet angle and air inlet velocity. The room design was constructed using SolidWorks software. Air distribution observations were created using ANSYS Workbench simulation software. The use of a supply angle of 90° results in an even distribution of air with a low inlet velocity, whereas in conditions of a supply angle of 60° requires a higher inlet speed. Thus, the uniform air distribution is able to be realized by the proper configuration which results an appropriately room temperature and saves energy usage.
HVAC, CFD simulation, air distribution, inlet velocity, inlet angles
HVAC (heat, ventilation, and air conditioning) systems are increasingly being used at the end of this decade. This occurs because the development of developing regions has resulted in an increase in energy consumption by 40% of the total world energy consumption [1]. Global warming also has a role in increasing global temperature increase. Energy sources that are dwindling as well as strict energy policies and encouragement about its sustainability, there is a lot of research to deal with it. A lot of research is being done to produce renewable energy [2-6].
The air conditioning system is an effective way to get a room with comfortable conditions. As a step to balance indoor air quality and energy consumption, various ventilation systems, air conditioning, and air distribution have been widely researched and used such as ventilation shifting, mixing ventilation, hybrid air distribution and personal ventilation [7, 8]. A good air conditioning system is needed to save energy in addition to getting a comfortable room with good air distribution and a comfortable air temperature and appropriate flow rate in a room. This is what has led many researchers to investigate the performance of HVAC [1, 9-14].
The study of air conditioning systems can be carried out by numerical methods as predictions and comparisons with real or experimental conditions as well as visualizing air flow and temperature [10, 15]. Ning et al. conducted a CFD investigation in the bedroom by considering the height of the inlet to the sleeping position. The results show that the lowest inlet position results in an overall airflow distribution [16]. Indoor air quality is influenced by how much air flows in and how the air distribution occurs. Zhou and Kim conducted a study on the effect of air velocity on the suction in the kitchen [17]. Likewise, Liu et al. did a study of air velocity in the suction area in the house. The effect of air supply is also investigated [18]. This shows the effect of reducing the temperature throughout the room. Meanwhile, Noh et al. conducted a study on the effect of flow rate on the ceiling and ventilation, which also showed the effect on temperature, air quality and room comfort [19].
This article describes the results of investigating an air conditioning system using a computational fluid dynamic (CFD) on the air distribution of wall-mounted air conditioning with variations in inlet velocity and air intake angle. Evaluation of the effectiveness of the system can be seen from the distribution of indoor air and a comfortable temperature according to the standard. This air distribution affects the amount of warm or cold air supply to get the same indoor comfort and affects the cooling performance.
2.1 Design and model description
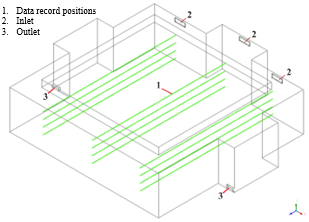
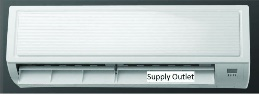
The design used in this case is a mosque room with a 3D shape as shown in Figure 1a. In this case, the room uses wall-mounted AC (Figure 1b). The dimensions of the room in the study are 15x16x4m with two doors on the right and left. The simulation in this case is carried out in the summer where cold air is blown into the room through three wall-mounted AC.
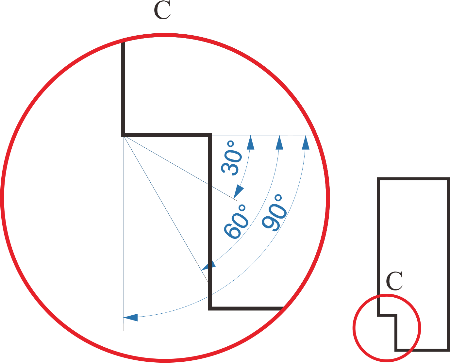
The position of the air conditioner in this room is 50 cm from the roof in front of the room. The air outlet is located at the bottom of the door. The ambient temperature is set to 31℃, the room is assumed to be full of people so the air in the room is set to on 31℃ with an increase in temperature due to the presence of people of 5 Watt. The walls, ceiling and floor are assumed to be adiabatic no-slip. In this article, the AC inlet angle is varied 30°, 60° and 90°. Angle measurements are carried out as shown in Figure 1c.
(a)
(b)
(c)
Figure 1. (a) Design of masque room with three wall-mounted inlet air; (b) wall-mounted air-conditioner; (c) angle of inlet air-conditioner
2.2 Simulation methods
The configuration in this simulation uses variations in inlet speed 1 m/s, 5 m/s and 10 m/s and at each speed the inlet angle was varied 30°, 60° and 90°. This variation was chosen for the simulation because of the average speed used in the wall-mounted air-conditioner, while the inlet angle variation was also selected based on the use of a wall-mounted air-conditioner. The configuration of this simulation is shown in Table 1. The inlet temperature is set uniformly at 17℃, this temperature is adjusted accordingly cooling load capacity.
Table 1. Configuration for simulation
|
Case |
Inlet Temperature (°C) |
Inlet velocity (m/s) |
Inlet Angle (°) |
|
1 |
17 |
1 |
30 |
|
2 |
17 |
1 |
60 |
|
3 |
17 |
1 |
90 |
|
4 |
17 |
5 |
30 |
|
5 |
17 |
5 |
60 |
|
6 |
17 |
5 |
90 |
|
7 |
17 |
10 |
30 |
|
8 |
17 |
10 |
60 |
|
9 |
17 |
10 |
90 |
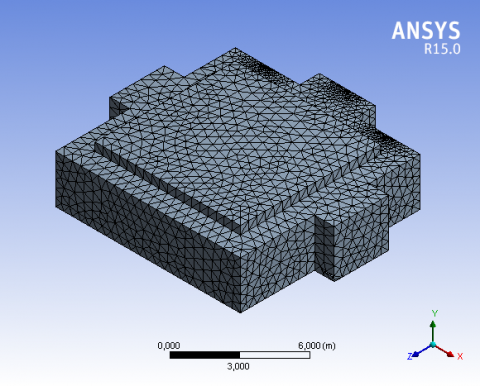
The design of the room was drawn using Solidworks software, and simulations were carried out using ANSYS software. The convergent criteria applied to this simulation are 10-3 for energy conversion residuals. In this simulation, the design space is transferred to ANSYS Meshing as shown in Figure 2. The inlet and outlet sections are made with a fine grid to increase the accuracy of calculations.
Figure 2. Meshed model
In this section, the results of simulations that have been carried out in 9 cases will be presented as shown in this section Table 1. The results of this simulation will be used as a reference for placing the air conditioner in the mosque room. Previously, calculations were made to determine the inlet temperature by considering comfortable room conditions based on cooling capacity. The simulation begins with setting the inlet temperature, then modeling with variations in inlet velocity, then modeling with variations in inlet angle.
The results of the simulation are displayed in 3D and 2D visualization. Visualization of the resulting airflow distribution and its temperature distribution in 2D at several points.
3.1 Temperature distribution
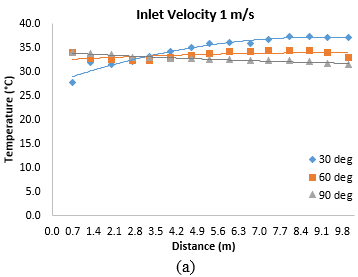
Figure 3 shows the results of the temperature distribution at all variations in the inlet velocity and also the inlet angle of the 3-AC wall-mounted. The temperature distribution was calculated over the three planes and then averaged over each distance from the front of the AC inlet. Figure 3a indicates that at the inlet speed 1 m/s, the resulting room temperature ranges from 27-37℃ on all variations. At the corner of the inlet 30° the farther from the inlet the air conditioner the resulting temperature increases. The result differs at an angle 60° where the room temperature has a relatively more diverse temperature, but the resulting temperature is still high, namely 32℃. While at the inlet angle 90° the room temperature decreased significantly at the back of the room.
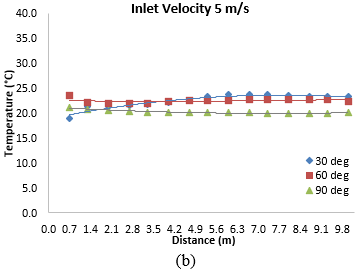
Based on Figure 3b is the simulation result of an inlet velocity of 5 m/s. In the graph, it can be seen that the entire room has a relatively more uniform temperature, but the pattern of rising and falling is similar to the case when the inlet velocity is 1 m/s. The resulting room temperature ranges from 19-27℃ at an inlet angle of 30°. At a 60° angle the room temperature ranges from 21-23℃, while at a 90° angle the room temperature is relatively more uniform at 20℃.
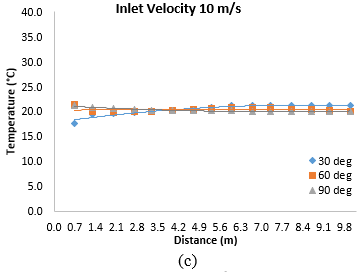
Figure 3. Temperature distribution with inlet velocity; (a) 1 m/s, (b) 5 m/s, (c) 10 m/s, (d) 10 m/s
At an inlet speed of 10 m/s the resulting room temperature is lower than the others. Figure 3c shows that the average room temperature at the variation of the inlet angle of 30°, 60° and 90° tends to be the same, namely between 17-21℃. The simulation results show that the inlet angle of 90° has a good temperature uniformity of 20℃. Where the expected room temperature is in the range of 17-21℃ in accordance with the standards of comfort in the room [20]. This uniformity of room temperature is produced because the flowing air flows evenly moves throughout the room.
Table 2. ANOVA temperature “Inlet angle effect”
|
|
Sum of Squares |
df |
Mean Square |
F |
Sig. |
|
Between Groups |
19.286 |
2 |
9.643 |
3.944 |
.048 |
|
Within Groups |
29.343 |
12 |
2.445 |
|
|
|
Total |
48.629 |
14 |
|
|
|
Based on the results of the one-way ANOVA test as shown in Table 2, with a significance value of 0.048, it can be concluded that the inlet angle has an effect on the room temperature value because the significance value is less than 0.05.
3.2 Airflow pattern
Figure 4 shows the air flow pattern at an inlet angle of 30° for the three zones in front of the water inlet. At an angle of 30° the flow pattern indicates that the flow velocity in front of the inlet is higher than at the back.
(a)
(b)
(c)
(d)
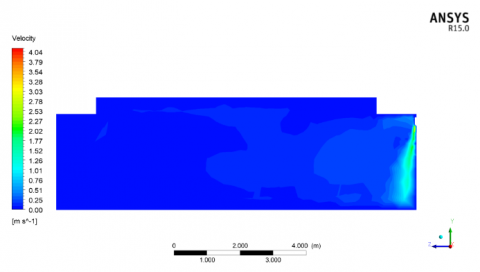
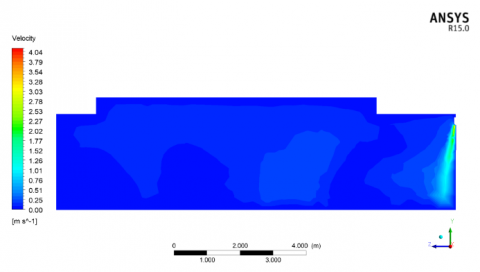
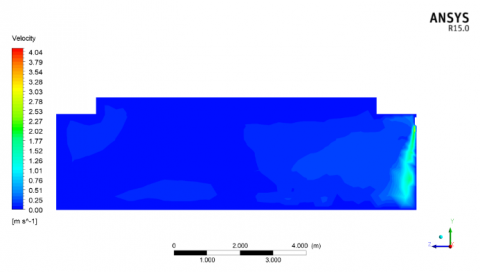
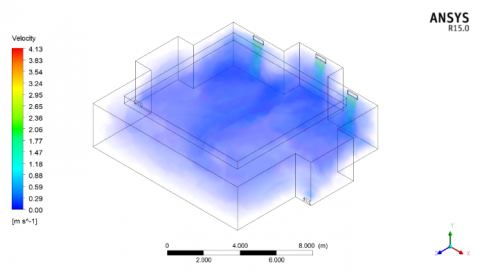
Figure 4. Airflow pattern at 5 m/s with 30° inlet supply; (a) line 1; (b) line 2; (c) line 3; (d) 3D view
The cold air that is exhaled through the inlet at an angle of 30° cannot properly spread throughout the room because of the turbulent flow on the front. The farther from the inlet, the lower the air velocity, so this makes the room temperature not uniform. This air flow turns and forms turbulence after hitting the floor and only rotates in the front area which then exits through the outlet channel.
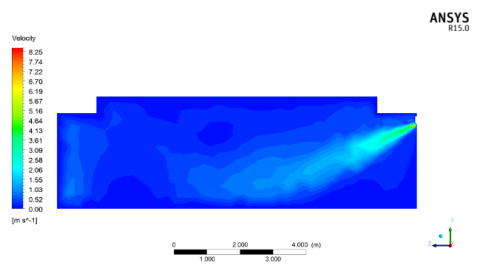
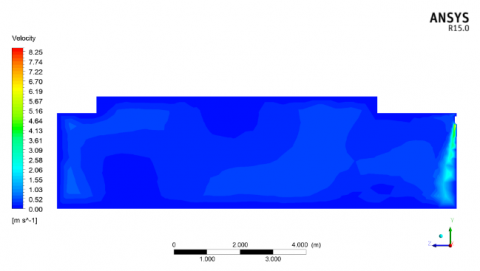
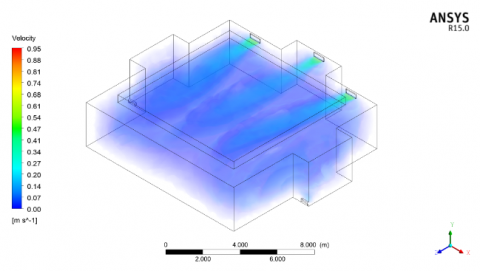
The simulated airflow pattern at an angle of 60° can be seen in Figure 5. As described in Figure 3, that the distribution and reduction of indoor temperature with an inlet angle of 60° shows better uniformity. This happens because at the inlet angle of 60°, the air flow can spread throughout the room.
Cold air that is distributed is not only fixed on the front area but at an angle of 60°, the air flow changes direction backwards in the center area of the room. So that the air that bounces on the floor then changes direction backward and distributes cold air up and turns forward and then comes out through the outlet area.
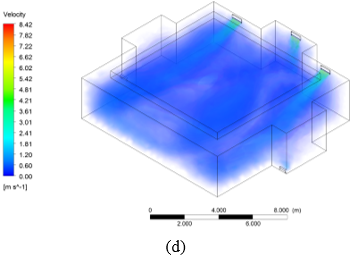
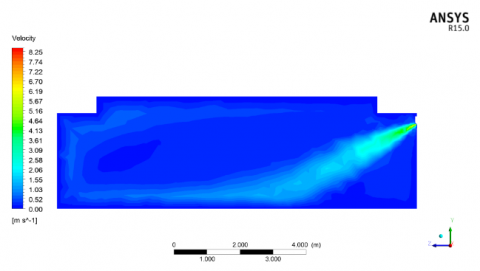
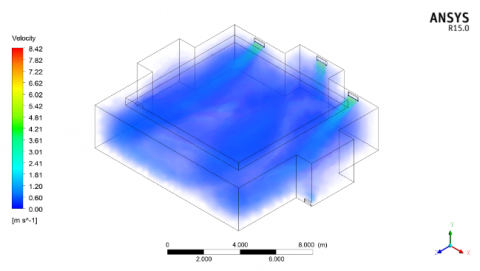
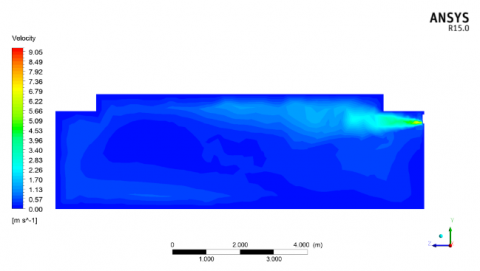
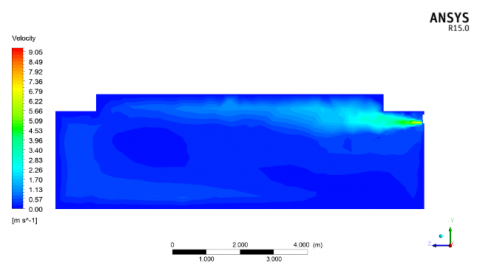
The airflow pattern at an inlet angle of 90° with an inlet velocity of 10 m/s is shown in Figure 6. The resulting flow shows that cold air can be diffused throughout the room. The flow from the inlet to the back wall at full speed then hits the wall and then flows down and rotates forward again which then exits through the outlet area.
(a)
(b)
(c)
(d)
Figure 5. Airflow pattern 10 m/s with 60° inlet supply; (a) line 1; (b) line 2; (c) line 3; (d) 3D view
(a)
(b)
(c)
(d)
Figure 6. Airflow pattern at 10 m/s with 90° inlet supply; (a) line 1; (b) line 2; (c) line 3; (d) 3D view
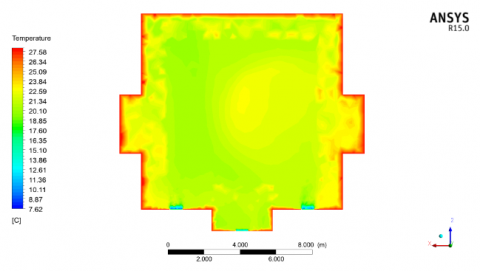
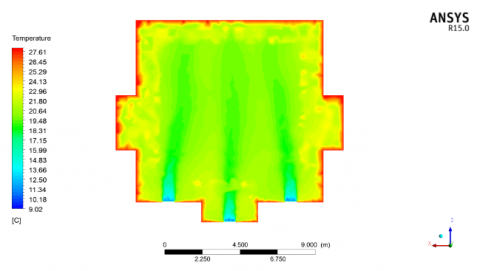
3.3 Temperature distribution pattern
(a)
(b)
(c)
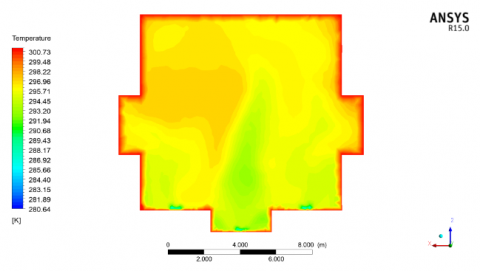
Figure 7. Temperature distribution pattern at inlet velocity 10 m/s with; (a) 30°; (b) 60°; (c) 90° inlet angle
Based on the resulting flow patterns at each variation in the inlet angle, we can see that at an angle of 60° and 90°, the resulting flow can spread throughout the room at almost the same speed. The flow of cold air that enters produces room air to decrease. The resulting room temperature at a speed of 10 m/s with various variations in the inlet angle can be seen in Figure 7. Based on Figure 7, the temperature in the Y plane as far as 1.5 m from the floor which is an area that corresponds to the average height of humans in Indonesia. At the inlet angle of 30° the room shows a high temperature visualized with the dominant orange-yellow color. At an inlet angle of 60° the temperature is lower than the inlet angle of 30° which is indicated by yellow-green color and is less evenly distributed, while at an angle of 90° the room temperature is more uniform, indicated by a more even color of green and of course with a more comfortable temperature at 20℃.
At an angle of 30°, the room temperature is uneven because when the angle is 30°, the air flow occurs only in the front area of the air conditioner and forms turbulence. Meanwhile, at an angle of 90°, the air distribution will be more even because the airflow sweeps across the room and turbulence occurs when the airflow hits the back wall. This causes the temperature distribution to be more even. In addition, the temperature distribution is influenced by the very high air flow velocity of 10 m/s. The speed of this air flow allows the flow to blow to the back of the room.
This paper reports the results of a numerical investigation using Ansys Fluent Software on the distribution of indoor air in a mosque with differences in inlet angle and inlet velocity. Calculations and simulation results have been described in the previous section. Based on the simulation results, it can be concluded that the inlet velocity and inlet angle of the air conditioner affect the air distribution which causes the indoor temperature to decrease. At an inlet speed of 10 m/s and an angle of 90° is the most optimum configuration with the results of the temperature distribution which has the smallest difference, namely 17-21℃. Indoor conditions with an average temperature of 17-21℃ are comfortable conditions in the room. So that this configuration is the best configuration.
Authors are grateful to the Universitas Sebelas Maret for providing research facilities and Universitas Pertahanan Indonesia for collaborating research.
[1] Bamodu, O., Xia, L., Tang, L. (2017). A numerical simulation of air distribution in an office room ventilated by 4-way cassette air-conditioner. Energy Procedia, 105: 2506-2511. https://doi.org/10.1016/j.egypro.2017.03.722
[2] Arifin, Z., Soeparman, S., Widhiyanuriyawan, D., Sutanto, B., Suyitno. (2017). Performance enhancement of dye-sensitized solar cells (DSSCs) using a natural sensitizer. In AIP Conference Proceedings, 1788(1): 030123. https://doi.org/10.1155/2017/2704864
[3] Harsito, C., Tjahjana, D.D.D.P., Kristiawan, B. (2020). Savonius turbine performance with slotted blades. In AIP Conference Proceedings, 2217(1): 030071. https://doi.org/10.1063/5.0000797
[4] Prasetyo, S.D., Harsito, C., Sutanto, Suyitno. (2019). Energy consumption of spray dryer machine for producing red natural powder dye and its stability. In AIP Conference Proceedings, 2097(1): 030076. https://doi.org/10.1063/1.5098251
[5] Ridwan, Prasetyo, S.D., Kusuma, A.C., Rahman, R.A., Suyitno. (2019). Recent progress of biogas produced from the waste of natural indigo dyes for electricity generation. In AIP Conference Proceedings, 2097(1): 030025. https://doi.org/10.1063/1.5098200
[6] Arifin, Z., Tjahjana, D.D.D.P., Suyitno, S., Juwana, W.E., Rachmanto, R.A., Apribowo, C.H.B., Harsito, C. (2021). Performance of crossflow wind turbines in in-line configuration and opposite rotation direction. Journal of Advanced Research in Fluid Mechanics and Thermal Sciences, 81(1): 131-139. https://doi.org/10.37934/arfmts.81.1.131139
[7] Cao, G., Awbi, H., Yao, R., Fan, Y., Sirén, K., Kosonen, R., Zhang, J.J. (2014). A review of the performance of different ventilation and airflow distribution systems in buildings. Building and Environment, 73: 171-186. https://doi.org/10.1016/j.buildenv.2013.12.009
[8] SeppȨnen, O. (2008). Ventilation strategies for good indoor air quality and energy efficiency. International Journal of Ventilation, 6(4): 297-306. https://doi.org/10.1080/14733315.2008.11683785
[9] Sabtalistia, Y. A., Ekasiwi, S. N. N., Iskandriawan, B. (2014). Effect of air conditioning position on thermal comfort in the floor air conditioning system. In Applied Mechanics and Materials, 493: 74-79. https://doi.org/10.4028/www.scientific.net/AMM.493.74
[10] Gan, G. (1995). Evaluation of room air distribution systems using computational fluid dynamics. Energy and Buildings, 23(2): 83-93. https://doi.org/10.1016/0378-7788(95)00931-0
[11] Abedalh, A.S., Yasin, N.J., Ameen, H.A. (2021). Thermal performance of HAVC system using heat pipe heat exchanger. Journal of Mechanical Engineering Research and Developments, 44: 336-344.
[12] Mareed, M., Habeeb, L.J. (2021). Numerical simulation of air distribution in the lecture room equipped with direct expansion air conditioner. Journal of Mechanical Engineering Research and Developments, 44(3): 198-207.
[13] Talib, D.H., Hameed, R.H., Alwan, A.A. (2021). Heat transfer analysis of air flow through irregular geometric ducts. Journal of Mechanical Engineering Research and Developments, 44: 298-313.
[14] Harsito, C., Permana, A.N.S., Sihta, F. (2021). Energy efficiency calculation and air handling unit design based on cooling load capacity at MASTEK Mosque. In IOP Conference Series: Earth and Environmental Science, 746(1): 012032. https://doi.org/10.1088/1755-1315/746/1/012032
[15] Chen, Q., Zhai, Z. (2004). The use of CFD tools for indoor environmental design. Advanced Building Simulation, 119-140.
[16] Ning, M., Mengjie, S., Mingyin, C., Dongmei, P., Shiming, D. (2016). Computational fluid dynamics (CFD) modelling of air flow field, mean age of air and CO2 distributions inside a bedroom with different heights of conditioned air supply outlet. Applied Energy, 164: 906-915. https://doi.org/10.1016/j.apenergy.2015.10.096
[17] Zhou, J., Kim, C.N. (2011). Numerical investigation of indoor CO2 concentration distribution in an apartment. Indoor and Built Environment, 20(1): 91-100. https://doi.org/10.1177/1420326X10390670
[18] Liu, D., Zhao, F.Y., Wang, H.Q., Rank, E. (2012). Turbulent transport of airborne pollutants in a residential room with a novel air conditioning unit. International Journal of Refrigeration, 35: 1455-1472. https://doi.org/10.1016/j.ijrefrig.2012.04.011
[19] Noh, K.C., Han, C.W., Oh, M.D. (2008). Effect of the airflow rate of a ceiling type air-conditioner on ventilation effectiveness in a lecture room. International Journal of Refrigeration, 31(2): 180-188. https://doi.org/10.1016/j.ijrefrig.2007.07.005
[20] ASHRAE Standard. (2004). Standard 55-2004. Thermal Environmental Conditions for Human Occupancy. ttps://www.ashrae.org/technical-resources/bookstore/standard-55-thermal-environmental-conditions-for-human-occupancy.