Rabi Rabi* | Lhoucine Oufni | El-Hocine Youssoufi | Khamiss Cheikh | Hamza Badry | Youssef Errami
© 2021 IIETA. This article is published by IIETA and is licensed under the CC BY 4.0 license (http://creativecommons.org/licenses/by/4.0/).
OPEN ACCESS
Radon natural is the main cause of lung cancer in non-smokers. Therefore, the study of the behavior of radon and its descendants in indoor air is of the highest importance, in order to limit the risk of radiation dose due to inhalation of radon by members of the public. This article focuses to study the effects of meteorological parameters on the concentration and distribution of radon in a traditional hammam by both numerical simulations and experiments. The results of the numerical simulations are qualitative and show that the concentration and distribution of radon decrease when the ventilation rate increase, as well as, when the temperature increases, however, it increases with the increase in relative humidity. The results obtained by the numerical simulations were in agreement with those obtained experimentally with a maximum deviation of 7%. Numerical simulations allow a better estimate of the distribution of radon in indoor air.
radon, traditional hammam, computational fluid dynamics (CFD), measurement method, analytical method
Throughout the main text, Radon is emitted by radium in soil, groundwater, and building materials. It can enter the indoor air where it accumulates. It is well known that inhaling radon and its decay products contributes an important part (over 50%) of the natural radiation dose to humans (UNSCEAR, 2000) [1, 2]. Therefore, estimating the behavior of radon and its descendants in indoor air is very important to evaluate the radiation dose received from inhaling radon and its descendants by members of the public.
More recently, CFD (Computational Fluid Dynamics) simulation has taken on a distinct place in the study of the behavior of radon in indoor air. Many researchers have predicted the behavior and distribution of radon in buildings, apartments, offices, and schools, using CFD simulations [3-11]. Despite the importance of these studies, the evaluation of the influence of meteorological parameters on the behavior of radon in indoor air has not been fully investigated using CFDs.
In this article, we analyze the influence of meteorological parameters on the behavior of radon inside a traditional hammam Moroccan. The study will focus essentially on the effects of ventilation, temperature, and relative humidity on the concentration and distribution of radon inside a traditional hammam. A comparison will be made to validate the CFD model by the analytical solution and the measurement results. Finally, we determine the annual dose after inhalation of radon inside the traditional hammam by members of the public.
A traditional hammam Moroccan is a place of relaxation and care, generally consists of three rooms whose temperature varies, so that we find a cold-room when entering, another warm-room in the middle, then the hot-room (Figure 1), these rooms summarize the three main steps of the bath process.
Figure 1. Geometry of the hammam traditional
In this study we applied the Navier-Stokes equations in the laminar regime, written as follows:
The conservation of mass equation:
$\frac{\partial\left(\rho U_{i}\right)}{\partial X_{i}}=0$ (1)
The momentum equation:
$\frac{\partial\left(\rho \mathrm{U}_{\mathrm{i}}\right)}{\partial \mathrm{t}}+\frac{\partial\left(\rho \mathrm{U}_{\mathrm{i}} \mathrm{U}_{\mathrm{j}}\right)}{\partial \mathrm{X}_{\mathrm{i}}}$
$=-\frac{\partial \mathrm{P}}{\partial \mathrm{X}_{\mathrm{i}}}+\frac{\partial}{\partial \mathrm{X}_{\mathrm{i}}}\left[\mu\left(\frac{\partial \mathrm{U}_{\mathrm{i}}}{\partial \mathrm{X}_{\mathrm{i}}}+\frac{\partial \mathrm{U}_{\mathrm{j}}}{\partial \mathrm{X}_{\mathrm{i}}}\right)\right]+\rho \mathrm{g}$ (2)
The energy conservation equation:
$\frac{\partial \mathrm{T}}{\partial \mathrm{t}}+\frac{\partial\left(\mathrm{U}_{\mathrm{i}} \mathrm{T}\right)}{\partial \mathrm{X}_{\mathrm{i}}}=\alpha \frac{\partial^{2} \mathrm{~T}}{\partial \mathrm{X}_{\mathrm{i}}{ }^{2}}$ (3)
The radon dispersion equation:
$\frac{\partial \mathrm{C}}{\partial \mathrm{t}}+\frac{\partial\left(\mathrm{U}_{\mathrm{i}} \mathrm{C}\right)}{\partial \mathrm{X}_{\mathrm{i}}}=\mathrm{D} \frac{\partial^{2} \mathrm{C}}{\partial \mathrm{X}_{\mathrm{i}}^{2}}-\lambda \mathrm{C}$ (4)
where, x is the coordinate axis in the direction i (i=0, 1, 2), ui corresponds to the mean velocity in i direction, ρ is the air density, T is the temperature, p is the pressure, α is the thermal diffusivity, μ is the molecular viscosity, g is the gravitational acceleration, C is the radon concentration, D is the diffusion coefficient, and λ is the radon decay constant.
The Navier-Stockes equations described above have been discretized by the Finite Volumes Method. The mesh employed is structured quadratic. The advection terms are discretized using the QUICK scheme. Diffusion terms are processed using the second-order scheme. The SIMPLER algorithm was used for the pressure-velocity coupling.
The floor in the hot-room is considered a source of heat and vapor, and all walls and ceilings are modeled adiabatic. The heat is produced by water vapor, which gives a very humid environment (with a humidity rate of up to 100%), whose temperature varies between 20℃ and 50℃. the details of the boundary conditions are presented in Table 1.
Table 1. Properties of the fluids and solids [12]
|
Material |
Density (kg m-3) |
Heat capacity (j kg-1 k-1) |
Thermal conductivity (W m-1 k-1) |
|
Air |
1.225 |
1006.43 |
0.024 |
|
Water vapor |
0.554 |
2.014 |
0.026 |
|
radon |
9.73 |
93.55 |
0.0036 |
|
Dense concrete |
2100 |
840 |
0.8 |
|
Main door and internal Doors |
720 |
1250 |
0.16 |
In order to measure the radon concentration inside the traditional hammam, we used the AlphaGUARD PQ 2000 system [12], It's about an ionization chamber, making to measure continuously the activity of radon in the air, as well as, the various meteorological parameters such as pressure, humidity, and temperature as a function of time.
The radon concentration in a room is given by the following analytical equation [13]:
$C_{\mathrm{Rn}}=\frac{\mathrm{E} \times \mathrm{S}}{\mathrm{V}\left(\lambda_{\mathrm{v}}+\lambda\right)}$ (5)
where, CRn is average radon concentration (Bq m−3); E is radon exhalation rate (Bq m−2 h−1), V is the volume of the room, and λv is the air exchange rate.
8.1 Effect of mesh on the numerical solution
The sensitivity of the results compared to the mesh was checked before proceeding to the calculations. To do this, we took into account three different meshes (2,026,990, 2,902,409 and 3,777,828 cells). The results obtained after the convergence for each mesh are shown in Table 2. It is clear that the variation in the average radon concentration between mesh sizes 2,026,990 and 3,777,828 is negligible.
Table 2. Result of grid independence examination
|
Number of grids |
Average radon concentration (Bq m-3) |
Average temperature (K) |
Average relative humidity (%) |
|
2,026,990 |
292.41 |
297.99 |
40.52 |
|
2,902,409 |
291.25 |
297.25 |
40.52 |
|
3,777,828 |
290.41 |
297.09 |
40.52 |
8.2 Effect of ventilation
In order to study the effect of ventilation on the concentration and distribution of radon inside a traditional hammam, we considered two cases: In the first, we considered the door of the cold-room closed and left the interior doors open (most dominant situation), and in the second we considered all the doors are open (least dominant situation).
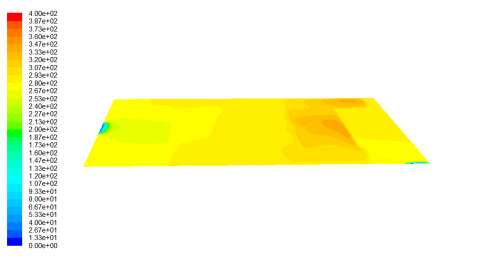
Figure 2. Contours of radon concentration (Bq m−3) in closed Hammam at plane (Y=1.50 m)
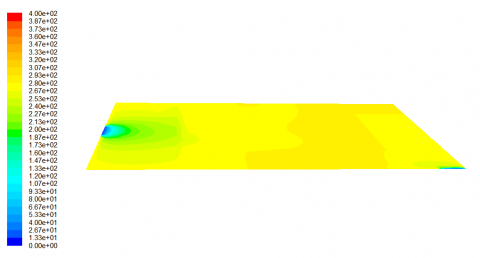
Figures 2 and 3 show the iso-concentrations of radon in the traditional hammam for the two cases studied respectively, plotted in the horizontal median plane (Y=1.5 m). We observe that the radon concentration decreases by increasing ventilation. This decrease is caused by the introduction of fresh air.
Figure 3. Contours of radon concentration (Bq m−3) in open hammam at plane (Y=1.50 m)
In Table 3, we present the average radon concentrations for different ventilation cases. We note that the ventilation sufficiently dilutes the concentration of radon in the traditional hammam. We also note that the hot-room is more polluted than the other rooms (cold-room, warm-room). This is due to the fact that the ventilation rate decreases when as we move away from the entrance to the hammam.
Table 3. Average indoor radon concentration (Bq m−3) in the Hammam
|
|
Coldroom |
Warmroom |
Hotroom |
|
Closed hammam |
280.23 |
287.32 |
307.14 |
|
Opened hammam |
260.56 |
274.95 |
291.62 |
8.3 Effect of temperature
The influence of temperature on the concentration and distribution of radon inside the hammam was studied. We have considered five temperatures the values are 25, 30, 35, 40, 45, and 50℃, with a relative humidity is around 40% and the interior doors are left open.
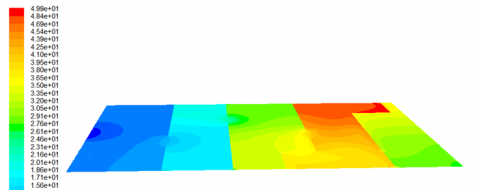
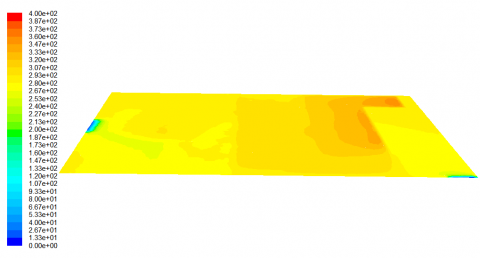
Table 4 represents the average values of the radon concentration inside the hammam as a function of temperature. We observe that the average radon concentration decreases considerably in the hot-room with temperature. While the rest of the hammam is practically stable. This is due to the predominance of forced convection in these rooms (Figure 4).
To have a clear idea of the effect of temperatures on the distribution of radon inside the hammam, we present the iso-concentrations of radon for two temperatures 35℃ and 45℃ respectively (Figures 5 and 6). By comparing these figures, we see that the increase in temperature has a slight influence on the radon distribution.
Figure 4. Contours of temperature at plane (Y=1.50 m)
Figure 5. Contours of radon concentration in the hammam for T=35℃
Figure 6. Contours of radon concentration in the hammam for T=45℃
Table 4. Average radon concentration (Bq m−3) for various temperature with RH=40%
|
Temperature (℃) |
Coldroom |
Warmroom |
Hotroom |
|
25 |
279.36 |
286.90 |
318.88 |
|
30 |
280.23 |
287.32 |
307.14 |
|
35 |
287.84 |
282.07 |
287.84 |
|
40 |
275.11 |
280.16 |
281.61 |
|
45 |
274.33 |
279.82 |
280.83 |
|
50 |
273.86 |
279.71 |
280.30 |
8.4 Effect of relative humidity
In order to study the effect of relative humidity on the concentration and distribution of radon inside the hammam, we considered different values: 40%, 50%, 60%, 70%, and 80%, with a temperature is around 30℃ and the interior doors are left open.
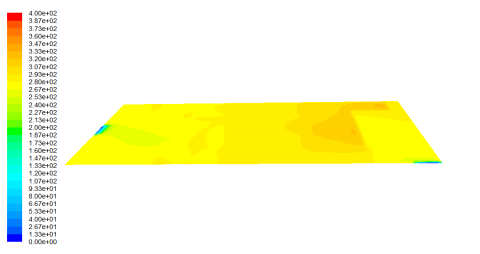
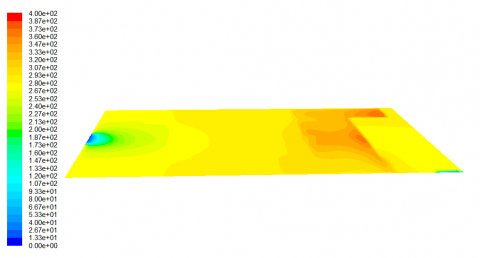
Table 5 presents the average values of the radon concentration inside the hammam studied as a function of relative humidity. We observe that the radon concentration gradually increases with increasing relative humidity. Indeed, when humidity increases inside the hammam, the diffusion coefficient decreases, which reduces the diffusion length of radon and consequently reduces its transfer to areas of low concentration (Figure 7) [14].
In order to have an idea of the effect of relative humidity on the distribution of radon, we present the iso-concentrations of radon at different relative humidity levels (40%, 60%, and 80%) which are illustrated in Figures 8, 9, and 10. By comparing these figures, we see that the radon concentration increases slightly with relative humidity.
Figure 7. Contours of relative humidity at plane (Y=1.50 m)
Figure 8. Contours of radon concentration in the hammam for RH=40%
Figure 9. Contours of radon concentration in the hammam for RH=60%
Figure 10. Contours of radon concentration in the hammam for RH=80%
Table 5. Average radon concentration (Bq m−3) for various relative humidities with T= 30℃
|
Relative Humidity (%) |
Coldroom |
Warmroom |
Hotroom |
|
40% |
280.23 |
287.32 |
307.14 |
|
50% |
282.16 |
291.36 |
312.74 |
|
60% |
284.95 |
293.27 |
319.61 |
|
70% |
285.48 |
295.95 |
324.57 |
|
80% |
287.62 |
297.42 |
327.15 |
8.5 Experimental results
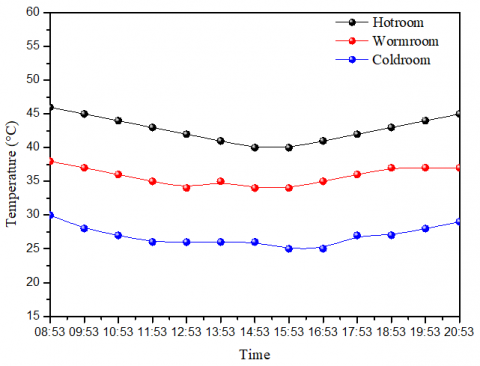
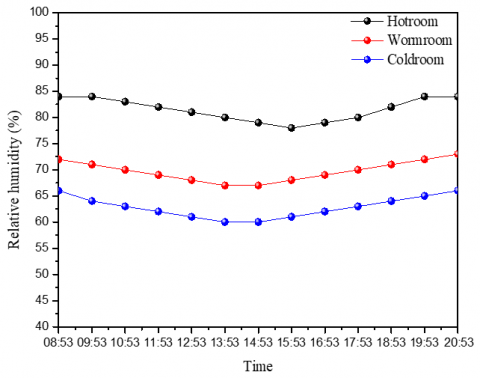
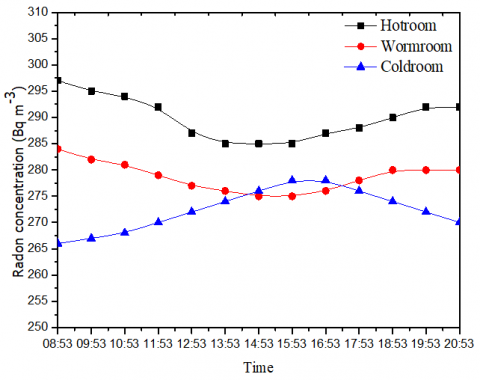
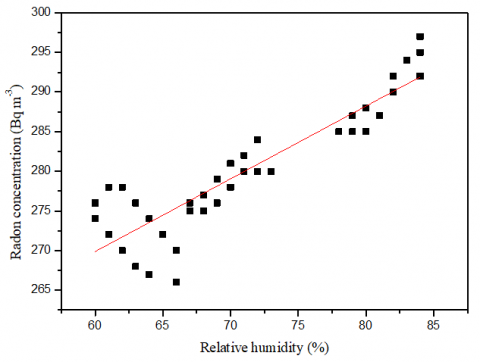
To confirm the impact of ventilation, temperature, and relative humidity on the radon level in the hammam, we have performed a continuous measurement of radon concentration in the three rooms of hammam for two days in the month of April 2020 using AlphaGUARD PQ 2000. We placed AlphaGUARD PQ 2000 at a height of 1.5m from the ground and taking a 60-minute step. The results obtained show a significant difference in the radon concentration in the three chambers (Figures 11, 12, and 13). The average obtained in the hot-room is 289 Bq.m-3 with 292 Bq.m-3 is the maximum value obtained at 8 h 53 min. While the average in a cold-room is 272 Bq.m-3 with a maximum value of 278 Bq.m-3 obtained at 15 h 53 min. From these results, it can be deduced that temperature and relative humidity have an influence on radon concentration. To have a clear idea of the effects of changes in temperature and humidity on the concentration of radon inside the hammam, we plotted a linear correlation of relative humidity with the radon concentration (Figure 14). These results are also in agreement with simulation data and previous research studies [15].
Figure 11. Diurnal variation of the temperature inside the hammam traditional
Figure 12. Diurnal variation of relative humidity inside the hammam traditional
Figure 13. Diurnal variation of radon concentration inside the hammam traditional
Figure 14. Correlation between indoor radon concentration and relative humidity
8.6 Model validation
The validation of the calculation program is very important for ensuring the results obtained. For this, we compared the results obtained by CFD simulation with experimental data and analytical solution (Eq. 5). The measurements were carried out in the three rooms (hot-room, warm-room, and cold-room) (Table 6). We notice that the agreement is good between the experimental data and the results of the numerical simulation.
8.7 Estimation of the annual effective dose
The annual effective dose expressed in (mSv / year / hour of exposure) due to radon for members of the public can be determined using the following formula [1]:
$E=A_{c}\left({ }^{222} R n\right) \times F \times t \times D$ (6)
where, Ac (222Rn) is the mean value of radon concentration (222Rn) (Bq.m-3), F=0.4 is the equilibrium factor between radon and its descendants inside the hammam, t=1 h/year and D=9.0 10-6 mSv (Bq.m-3. h)-1 is the dose conversion factor.
Table 7 shows the effective dose of radon inside the hammam, varying from 1.04 to 0.98 mSv y-1 in the hot-room and cold-room, respectively. These values of radon effective dose are less than the maximum permissible dose defined by the annals of the International Commission on Radiological Protection (ICRP) [16], which are about 10 mSv y-1 for occupational and public exposures.
Table 6. Comparison of simulation results with experimental measurements inside the Hammam
|
Rooms |
Radon concentration (Bq m-3) |
|||
|
Measurement |
CFD Simulation |
Analytical |
Relative deviation* |
|
|
Hot room |
289 |
307 |
270 |
5% |
|
Warm room |
278 |
287 |
265 |
3% |
|
Cold room |
272 |
280 |
260 |
2% |
Note: *Relative deviation=(Measurement-CFD Simulation)/CFD prediction.
Table 7. Annual effective doses (AED) calculated in the Hammam
|
Rooms |
Average radon concentration (Bq m-3) |
Annual effective doses (mSv y-1) |
|
Hotroom |
289.92 |
1.04 |
|
Warmroom |
278.69 |
1.00 |
|
Coldroom |
272.38 |
0.98 |
We have studied numerically using CFDs and experimentally using AlphaGUARD the effects of ventilation, temperature, and relative humidity on the concentration and distribution of radon inside a traditional hammam. The results obtained showed that ventilation, temperature, and relative humidity have important effects on the concentration and distribution of radon. We have found that the concentration of radon decreases while increasing the rate of ventilation, as well as, as the temperature increases, however, it increases with increasing relative humidity. Also, we compared the results obtained by the numerical simulation with those obtained experimentally. The close agreement between simulation and experiments suggests that CFD modeling technique is capable of predicting the indoor radon distribution for real conditions. The prediction of the radon levels by this technique is less time consuming, cost-effective, and more versatile.
[1] United Nations Scientific Committee on the Effects of Atomic Radiation (UNSCEAR). (2000). Sources and Effects of Ionising Radiation. vol. I. Annex B. United Nations, New York.
[2] Ouabi, H. (2009). Modeling of radon and its short-lived decay products emanating from tap water used inside a house: Dose to adult members of the public. Applied Radiation and Isotopes, 67(1): 115-121. https://doi.org/10.1016/j.apradiso.2008.07.010
[3] Zhou, W., Iida, T., Moriizumi, J., Aoyagi, T., Takahashi, I. (2001). Simulation of the concentrations and distributions of indoor radon and thoron. Radiation Protection Dosimetry, 93(4): 357-367. https://doi.org/10.1093/oxfordjournals.rpd.a006448
[4] Akbari, K., Mahmoudi, J., Ghanbari, M. (2013). Influence of indoor air conditions on radon concentration in a detached house. Journal of Environmental Radioactivity, 116: 166-173. https://doi.org/10.1016/j.jenvrad.2012.08.013
[5] Rabi, R., Oufni, L. (2017). A theoretical investigation of the distribution of indoor radon concentrations. Indian Journal of Physics, 91: 471-479. https://doi.org/10.1007/s12648-016-0932-8
[6] Chauhan, N., Chauhan, R.P., Joshi, M., Agarwal, T.K., Aggarwal, P., Sahoo, B.K. (2014). Study of indoor radon distribution using measurements and CFD modeling. Journal of Environmental Radioactivity, 136: 105-111. https://doi.org/10.1016/j.jenvrad.2014.05.020
[7] de With, G., de Jong, P. (2011). CFD modelling of thoron and thoron progeny in the indoor environment. Radiation Protection Dosimetry, 145(2-3): 138-144. https://doi.org/10.1093/rpd/ncr056
[8] Rabi, R., Oufni, L. (2017). Study of radon dispersion in typical dwelling using CFD modeling combined with passive-active measurements. Radiation Physics and Chemistry, 139: 40-48. https://doi.org/10.1016/j.radphyschem.2017.04.012
[9] Agarwal, T.K., Joshi, M., Sahoo, B.K., Kanse, S.D., Sapra, B.K. (2016). Effect of 220Rn gas concentration distribution on its transmission from a delay chamber: evolving a CFD-based uniformity index. Radiation Protection Dosimetry, 168(4): 546-552. https://doi.org/10.1093/rpd/ncv361
[10] Agarwal, T.K., Sahoo, B.K., Gaware, J.J., Joshi, M., Sapra, B.K. (2014). CFD based simulation of thoron (220Rn) concentration in a delay chamber for mitigation application. Journal of Environmental Radioactivity, 136: 16-21. https://doi.org/10.1016/j.jenvrad.2014.05.003
[11] Amrane, M., Oufni, L., Misdaq, M.A. (2014). Attached and unattached fractions of short-lived radon decay products in outdoor environments: Effect on the human respiratory system. Radiation Protection Dosimetry, 162: 400-409. https://doi.org/10.1016/j.radmeas.2005.02.007
[12] Lide, D. (2004). CRC Handbook of Chemistry and Physics. Florida: CRC press.
[13] Gupta, M., Mahur, A.K., Sonkawade, R.G., Verma, K.D., Prased, R. (2010). Measurement of radon activity, exhalation rate and radiation doses in fly ash samples from NTPC Dadri, India. Indian Journal of Pure & Applied Physics, 48: 520-523. http://nopr.niscair.res.in/handle/123456789/9913
[14] Singh, K., Singh, M., Singh, S., Sahota, H.S., Papp, Z. (2005). J Variation of radon (222Rn) progeny concentrations in outdoor air as a function of time, temperature and relative humidity. Radiation Measurements, 39(2): 213-217. https://doi.org/10.1016/j.radmeas.2004.06.015
[15] Singh, M., Singh, K., Singh, S., Papp, Z. (2008). J. Environ. Variation of indoor radon progeny concentration and its role in dose assessment. Journal of Environmental Radioactivity, 99(3): 539-545. https://doi.org/10.1016/j.jenvrad.2007.08.023
[16] International Commission on Radiological Protection, Proceedings of the Third International Symposium on the System of Radiological Protection. (2016). Annals of the ICRP, 45: 1S.