Saleem K. Kadhim* | Mohammed G. Al-Azawy | Sinan Abdul-Ghafar Ali | Mina Qays Kadhim
© 2021 IIETA. This article is published by IIETA and is licensed under the CC BY 4.0 license (http://creativecommons.org/licenses/by/4.0/).
OPEN ACCESS
Cardiovascular diseases were the main cause for loosing lives in the last decades due to the restricted blood flow states in the blood vessels areas. Numerical investigations have been conducted as the aim of this work to examine the blood flow, and wall shear stresses adjacent to the mono stenosis up to different degrees involved in the main, side and distal main branches as well as observe the pulsatile flow of blood in the left coronary artery through various percentage of stenosis. Both the Carreau non-Newtonian rheological model and the Newtonian model were utilized to model the blood fluid and wall shear stresses of left coronary artery, in a row, all the calculated data were validated with the previously published papers. It was found that the blood flow inside areas of the artery lie within the range of non-Newtonian rheological effects can be present, verifying the need to treat blood as non-Newtonian fluid; especially, with the case of 90% blockage.
left coronary artery, double stenosis, non-Newtonian flow, wall shear stress, computational fluid dynamics
As mentioned earlier that, many cardiovascular diseases (CD) that threaten the human life, is the main reasons to blood flow problems in blood vessels area. Moreover, one of the vascular diseases is coronary artery disease, which is a fatal disease if actions not taken immediately. Earlier research on coronary artery clarified that one of the causes of coronary artery disease is atherosclerosis which may impedes the blood flow within the arteries and eventually leads to lumen stenosis [1].
Recently, extensive researches have been implemented on arterial blockage. The clogged arteries have a smaller diameter compared to actual arteries due to accumulation of fat deposits and cholesterol in the arteries’ walls. This clogged artery causes a change in the blood flow dynamics (The mechanical behavior of the blood vessel wall), such as deformity and shear stress on the artery wall [2]. Which may lead to rupture, vascular disease, like atherosclerosis [3].
Young and Tsai [2] introduce experimental study on the Newtonian blood flow in the arterial stenosis, the hydrodynamic factors, like pressure drop, separated flow region downstream from the stenosis, and turbulence was observed. Symmetrical axial condition stenosis types were used in the presented model. They concluded that increasing the clogging and current inertia could cause strong vortices in the artery.
While five different models of non-Newtonian (Carreau, Walburn-Schneck, Power law, Casson and Generalised power law model) and the Newtonian model have been used by Johnston et al. [4] in order to study the wall shear stress effects within four different right coronary arteries. local and global non-Newtonian important factor through these models were checked out, the non-Newtonian model came out to have better approximation of wall shear stress at low shear. Regarding the differences in models, Carreau Yasuda model was used by Amornsamankul et al. [5], to examine the blood flow within artery stenosis using several variants of pulsatile flow and different inlet velocity profile. The authors investigated the wall shear stress, velocity fields, strain rate and vortex distribution for Newtonian and non-Newtonian models and noticed that there were significant differences between these models. Sun et al. [6] conducted an experimental investigation utilizing medical imaging visualization techniques to have a look at the coronary artery wall due to presence of stenosis. They found that imaging visualization technique is extremely important to recognize the stenosis or occlusion of the coronary artery disease. On the other hand, Zaušková and Medvid’ová [7] performed Numerical study by simulating the non-Newtonian flow in compliant stenosis vessels. Having a comparison between the shear-thinning non-Newtonian fluids with the Newtonian model. Experimental steps for some non-Newtonian models have been performed, compared with the Newtonian model. Hemodynamic wall parameters such as the wall shear stress and the oscillatory shear index has been found. A Computational fluid dynamics (CFD) has been done by Chaichana et al. [1], which investigated the hemodynamic effect of simulated plaques in left coronary artery models. Depending on a real data from a patient as realistic physiological conditions to understand the cardiac hemodynamics. Mentioning that a comparison between the thickness of wall sheer stresses of Newtonian and non-Newtonian fluid models was performed to show similarity. It has been reported that many factors could be a reason for atherosclerosis. as all together like; the effect of plaques in the left coronary artery on the vortices of the WSS blood velocity regions, and wall pressure gradient. Numerical studies was also conducted by Kamangar et al. [8] to examine the impact of left coronary bifurcation angulation (BA) variations and percentage of flow distribution variations (FDV) in coronary artery branches (CAB) on anatomic assessment of bifurcated lesions as a standard diagnostic parameter. Three types of stenosis configurations 70%, 80%, and 90% were utilized in proposed model. Al-Azawy et al. [9] used the comparison techniques to examine the two models which are a non-Newtonian blood flow (Carreau and Cross) within a positive displacement pump with the Newtonian model via examining the shear rate and wall shear stress. The conclusion was that; to deal with the blood as non-Newtonian flow in order to get an acceptable estimate of rheology of blood levels through the medical devices.
In 2017 Lee et al. [10], observe the fractional flow reserve alterations in a post-stenosis distal part, due to the presence of pre-stenotic swirl flow by CFD analysis that implemented for virtual stenotic models. Three kinds of stenotic coronary were utilized: (a) mild, degree of stenosis of 0 ~ 40%, (b) The moderate, with degree of stenosis of 50 ~ 60%, and (c) severe (blockage), degree of stenosis of 70 ~ 90%. the influence of pre-stenotic swirl flow was not noticeable while increasing the degree of stenosis. Hence, the impact of stenosis were dominant on fractional flow reserve (FFR) compared to those of swirl flow in the moderate or severe stenotic kinds. On side branch (SB) in the left coronary artery, Iannaccone et al. [11] implemented numerical observations on the impact of bifurcation angle, plaque composition, and procedural strategy using two bifurcation angle (45°, 70°) and four plaque types (fully lipid, fully fibrous, lipid with half and fully calcified ring distal to the carina). Showing that; the SB lumen volume compromise was evident and, plaque type has more influence on Sb ostium shape than bifurcation angle. The numerical simulations clarify that: ellipsoidal of the SB ostium, generally without significant lumen compromise. Provisional stenting in the presence of calcifications resulted in a more severe outcome for the SB ostium. Involving the blood density as a constant parameter in Quanyu et al. [12] assumptions as a 3-D uncomplicated arm arteries had been simulated, the Carreau fluid model, and laminar blood flow model. The results showed that, the brachial and bifurcations have the high pressure and velocity outline. Then the brachial and bifurcations have the high pressure and velocity outlines. Regarding the modeling of intraventricular a 3-D simulation of a viscous flow past a compliant model of arteriovenous-graft anastomosis was carried out by Bai and Zhu [13]. It examine the effect of arteriovenous graft (AVG)-vein diameter ratio, and Reynolds number (Re). It showed that; the influences of the parameters vein diameter ratio, and Re lie largely on the graft. In addition; the WSS gradient, wall normal stress gradient and their averaged values on the graft are noticeably greater than those on the vein. In 2019 a blood flow in a portion of the upper part of a child’s aorta was CFD investigated by Selmi et al. [14], an unsteady and complex behavior of the blood flow was shown, the velocity field, pressure, and displacement distributions were also examined through a cardiac cycle and it is very important in the CD studies.
Many researchers investigate blood flow and shear stresses adjacent to the mono stenosis at different degree of stenosis in the side branch (SB) and the main branch (DMB). It is important to record that main confrontation in stenosis simulation part. In what follows, the present author continued to their preliminary work by Al-Azawy et al. [9], in this paper, trapezoidal single stenosis were utilized through a model of artery to assess the level of non-Newtonian.
Therefore, in the current work, a non-Newtonian Carreau model has been utilized in order to examine the blood flow through the double stenosis in the left coronary artery. The aim of this work is evaluating the possible impact of using Newtonian and non-Newtonian models through the double stenosis in the coronary artery.
2.1 Simulated geometry
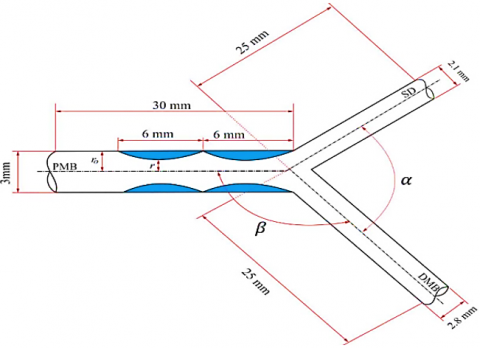
Figure 1 shows the complete double stenosis in the left coronary artery, including symmetrical stenosis and the coronary artery is configured to be the right tracts. The 2D model is based on a 3.3 mm, 30 mm main branch (PMB) diameter and length of coronary artery, respectively. The length and diameter of side branch (SB) is 25 mm, 2.1 mm, respectively. Also, the diameter and length of the distal main branch (DMB) is 2.8 mm, and 25 mm, respectively. Figure 1b illustrates all dimension of the stenosis and coronary artery (PMB to DMB angle was set to 150° [15], also, the distal angle between SB and DMB is 40°) [16].
(a) snapshot of the left coronary artery Selmi et al. [14]
(b) dimension of the stenosis Onuma Y et al. [17]
(c) dimensions of the artery with stenosis that used in the current work
Figure 1. Model of coronary artery and double stenosis
2.2 Boundary conditions
It is necessary to have a set of conditions to get the dominated equation and to determine the arbitrary functions that concluded from the integration of the dominated equation. These conditions are considered as the initial or boundary conditions, the domain of the problem’s boundary could be satisfied by the dependent variable or it’s derivative where is the conditions mentioned above need it as a requirement.
Furthermore, the coronary artery consists of main branch (PMB) which represents equivalent inlet blood flow, whereas the distal main branch (DMB) this is equivalent first outlet blood flow (out1), and side branch (SB) this represents second outlet blood flow (out2). Three different area stenosis are including in the present investigation: 70% (moderate), 80% (Intermediate) and 90% (severe "Blockage"), as calculated by Lee et al. [10]. Table 1 illustrates the details of the stenosis arteries.
Table 1. Dimension of the area stenosis and artery used in this work
|
Artery |
Moderate 70% |
Intermediate 80% |
Severe (Blockage) 90% |
|||
|
r (mm) |
ro (mm) |
r (mm) |
ro (mm) |
r (mm) |
ro (mm) |
|
|
PMB |
1.5 |
1.095 |
1.5 |
1.025 |
1.5 |
0.95 |
|
DMB |
1.4 |
0.974 |
1.4 |
0.9 |
1.4 |
0.82 |
|
SB |
1.05 |
0.604 |
1.05 |
0.512 |
1.05 |
0.397 |
|
length |
l=6 mm |
l=6 mm |
l=6 mm |
|||
Notes: ro is the radius of stenosis, r represents the radius of artery, l is the length of each stenosis.
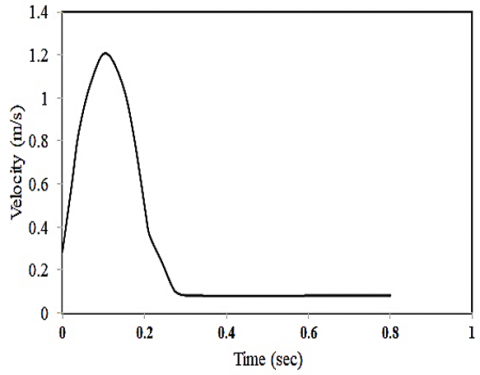
Blood was assumed as laminar. The flowing blood is treated as non-Newtonian and characterised by Carreau model. The inlet velocity was introduced as follows [12]:
$v= \begin{cases}1.2 * \sin \sin (4 * \pi *(t+1.6)) & t>0.218 \mathrm{~s} \\ 0.1 & t<0.218 \mathrm{~s}\end{cases}$ (1)
From this equation, the peak velocity was recorded to be 1.2 m/s and a minimum velocity of 0.1 m/s (see Figure 2). Assuming a heartbeat rate of 75 BPM (beats per minute); the duration of each period is 0.8 s [12]. The blood rate during normal activities of the human body, also, the blood intensity utilized is 1060 kg/m3.
Figure 2. Velocity inlet profile (Sine wave in the systolic phase) in main artery (PMB) [12]
As seen, the sine wave in the systolic phase varies with time in Eq. (1). To include this equation as a boundary condition in the software, a User Defined Function (UDF) was developed which incorporate this equation into the inlet boundary conditions. This UDF subroutines namely, DEFINE_PROFILE (inlet_velocity, thread, position) enables the transient velocity simulation at the inlet boundary of the model, as shown in Figure 2.
A wall boundary condition was used to bound both the fluid and solid regions. The no slip condition (fluid velocity equal to zero) has been enforced at this boundary. Solution convergence was achieved at the third cardiac cycle.
3.1 Meshes descriptions
For each model, a mixture of prism layer (at the boundary layer areas) and tetrahedral mesh (for the other parts) was utilized using ANSYS Meshing v.19.1 [18], as illustrated in Figure 3. A prism layer of four layers was employed to resolve the boundary layer. Advanced sized function was utilized to be used as near and bended compared to other methods. Fine is the level of the relevance center and span angle; while high is the set chosen for the smoothing function on the other hand slow was the level chosen for the transition angle.
Figure 3. Finite volume model discretization for the left coronary artery geometry
3.2 Governing equations
In order to evaluate the hemodynamics of blood flow through the arteries, the equations that governing the blood flow include the flow continuity equation (see Eq. (1)) and the Navier-Stokes (see Eqns. (2) to (5)). For Navier-Stokes equations, an equilibrium point was set between the left hand side and the right hand side of the equation in which it represent the inertia forces: pressure force, body force, and viscous force [19].
Continuity equation is:
$\frac{\partial u}{\partial x}+\frac{\partial v}{\partial y}+\frac{\partial w}{\partial z}=0$ (2)
Navier stoke equation which represents:
$\rho\left(\frac{\partial u}{\partial t}+u \frac{\partial u}{\partial x}+v \frac{\partial u}{\partial y}+w \frac{\partial u}{\partial z}\right)$
$=-\frac{\partial p}{\partial x}+\rho g_{x}+\mu(s)\left(\frac{\partial^{2} u}{\partial x^{2}}+\frac{\partial^{2} u}{\partial y^{2}}+\frac{\partial^{2} u}{\partial z^{2}}\right)$ (3)
$\rho\left(\frac{\partial v}{\partial t}+u \frac{\partial v}{\partial x}+v \frac{\partial v}{\partial y}+w \frac{\partial v}{\partial z}\right)=-\frac{\partial p}{\partial y}+\rho g_{y}+$
$\mu(s)\left(\frac{\partial^{2} v}{\partial x^{2}}+\frac{\partial^{2} v}{\partial y^{2}}+\frac{\partial^{2} v}{\partial z^{2}}\right)$ (4)
$\rho\left(\frac{\partial w}{\partial t}+u \frac{\partial w}{\partial x}+v \frac{\partial w}{\partial y}+w \frac{\partial w}{\partial z}\right)=-\frac{\partial p}{\partial z}+\rho g_{z}+$
$\mu(s)\left(\frac{\partial^{2} w}{\partial x^{2}}+\frac{\partial^{2} w}{\partial y^{2}}+\frac{\partial^{2} w}{\partial z^{2}}\right)$ (5)
where, u, v, w represents the velocity in x, y, z direction, ρ represents the density of fluid, and gi is the body force in i-direction, and μ(s) represents the viscosity of blood which depends on assumption of the working fluid as Newtonian or non-Newtonian. Furthermore, the blood viscosity that relay on the magnitude of the shear: which is computed from the shear rate tensor as:
$S=\sqrt{2 S_{i j} S_{i j}}$, where $S_{i j}=\frac{1}{2}\left(\frac{\partial u_{i}}{\partial x_{j}}+\frac{\partial u_{j}}{\partial x_{i}}\right)$ (6)
In order to capture the effects of various viscosity models on the flow behavior through the model, the Carreau model is used in the present study, on account of superior performance of non-Newtonian flow effects within the medical devices as identified previously by the present author [9, 20] and other researchers [4, 21]. The Carreau model complies with the following form, where μ∞ is the infinite shear viscosity (μ∞=0.00345 Pa.s), μo is the viscosity of blood at zero shear rate (μo=0.056 Pa.s), λ represents the relaxation time constant (λ=3.313 s) and n=0.3568 [22].
$\mu(S)=\mu_{\infty}+\left(\mu_{0}-\mu_{\infty}\right)\left(1+(\lambda S)^{2}\right)^{\frac{(n-1)}{2}}$ (7)
CFD software (ANSYS FLUENT v.19.1) based on finite volume method was used to perform the solution of the unsteady aforementioned equations; using the PISO algorithm in the current 3-D laminar CFD model, pressure–velocity coupling can be obtained, the convergence of the residual monitor was check to be 0.0001. Located discretization is second-order upwind, and the second-order implicit scheme is applied in time by using Green–Gauss cell-based scheme is used for gradient reconstruction. Also, a fixed time stepping method is chosen, time step size Δt=0.1 s was encountered to be satisfactory, giving a Courant-Friedrichs Lewy (CFL) number around 1 inside the artery, the time steps was 8, and the maximum iterations were 200 per time step.
3.3 Mesh independence of CFD model
In order to evaluate the optimal mesh resolution, mesh independence investigation depending on the difference in the velocity that was calculated using four different number of cells through the artery (case study: double stenosis degree of 80% in the PMB). It is shown that all the results are in an average difference (when 1,313,580 cells, 1,970,371, 2,955,557, and 4,433,335 elements, respectively), the velocity obtained from these models and all meshes share similar results with minor differences around the artery stenosis. Meshes with more than 2,955,557 resulted in insignificant differences and with an average relative difference of less than 2%. The maximal local difference was significantly higher (up to 95%), however this local difference was a consequence of the resolution of the boundary layer at specific time instants. Therefore 2,955,557 elements are used as the optimum number of mesh for the simulation. Figure 4 illustrates the percentage difference between coarse mesh, medium mesh, and fine mish of the CFD model against finer mesh.
Figure 4. Mesh independence in the present work
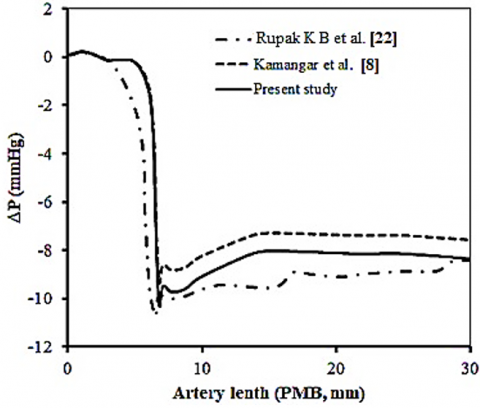
The current CFD model was validated against previous numerical published data of Rupak et al. [23], and Kamangar et al. [8]. Figure 5 shows the comparison of the current CFD result with the previous published data through the area stenosis in PMB artery during the systolic and diastolic phases. A transient simulation for the flow rate of 5×10⁻⁵ m3/min was chosen to validate the current work. The numeric results obtained was compared with the closely related articles previously published in the open literature [5, 23]. Figure 5 shown that the axial pressure drop obtained compared to the numerical values obtained from Kamangar et al. [8] is considered more accurate. Therefore, the results are found to be satisfied ones with the previous published article. Consequently, the fine mesh (2,955,557 cells) could be used with confidence in the present study to simulate the left artery coronary and to implement blood flow analysis.
Figure 5. Comparison of the present study result with previous published data of Rupak et al. [23], and Kamangar et al. [8]; pressure drop shown is through the area stenosis in PMB artery during the systolic phase
Primary parameters that obtained from the current simulation depending on the blood flow in the stenosis of the artery are the velocity distribution of the blood and the stresses of the shear. A series of isolated different area stenosis are included in the present investigation: 70%, 80%, and 90%, respectively, as shown in Figures 6 and 9 to present the wall shear stresses and velocity distribution inside the domain. Figures 6 to 9 show the velocity magnitude contours, and Figures 11 to 14 present the shear stress vector.
4.1 Blood flow velocity investigation
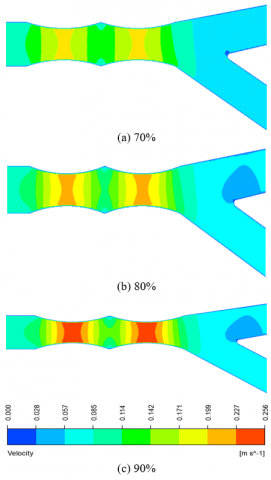
At main branch (PMB, inlet) artery, numerical simulations for blood flowrate as shown in Figure 6a, the velocity contour for blood flow of the double stenosis in PMB has reached 0.183 m/s, at the area stenosis 70%. A redistribution area existed next to the back of the area stenosis region. This is the cause to flow restriction due to sudden expansion. Jet flow occurred at the stenosis gap because of the jet flow, where high velocity values were recorded of 0.183 m/s.
From Figure 6b, it can be seen that the velocity reached a maximum value of 0.28 m/s at the area stenosis 80%. Given that the computational domain includes double stenosis, the result showed that a recirculation region occurred in the sudden expansion. It was reported that in stenosis, the likelihood of blood clotting is higher than that in native artery; however, researcher noticed that the recirculation at the sudden expansion shown in Figure 6 will reduce the possibility of blood clotting within the left coronary artery.
Figure 6c shows the area stenosis in 90%, where a velocity magnitude for blood flow at the stenosis was reached to 0.243 m/s. Leakage blood flow recorded high velocity values because of the small gaps in the stenosis and a noticeable flow recirculation is also observed at the sudden expansion of the main branch (PMB, inlet) artery. However, researcher observed that the increase of the velocity at the area stenosis, which may lead to the blood clotting within the left coronary artery. Figures 7 to 9 show jet flow that occurred at area stenosis. Previous studies found that jet flow occurrence is the most destructive flow to the blood cells, which results in blood clotting and hemolysis [24].
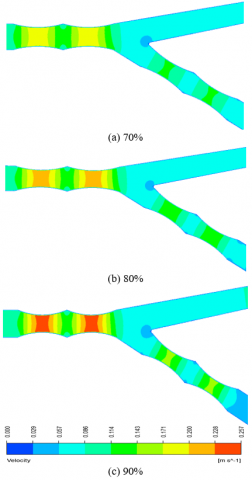
At double stenosis in PMB & SB at different area stenosis, the Figure 6a shows the velocity contour of blood flow velocity in the leakage between the stenosis at area stenosis 70%. The velocity magnitude in the leakage at stenosis in SB & PMB has come nearby to 0.207 m/s, 0.177 m/s, respectively. A redistribution area existed at the sudden expansion of the side and main branches (SB, and PMB) arterial region. At the area stenosis 80%, Figure 6b show the maximum velocity was 0.222, and 0.211 m/s in SB and PMB, respectively. Also Figure 6c, when the area stenosis 90%, the maximum velocity magnitude at stenosis in SB & PMB was 0.294, 0.25 m/s, respectively. However, a comparing mechanism will set between the behavior of the blood flow in a redistribution area to the behavior in the PMB artery, except the difference in the values of velocity.
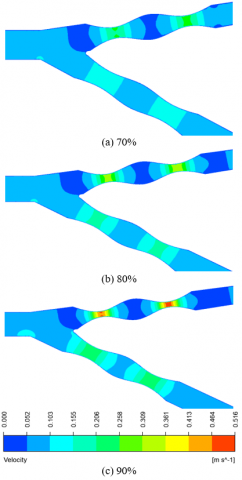
Moreover, when the coronary artery consists of side branch (SB) and the distal main branch (DMB), the general behavior of the blood flow is similar to main branch (PMB) artery and distal main branch (DMB), the side branch artery. Table 2 summarizes the maximum velocity values occurred at the area stenosis which was occurred between the stenosis gap area.
Table 2. Maximum velocity in the stenosis gap area
|
Area stenosis location |
Vmax (m/s) |
Vmax (m/s) |
Vmax (m/s) |
|
|
70% |
80% |
90% |
||
|
Case 1 (PMB) |
0.183 |
0.208 |
0.244 |
|
|
Case 2 |
SB |
0.207 |
0.222 |
0.294 |
|
PMB |
0.177 |
0.211 |
0.250 |
|
|
Case 3 |
PMB |
0.183 |
0.208 |
0.244 |
|
DMB |
0.106 |
0.125 |
0.141 |
|
|
Case 4 |
SB |
0.207 |
0.222 |
0.294 |
|
DMB |
0.106 |
0.125 |
0.141 |
|
4.2 Local importance factor (IF)
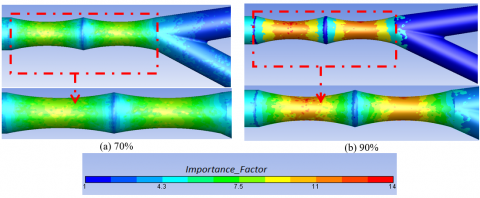
In order to present a more quantitative examination of the non-Newtonian effects levels within the stenosis area, the local ‘importance factor’(IF) assessed as proposed by Johnston et al. [4]. The importance factor was calculated as follows:
$I F=\frac{\mu(S)}{\mu_{\infty}}$ (8)
where, μ(S) is the actual dynamic viscosity that depends on the Carreau model as shown in Eq. (7), and μ∞ is the Newtonian shear viscosity. In general, the IF will be equal to 1 in the Newtonian model, while the values that not equal to one will refer to the zones of the non-Newtonian flow.
Figure 10 showed that the importance factor is investigated and compression between non-newtonian and newtonian blood flow. Figure 10 shows importance factor contour in double stenosis in pmb at different area stenosis (70%, and 90%).
4.3 Wall shear stress (WSS)
One of the most important characteristics for the hydrodynamics of left artery coronary is the shear stress. The blood wall shear stress $\left\|\tau^{\text {wall }}\right\|$ is expressed from viscous shear stress tensor $\tau_{i j}$ and the surface normal vector nj as following [18, 25]:
$\left\|\tau^{\text {wall }}\right\|=\sqrt{\tau_{i}^{\text {wall }} \tau_{i}^{\text {wall }}}$ (9)
$\tau_{i}^{\text {wall }}=\frac{\tau_{i j} \cdot n_{j}}{\sqrt{n_{j} n_{j}}}$ (10)
$\tau_{i j}=2 \nu S_{i j}$ (11)
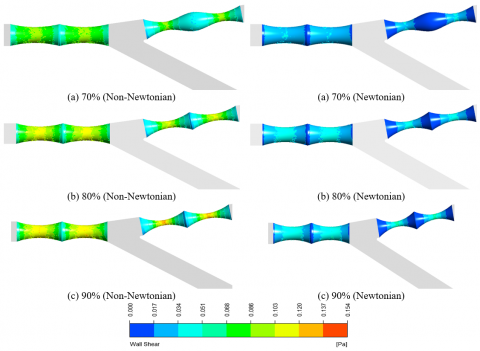
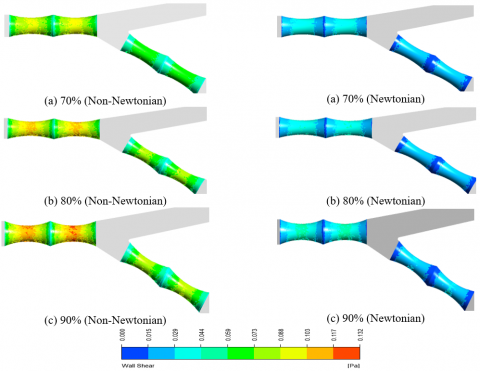
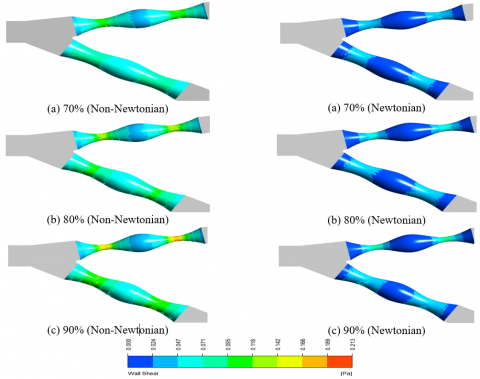
where, the wall shear stress in the i - direction corresponds to coordinate system (x, y, z), ν is the laminar kinematic viscosity. In this section, Figures 11, 12, 13, and 14 showed that the wall shear stress contour as well as compression between non-Newtonian and Newtonian blood flow are investigated.
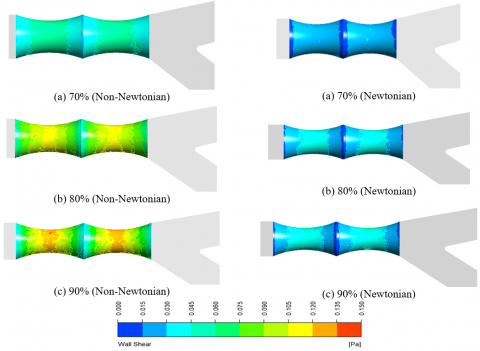
At the main branch (PMB) artery, high wall shear stresses values were located at the stenosis area. The blood shear stress at the stenosis is 0.067 Pa, and 0.042 pa when the blood flow non-Newtonian and Newtonian flow, respectively. A maximized regions of the blood flow shear stresses are located on the, as shown in Figure 11a.
When WSS contour in double stenosis in PMB & SB at 80% area stenosis, a layer with higher blood shear stress values occurred in the SB artery because of the blood flow on the stenosis gap area (Figure 11b). Found that the WSS at the gap area of stenosis is 0.12 Pa at non-Newtonian model and 0.052 Pa in Newtonian model. Also the WSS values occurred in the PMB artery was 0.115 Pa at non-Newtonian model and 0.049 Pa in the Newtonian model. Furthermore, the increase of WSS was due to the maximum blood flow rate pass during this period in the stenosis area.
When WSS contour in double stenosis in PMB & SB at 90% area stenosis, a layer with higher blood shear stress values showed up in the SB artery because of the blood flow on the stenosis gap area (Figure 11c). Furthermore, the WSS in the gap area continue to be high as 0.159 Pa in SB, also, wall shear stress magnitude in the PMB was 0.112 Pa in the non-Newtonian model. Also the WSS in the Newtonian model at SB and PMB was 0.063 Pa, 0.051 Pa, respectively.
The clinical relevance of the importance factor is described for the examined cases, observing that the levels of non-Newtonian model are predicted to be higher in the 70% blockage than that observed within the 90%, as shown in Figures 11, 12, 13, and 14.
Table 3 summarizes the different area stenosis (70%, 80%, and 90%) presented above where the maximum wall shear stress in the stenosis is presented for different area stenosis, which corresponds to one cardiac cycle.
Table 3. Maximum wall shear stress in the stenosis gap area
|
Area stenosis location |
WSSmax (Pa) |
WSSmax (Pa) |
WSSmax (Pa) |
||||
|
70% |
80% |
90% |
|||||
|
Non-New. |
New. |
Non-New. |
New. |
Non-New. |
New. |
||
|
Case 1(PMB) |
0.067 |
0.042 |
0.083 |
0.046 |
0.12 |
0.052 |
|
|
Case 2 |
SB |
0.114 |
0.052 |
0.12 |
0.063 |
0.159 |
0.103 |
|
PMB |
0.108 |
0.101 |
0.115 |
0.049 |
0.121 |
0.063 |
|
|
Case 3 |
PMB |
0.110 |
0.041 |
0.117 |
0.046 |
0.127 |
0.052 |
|
DMB |
0.074 |
0.021 |
0.08 |
0.023 |
0.092 |
0.023 |
|
|
Case 4 |
SB |
0.126 |
0.052 |
0.155 |
0.074 |
0.182 |
0.089 |
|
DMB |
0.103 |
0.028 |
0.094 |
0.036 |
0.109 |
0.041 |
|
Figure 6. Velocity contour in double stenosis in PMB at different area stenosis
Figure 7. Velocity contour in double stenosis in PMB & SB at different area stenosis
Figure 8. Velocity contour in double stenosis in PMB & DMB at different area stenosis
Figure 9. Velocity contour in double stenosis in SB & DMB at different area stenosis
Figure 10. Importance factor for Carreau model
Figure 11. Shear stress contour in double stenosis in PMB at different area stenosis
Figure 12. Shear stress contour in double stenosis in PMB & SB at different area stenosis
Figure 13. Shear stress contour in double stenosis in PMB & DMB at different area stenosis
Figure 14. Shear stress contour in double stenosis in SB & DMB at different area stenosis
The present numerical investigation was accomplished to examine unsteady, laminar and non-Newtonian blood flow through a stenosis artery using a Carreau model. The numerical simulation evaluation, have been presented and discussed for velocity, WSS and importance factor. A 3-D realistic CFD model consisting of left coronary, which includes double stenosis, was utilized to observe the blood hydrodynamics and wall shear stresses at different area stenosis are 70%, 80%, and 90%, respectively. A proximate and desirable results was obtained between numerical results of the current study and the related articles previously published in the open literature at axil pressure drop. Also found that the high velocity occurred at the area stenosis, which may lead to the jet flow, this which may lead to higher WSS within stenosis area. This study also uncovers that WSS valued at the area stenosis (90% blockage in the SB, DMP, and BMP), this which may cause blood clotting. Where it was found that the values of WSS in the non-Newtonian flow at the area stenosis (90% blockage in the SB, DMP, and BMP) used in the paper are higher than the Newtonian flow of 51%. It was concluded that the blood flow inside areas of the artery noticed to lie within the range of non-Newtonian rheological effects can be present, explaining the urge to deal with blood as non-Newtonian fluid; especially, with the case of 90% blockage.
[1] Chaichana, T., Sun, Z., Jewkes, J. (2012). Computational fluid dynamics analysis of the effect of plaques in the left coronary artery. Computational and Mathematical Methods in Medicine, 2012: 504367. https://doi.org/10.1155/2012/504367
[2] Young, D.F., Tsai, F.Y. (1973). Flow characteristics in models of arterial stenoses—I. Steady flow. Journal of Biomechanics, 6(4): 395-410. https://doi.org/10.1016/0021-9290(73)90099-7
[3] Rybicki, F.J., Melchionna, S., Mitsouras, D., Coskun, A.U., Whitmore, A.G., Steigner, M., Leelakrishna Nallamshetty, Welt, F.G., Bernaschi, M., Borkin, M., Sircar, J., Kaxiras, E., Succi, S., Stone, P.H., Feldman, C.L. (2009). Prediction of coronary artery plaque progression and potential rupture from 320-detector row prospectively ECG-gated single heart beat CT angiography: Lattice Boltzmann evaluation of endothelial shear stress. The International Journal of Cardiovascular Imaging, 25(2): 289-299. https://doi.org/10.1007/s10554-008-9418-x
[4] Johnston, B.M., Johnston, P.R., Corney, S., Kilpatrick, D. (2004). Non-Newtonian blood flow in human right coronary arteries: Steady state simulations. Journal of Biomechanics, 37(5): 709-720. https://doi.org/10.1016/j.jbiomech.2003.09.016
[5] Amornsamankul, S., Wiwatanapataphee, B., Wu, Y.H., Lenbury, Y. (2006). Effect of non-Newtonian behaviour of blood on pulsatile flows in stenotic arteries. International Journal of Biological and Medical Sciences, 1(1): 42-46. https://doi.org/10.5281/zenodo.1084738
[6] Sun, Z., Dimpudus, F.J., Nugroho, J., Adipranoto, J.D. (2010). CT virtual intravascular endoscopy assessment of coronary artery plaques: A preliminary study. European Journal of Radiology, 75(1): e112-e119. https://doi.org/10.1016/j.ejrad.2009.09.007
[7] Hundertmark-Zaušková, A., Lukáčová-Medvid’ová, M. (2010). Numerical study of shear-dependent non-Newtonian fluids in compliant vessels. Computers & Mathematics with Applications, 60(3): 572-590. https://doi.org/10.1016/j.camwa.2010.05.004
[8] Kamangar, S., Badruddin, I.A., Ahamad, N.A., Govindaraju, K., Nik-Ghazali, N., Ahmed, N.J., Badarudin, A., Khan, T.M. (2017). The influence of geometrical shapes of stenosis on the blood flow in stenosed artery. Sains Malaysiana, 46(10): 1923-1933. https://doi.org/10.17576/jsm-2017-4610-31
[9] Al-Azawy, M.G., Turan, A., Revell, A. (2017). Investigating the impact of non-Newtonian blood models within a heart pump. International Journal for Numerical Methods in Biomedical Engineering, 33(1): e02780. https://doi.org/10.1002/cnm.
[10] Lee, K.E., Kim, G.T., Ryu, A.J., Shim, E.B. (2017). The influences of swirl flow on fractional flow reserve in mild/moderate/severe stenotic coronary arterial models. Journal of Computational Fluids Engineering, 22(1): 15-25. https://doi.org/10.1007/s11244-010-9466-z
[11] Iannaccone, F., Chiastra, C., Karanasos, A., Migliavacca, F., Gijsen, F., Segers, P., Wentzel, J. (2017). Impact of plaque type and side branch geometry on side branch compromise after provisional stent implantation: A simulation study. Euro Intervention, 13(2): E236-E245. https://doi.org/10.4244/EIJ-D-16-00498
[12] Wu, Q.Y., Liu, X.J., Pan, L.J., Tao, W.G., Qiu, C.Q. (2017). Simulation analysis of blood flow in arteries of the human arm. Biomedical Engineering: Applications, Basis and Communications, 29(4): 1-8. https://doi.org/10.4015/S1016237217500314
[13] Bai, Z., Zhu, L. (2019). Simulation of blood flow past a distal arteriovenous-graft anastomosis at low Reynolds numbers. Physics of Fluids, 31(9): 091902. https://doi.org/10.1063/1.5099635
[14] Selmi, M., Belmabrouk, H., Bajahzar, A. (2019). Numerical study of the blood flow in a deformable human aorta. Applied Sciences, 9(6): 1216. https://doi.org/10.3390/app9061216
[15] Godino, C., Al-Lamee, R.A.S.H.A., Rosa, C.L., Morici, N., Latib, A., Ielasi, A., Colombo, A. (2010). Coronary left main and non‐left main bifurcation angles: how are the angles modified by different bifurcation stenting techniques? Journal of Interventional Cardiology, 23(4): 382-393. https://doi.org/10.1111/j.1540-8183.2010.00562.x
[16] Inc A. ANSYS FLUENT theory guide 2018: Release 19.1.
[17] Onuma, Y., Muller, R., Ramcharitar, S., Van Geuns, R.J., Serruys, P.W. (2008). Tryton I, First-In-Man (FIM) study: six month clinical and angiographic outcome, analysis with new quantitative coronary angiography dedicated for bifurcation lesions. EuroIntervention, 3(5): 546-552. https://doi.org/10.4244/eijv3i5a99
[18] Kadhim, S.K., Nasif, M.S., Al-Kayiem, H.H., Al-Waked, R. (2018). Computational fluid dynamics simulation of blood flow profile and shear stresses in bileaflet mechanical heart valve by using monolithic approach. Simulation, 94(2): 93-104. https://doi.org/10.1177/0037549717712603
[19] Al-Azawy, M.G., Turan, A., Revell, A.J. (2016). An Overset Mesh Approach for Valve Closure: An LVAD Application. In BIODEVICES, pp. 145-151. https://doi.org/10.5220/0005663901450151
[20] Molla, M.M., Paul, M.C. (2012). LES of non-Newtonian physiological blood flow in a model of arterial stenosis. Medical Engineering & Physics, 34(8): 1079-1087. https://doi.org/10.1016/j.medengphy.2011.11.013
[21] Carreau, P.J. (1972). Rheological equations from molecular network theories. Transactions of the Society of Rheology, 16(1): 99-127. https://doi.org/10.1122/1.549276
[22] Lu, P.C., Lai, H.C., Liu, J.S. (2001). A reevaluation and discussion on the threshold limit for hemolysis in a turbulent shear flow. Journal of Biomechanics, 34(10): 1361-1364. https://doi.org/10.1016/S0021-9290(01)00084-7
[23] Banerjee, R.K., Back, L.H., Back, M.R., Cho, Y.I. (2003). Physiological flow analysis in significant human coronary artery stenoses. Biorheology, 40(4): 451-476.
[24] Al-Azawy, M.G., Turan, A., Revell, A. (2016). Assessment of turbulence models for pulsatile flow inside a heart pump. Computer Methods in Biomechanics and Biomedical Engineering, 19(3): 271-285. https://doi.org/10.1080/10255842.2015.1015527