Bingna Lou* | Yi Liang | Xia Gao
© 2021 IIETA. This article is published by IIETA and is licensed under the CC BY 4.0 license (http://creativecommons.org/licenses/by/4.0/).
OPEN ACCESS
For tourism industry, the ever-increasing energy consumption and the high carbon emissions are requiring close attention and prompt solution, thusly endowing the research on the energy-saving of buildings in tourist resorts very important and practical significance. For this reason, this study carefully considered the actual situations such the energy utilization method and the hygrothermal environment of tourist resorts and constructed a hygrothermal transfer model and the corresponding hygrothermal balance equation for buildings in tourist resorts; then, the paper proposed a few effective strategies for the energy-saving management of buildings in tourist resorts, and studied the annual energy consumption of tourist resorts and gave a building energy consumption analysis. At last, experimental results verified the rationality and effectiveness of the proposed energy consumption assessment and energy-saving management methods for tourist resort buildings in hygrothermal environment. This study provided a useful reference for the energy-saving methods of buildings in tourist resorts.
tourist resort, hygrothermal environment, energy consumption assessment, energy-saving management
In recent years, the tourism industry in China has ushered in a speedy growth. In 2020, the revenue of tourism industry exceeded 475.2-billion-yuan, accounting for more than 7% of the total GDP, and the tourism industry has become a powerful force for the development of the national economy [1-3]. However, accompanying the booming situation, the ever-increasing energy consumption and the high carbon emissions of tourism industry have brought adverse effects on the tourist resorts, thusly endowing the research on the energy-saving of buildings in tourist resorts very important and practical significance [4-6]. Existing studies mostly focus on aspects such as the comfort of the thermal environment of tourist resort buildings, the planning of energy consumption patterns, the analysis of differences in carbon emissions during off-peak and peak seasons, and the construction of energy utilization analysis models [7-11], while the tourists’ high requirements for the hygrothermal environment of tourist resort buildings have been ignored. If we really want to achieve effective energy-saving management of buildings in tourist resorts, it’s necessary to comprehensively consider the issues of customer satisfaction and building energy consumption [12].
Research on the formation mechanism of indoor hygrothermal environment is of very important engineering application value for better realize zero energy consumption of building envelope and optimize indoor environment [13]. Johra et al. [14] constructed an indoor hygrothermal environment model which is composed of an indoor hygrothermal balance equation and a coupled façade hygrothermal transfer model, they tested the change law of indoor hygrothermal environment under different weather conditions and applied actual cases to analyze the impact of different building envelop structures on the cooling load of air conditioners, the heating load of heaters, and the indoor hygrothermal environment; then they proposed a set of indoor hygrothermal environment regulation methods that suit the load characteristics of zero energy consumption buildings. The coupled hygrothermal transfer of external facade materials have a great impact on the energy consumption of air conditioners and the indoor hygrothermal environment [15-18]. Mukai et al. [19] researched the theories of coupled hygrothermal transfer in buildings, they built an experimental platform to measure the temperature, relative humidity, and indoor and outdoor temperatures and compared the measured results with the simulation values; at the same time, they also compared the indoor temperature, relative humidity, heat flow, and humidity flow of the inner layer materials and insulation materials of buildings under natural conditions, and used the WUFI-Plus software to simulate energy consumption with humidity transfer time taken into consideration. To stabilize the humidity and indoor temperature within a comfortable range for human body, Wang et al. [20] considered the issues of power grid security and building energy conservation, and established an air conditioning energy consumption monitoring system under climatic conditions in hot and humid areas; then, for the problem of increased energy consumption caused by heat and humidity and the traditional treatment methods, they constructed a BP neural network optimized by particle swarm algorithm and accurately predicted the energy consumption of air conditioners. The coupled hygrothermal transfer process will directly affect the thermal performance of materials, the energy consumption of buildings, and the thermal comfort of the internal environment. Ozaki et al. [21] tested the basic parameters of five common building materials of rendering coat mortar, adhesive, concrete, EPS, and rock wool; the thermal conductivity of these materials were measured based on the guarded hot plate apparatus and the heat-flow meter method, and their specific heat capacity was measured using a hybrid method; moreover, they conducted pervaporation (vapor permeation) experiment to obtain the change curve of the water vapor permeability coefficient under different moisture content, and used the WUFI-Plus software to simulate the hygrothermal energy consumption of a typical city under the premise of considering the heat and moisture coupling effect of the envelope structure; their research results improved the energy efficiency of buildings and made the indoor environment more comfortable. Yan et al. [22] conducted orthogonal numerical experiments on hygrothermal environment parameters that can affect the thermal comfort of human body, such as the average radiation temperature, wind speed, humidity, and air temperature, etc., and obtained the heat balance equation of the room air and the inner surface of the envelop structure; then, based on a constructed air-conditioning system energy consumption model, they researched the change law of energy consumption under different thermal comfort index parameters, and used Matlab to solve the optimal parameter combination. In order to obtain more accurate results of the energy consumption of public buildings, Park et al. [23] investigated the energy-consuming system and equipment, the energy consumption situations, the energy structure, and the air-conditioning equipment of 15 typical buildings in a city in the three seasons of summer, autumn and winter, and calculated the energy consumption indicators and tested the indoor hygrothermal environment; their study provided a research idea for the energy conservation planning of urban public buildings and the sustainable development strategies of cities. As a new comprehensive energy-saving technology for buildings, the research on coupled hygrothermal transfer in near-zero energy consumption buildings has received wide attention. Khoukhi [24] used the WUFI-Plus software to simulate the hygrothermal energy consumption of three building materials of polyurethane, rock wool, and EPS in near-zero energy-consumption demonstration buildings in different cities, and analyzed the building energy consumption and indoor comfort based on the CTF algorithm and the HAM algorithm, and their experimental results showed that the relative humidity in each envelop structure had been significantly reduced.
To sum up current literatures we can see that the existing studies haven’t fully evaluated the structural, economical, and environmental characteristics of tourist resort buildings from the aspects of transportation, accommodation, and activities based on the actual situations of their energy utilization method and hygrothermal environment. Starting from building energy consumption, in the second part, this paper constructed a hygrothermal transfer model for tourist resort buildings and gave the corresponding boundary conditions; then, the indoor humidity balance equation and the heat balance equation were combined to establish the indoor hygrothermal balance equation of tourist resort buildings with conditions such as indoor humidity generation and indoor ventilation of the buildings taken into consideration. In the third part, this paper explored the impact of the proposed energy-saving strategies on the annual energy consumption of tourist resorts, and analyzed the energy consumption of the buildings. In the fourth part, experimental results proved the rationality and effectiveness of the energy consumption assessment and energy-saving management methods proposed in the paper. The fifth part gave the research conclusions.
The hygrothermal transfer process of tourist resort buildings has obvious coupling and complex nonlinear features. In order to reasonably reduce the solution steps of the hygrothermal transfer model and simplify the computation, this paper took temperature and water vapor pressure as the driving potentials of the hygrothermal transfer model, and made assumptions on the porous medium skeleton of the building materials, the vapor and liquid water forms, and the physical property parameters of the building materials in each direction; the study also assumed that hygrothermal transfer is affected by time and temperature, and the contact between materials of each layer is not easily affected by interference; on this basis, a hygrothermal transfer model was constructed and the boundary conditions were given.
2.1 Construction of the hygrothermal transfer model
In this study, the water vapor pressure and the liquid water pressure were selected as the driving potentials for the water vapor transfer and liquid water transfer in the construction materials of tourist resort buildings. Assume Ttm represents the total water transfer volume; Twv, Cwv, δg, Awv respectively represent the transfer volume, diffusion coefficient, gas constant, and pressure of the water vapor; Tkw, Ckw, Akw respectively represents the transfer volume, diffusion coefficient, and pressure of the liquid water; Am represents the pressure of humid air in the transfer medium; ε represents the thermodynamic temperature; Dk and J represent the water density and water permeability coefficient; then the total moisture transfer volume of building materials characterized by the sum of water vapor and liquid water transfer volumes can be expressed by Eq. (1):
${{T}_{tm}}=-\left( {{C}_{wv}}+{{J}_{kw}}\frac{{{\delta }_{g}}\varepsilon {{D}_{k}}}{{{A}_{wv}}} \right)\nabla {{A}_{wv}}=-J\nabla {{A}_{wv}}$ (1)
Assume λ represents time; v and D0 represent the moisture content and density of building materials, Eq. (2) gives the hygrothermal transfer mass-conservation equation of the building materials:
${{D}_{0}}\frac{\partial v}{\partial \tau }=-\nabla \cdot {{T}_{tm}}$ (2)
Assume Am represents the pressure of saturated water vapor, ψ represents the relative humidity of water vapor of the building materials, then there is ψ=Awv/Am; assume η is the slope of the wet balance curve of the building materials, then, with the pressure of water vapor as the driving potential, the moisture transfer equation of the building materials can be expressed by Eq. (3):
$\begin{align} & \frac{\partial {{A}_{wv}}}{\partial \lambda }=\frac{\partial {{A}_{wv}}}{\partial \nu }\frac{\partial \nu }{\partial \lambda }+\frac{\partial {{A}_{wv}}}{\partial \varepsilon }\frac{\partial \varepsilon }{\partial \lambda } \\ & =\frac{{{A}_{m}}}{\eta {{D}_{0}}}\left( -\nabla \cdot {{T}_{tm}} \right)+\left( {{A}_{m}}\frac{\partial \psi }{\partial \varepsilon }+\psi \frac{\partial {{A}_{m}}}{\partial \varepsilon } \right)\frac{\partial \varepsilon }{\partial \lambda } \\\end{align}$ (3)
According to this equation, we can know that the moisture transfer equation is the total differential of water vapor pressure with respect to time. Since the partial derivative of ψ with respect to ε is 0, by combining above equation with Eq. (1) we can get:
$\frac{\partial {{A}_{wv}}}{\partial \lambda }=\frac{{{A}_{m}}}{\eta {{D}_{0}}}\frac{\partial }{\partial y}\left( J\frac{\partial {{A}_{wv}}}{\partial y} \right)+\psi \frac{\partial {{A}_{m}}}{\partial y}\frac{\partial \varepsilon }{\partial \lambda }$ (4)
Am can be calculated by Eq. (5):
${{A}_{m}}=133{{e}^{19-\frac{3991}{\varepsilon -39}}},\varepsilon >273.15K$ (5)
${{A}_{m}}=610.8{{e}^{22-\frac{6135}{\varepsilon }}},\varepsilon \le 273.15K$ (6)
Assume hwv and hkw represent the specific heat capacities of water vapor and liquid water; gkv represents the latent heat of gas-liquid phase change; hs represents the specific heat capacity of building materials; and they satisfied hs=h0+hwvvwv+hkwvkw. Eq. (7) gives the heat transfer equation of building materials:
${{D}_{0}}{{h}_{s}}\frac{\partial \varepsilon }{\partial \lambda }=-\nabla \cdot Q-{{T}_{wv}}\nabla \cdot {{g}_{wv}}-{{T}_{kw}}\nabla \cdot {{g}_{kw}}+{{g}_{kv}}{{{m}'}_{kv}}$ (7)
According to this equation, the heat transfer of tourist resort buildings includes the phase change latent heat of water vapor and liquid water and the heat gain of sensible heat. The latter is very small compared with the former and is negligible. Therefore, the heat transfer equation can be updated as Eq. (8):
${{D}_{0}}{{h}_{s}}\frac{\partial \varepsilon }{\partial \lambda }=-\nabla \cdot Q+{{g}_{kv}}{{{m}'}_{kv}}$ (8)
Because the mass of water vapor in building materials is very small compared with the mass of liquid water, if it is ignored, then there is:
${{{m}'}_{kv}}=-\nabla .{{T}_{wv}}=\frac{\partial }{\partial y}\left( {{J}_{wv}}\frac{\partial {{A}_{wv}}}{\partial y} \right)$ (9)
Then, the heat transfer equation can be simplified as:
${{D}_{0}}{{h}_{s}}\frac{\partial \varepsilon }{\partial \lambda }=\frac{\partial }{\partial y}\left( \mu \frac{\partial \varepsilon }{\partial y} \right)+{{g}_{kv}}\frac{\partial }{\partial y}\left( {{J}_{wv}}\frac{\partial {{A}_{wv}}}{\partial y} \right)$ (10)
A simplified hygrothermal transfer model for the building materials of tourist resort buildings can be obtained by combining Eqns. (4) and (10). The boundary conditions of the hygrothermal transfer of the facades of tourist resort buildings are the third-kind boundary conditions, the temperature and humidity parameters of the internal nodes are not known, and processing is required so that the discrete equation corresponding to the nodes is in a closed state. The outdoor atmosphere will exchange moisture with the exterior facade of the buildings. Assume gso represents the convective mass transfer coefficient of the exterior facade of buildings in case that pressure of water vapor is the driving potential, then the moisture transfer equation of the building indoor and outdoor hygrothermal transfer model is:
${{T}_{wv}}+{{T}_{S-kw}}={{g}_{so}}\left( {{A}_{S-wv}}-{{A}_{O-wv}} \right)$ (11)
The outdoor atmosphere and the exterior facade of tourist resort buildings have heat exchanges caused by water phase change, and certain radiation and convection. Assume gsh and g represent the latent heat of phase change and the convective heat transfer coefficient; εS represents the surface temperature of the building façade; εI and εO represent the indoor and outdoor ambient temperature; AS-wv, AI-wv, AO-wv respectively represents the pressure of water vapor at the building façade, the indoor water vapor pressure, and the outdoor water vapor pressure; then the heat transfer equation of the façade of tourist resort buildings can be expressed as:
$Q+{{g}_{sh}}{{T}_{S-wv}}={{g}_{sh}}{{g}_{so}}\left( {{A}_{S-wv}}-{{A}_{O-wv}} \right)+g\left( {{\varepsilon }_{S}}-{{\varepsilon }_{O}} \right)$ (12)
When indoor air exchanges moisture with the inner surface of the building façade, the moisture transfer equation can be expressed by Eq. (13):
${{T}_{wv}}+{{A}_{S-wv}}={{g}_{so}}\left( {{A}_{I-wv}}-{{A}_{O-wv}} \right)$ (13)
The heat transfer equation for the heat exchange, radiation, and convection between indoor air and the inner surface of the building facade can be expressed by Eq. (14):
$Q+{{g}_{sh}}{{T}_{S\text{-}wv}}={{g}_{sh}}{{g}_{so}}\left( {{A}_{I-wv}}-{{A}_{O-wv}} \right)+g\left( {{\varepsilon }_{I}}-{{\varepsilon }_{S}} \right)$ (14)
By measuring parameters such as the altitude angle, azimuth angle between the buildings in tourist resorts and the sun, and calculating the total solar radiation on the horizontal plane, the boundary conditions of the heat gain of solar radiation could be obtained. Assume UN represents the apparent solar time, then the solar time angle θ can be calculated according to Eq. (15):
$\theta =15\times \left( UN-12 \right)$ (15)
Assume q represents the serial number of the measurement date, then the solar declination angle β can be calculated as follows:
$\beta =23.5\times sin\left( 360\times \frac{284+q}{365} \right)$ (16)
Assume j represents the sun's incident angle; φ represents the latitude of the tourist resort; α, γ respectively represents the angle between the building facade and the horizontal plane, and the sun's azimuth angle; then the cosine value cosj of the sun's incident angle can be calculated by Eq. (17):
$\begin{align} & \text{cos}j=\text{sin}\beta \left( \text{sin}\varphi \text{cos}\alpha -cos\varphi n\text{sin}\alpha \text{cos}\gamma \right)+ \\ & \text{cos}\beta \text{cos}\sigma \left( \text{cos}\varphi \text{cos}\alpha +\text{sin}\varphi \text{sin}\alpha \text{cos}\gamma \right) \\ & +\text{cos}\beta \text{sin}\alpha \text{sin}\gamma \text{sin}\sigma \\\end{align}$ (17)
Assume JRE and Jq represent the direct sunlight radiation intensity on the horizontal plane and on the normal plane perpendicular to the sunlight; and E represents the altitude angle of the sun, then JRE can be calculated by Eq (18):
${{J}_{RE}}={{J}_{q}}sinE$ (18)
JRα, the direct sunlight radiation intensity on any plane, can be calculated by Eq. (19):
${{J}_{R\alpha }}={{J}_{q}}cosj$ (19)
Assume JrE and Jrα represent the scattered sunlight radiation intensity on the horizontal plane and on any plane, then the relationship between the two can be expressed by Eq. (20):
${{J}_{r\alpha }}={{J}_{rE}}cos\frac{\alpha }{2}$ (20)
Assume JUE represents the total sunlight radiation intensity on the horizontal plane; Dw represents the reflectivity of sunlight on the underlying surface; then JDα, the radiation intensity of sunlight reflected from the underlying surface to the building facade can be calculated by Eq (21):
${{J}_{D\alpha }}={{J}_{UE}}{{D}_{w}}\left( 1-co{{s}^{2}}\frac{\alpha }{2} \right)$ (21)
Jfα, the total sunlight radiation intensity of the building façade, can be calculated by Eq. (22):
${{J}_{f\alpha }}={{J}_{R\alpha }}+{{J}_{r\alpha }}+{{J}_{D\alpha }}$ (22)
Assume Dtm represents the radiation absorption coefficient of building façade; then Qfd, the heat gain of sunlight radiation of the building facade can be expressed by Eq. (23):
${{Q}_{fd}}={{J}_{f\alpha }}\times {{D}_{tm}}$ (23)
When calculating the total sunlight radiation, the direct and the scattered radiation needs to be calculated separately. Suppose A1, A2, A13, and A4 are first-order or second-order functions of sinE, the Gompertz function model can be used to separate the direct radiation and the scattered radiation:
${{G}_{df}}={{A}_{1}}{{A}_{2}}^{-{{A}_{3}}{{A}_{2}}^{-{{A}_{4}}{{G}_{sd}}}}$ (24)
The J0·sinE dimensionless calculation of direct sunlight radiation can be performed using Eq. (25):
${{G}_{df}}=\frac{{{J}_{RF}}sinE}{{{J}_{0}}sinE}=\frac{{{J}_{RF}}}{{{J}_{0}}}$ (25)
Assume J0 is solar constant, then the index of sunny days Gsd can be calculated by Eq. (26):
${{G}_{sd}}=\frac{{{J}_{RF}}sinE+{{J}_{R\alpha }}}{{{J}_{0}}sinE}$ (26)
Correspondingly, JRF, the sunlight radiation intensity on the normal plane, can be obtained from Eq. (27):
${{J}_{RF}}={{G}_{df}}{{J}_{0}}$ (27)
2.2 Construction of the hygrothermal balance equation
Based on the law of mass conservation, this paper selected the indoor moisture generation rate within a fixed time duration, the moisture transfer change under the condition of indoor ventilation, and the per unit time moisture absorption and desorption of the building facade surface as the main influencing factors for the indoor and outdoor air humidity of buildings in tourist resorts. Assume Hj and Hl represent the indoor and outdoor air humidity of tourist resort buildings; K and ρw represent the indoor moisture generation rate and air density; Vf and I represent the room volume and the frequency of room ventilation; HS represents the indoor surface humidity of the building; under the condition that the difference in moisture content of the humid air acts as the driving potential, the convective mass transfer coefficient of the exterior facade of buildings is represented by gpo, Eq. (28) gives the indoor air humidity balance equation of the building:
$\begin{align} & \frac{d{{H}_{j}}\left( t \right)}{dt}=\frac{K\left( t \right)}{{{\rho }_{w}}\cdot {{V}_{f}}}+I\left[ {{H}_{l}}\left( t \right)-{{H}_{j}}\left( t \right) \right] \\ & +\sum\limits_{j=1}^{N}{\frac{{{g}_{po-j}}{{P}_{j}}}{{{\rho }_{w}}{{V}_{f}}}}\left[ {{H}_{S}}\left( t \right)-{{H}_{j}}\left( t \right) \right] \\\end{align}$ (28)
The relationship between the pressure of water vapor in the building and the air humidity can be described by Eq. (29) as:
$H=0.622\frac{{{A}_{wv}}}{A-{{A}_{wv}}}$ (29)
The pressure of water vapor is:
${{A}_{wv}}=\frac{H\cdot A}{0.622+H}$ (30)
The balance equation of indoor water vapor pressure for buildings in tourist resorts can be obtained by combining Eqns. (28) and (30).
The heat gain of convection and the heat gain of radiation have a large difference in the cooling load conversion speed, the conversion of the latter has some delays compared with the former. Therefore, in order to accurately calculate the indoor load, it is necessary to calculate the heat gain of convection and the heat gain of radiation separately. This paper summarized the main influencing factors of heat transfer in tourist resort buildings as the heat gain of radiation of sunlight coming from the facade and doors and windows of the buildings, the heat generated by indoor heating equipment, the heat generated by the moisture absorption and desorption of the facade, and the heat gain of convection generated by ventilation between indoor and outdoor environment. Assume gd, Sp, εs-p respectively represents the p-th building façade’s convective heat transfer coefficient, area, and the corresponding indoor wall surface temperature; εj represents the indoor air temperature. The indoor heat gain Wd(x) generated by the heat transfer of building façade with outdoor temperature and sunlight radiation can be calculated by Eq. (31):
${{W}_{d}}\left( t \right)=\sum{{{g}_{d}}}{{S}_{p}}\left[ {{\varepsilon }_{S-p}}\left( t \right)-{{\varepsilon }_{j}}\left( t \right) \right]$ (31)
Assume Pc and lc represent the area and heat transfer coefficient of the doors and windows of the buildings, then, the indoor heat gain Wc(x) generated by the heat transfer of the doors and windows of the building can be calculated by Eq. (32):
${{W}_{c}}\left( t \right)={{l}_{c}}{{P}_{c}}\left( {{\varepsilon }_{e}}\left( t \right)-{{\varepsilon }_{j}}\left( t \right) \right)$ (32)
Assume De and wdr represent the outdoor air density and constant-pressure specific heat capacity; then the indoor heat gain Wu(x) generated by the heat transfer of natural ventilation, infiltration, and other methods can be calculated by Eq. (33):
${{W}_{u}}\left( t \right)={{D}_{e}}{{w}_{dr}}{{V}_{f}}\left[ {{\varepsilon }_{e}}\left( t \right)-{{\varepsilon }_{j}}\left( t \right) \right]$ (33)
Assume K(t) represents the latent heat of evaporation, then the indoor heat gain WK(x) generated by the phase change of the indoor humid air in the building can be calculated by Eq. (34):
$\begin{align} & {{W}_{K}}\left( t \right)=\sum{K\left( t \right){{g}_{d-i}}{{P}_{i}}\left[ {{H}_{S-i}}\left( t \right)-{{H}_{j}}\left( t \right) \right]} \\ & =\sum{K\left( t \right){{g}_{d-i}}{{P}_{i}}\left[ {{A}_{Swv-i}}\left( t \right)-{{A}_{wv-j}}\left( t \right) \right]} \\\end{align}$ (34)
Assume ετ and Yd represent the transmission coefficient and effective area coefficient of the windows and doors of the building; ZK represents the shading coefficient of the building; Ym represents the actual lightening area coefficient of the sunlight entering the room through the glass windows and doors; then the heat gain Wm(x) generated by sunlight radiation can be calculated by Eq. (35):
${{W}_{m}}\left( t \right)=J\left( t \right)\cdot {{\varepsilon }_{\tau }}\cdot ZK\cdot {{Y}_{d}}\cdot {{P}_{c}}\cdot {{Y}_{m}}$ (35)
In order to accurately calculate the heat gain of radiation with its delay characteristics taken into consideration, this paper constructed the indoor heat balance equation for tourist resort buildings based on the radiation time series factor method. Assume ξq represents the proportion of heat gain of each indoor heat generation method; for time moment t, Wq(t) represents the total heat gain of the corresponding indoor heat generation method; Di represents the i-th radiation time factor, Eq. (36) gives the heat balance equation of indoor air in tourist resort buildings:
${{D}_{h}}{{Q}_{p}}{{V}_{f}}\frac{d{{\varepsilon }_{j}}\left( t \right)}{dt}=\sum\limits_{1}^{N}{\left( 1-{{\xi }_{q}} \right){{W}_{q}}\left( t \right)+\sum\limits_{i=0}^{23}{{{D}_{i}}}}{{\xi }_{i}}{{W}_{q}}\left( t-i \right)$ (36)
By combining Eqns. (28-30) and (36), the indoor humidity balance equation and the heat balance equation were combined to obtain the indoor hygrothermal balance equation.
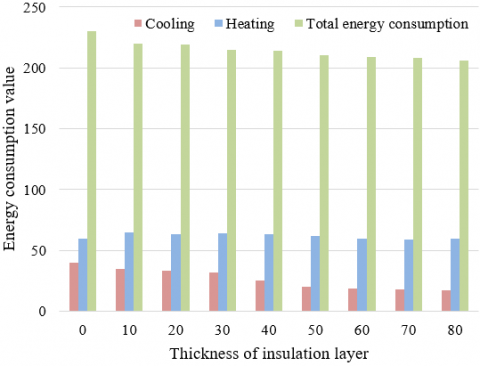
In terms of researches concerning the impact of thermal insulation layer of building façade, this paper summarized three commonly-used domestic building facade thermal insulation methods, namely the self-insulation technology of external wall, the internal thermal insulation technology of external wall, and the external thermal insulation technology of external wall. In our study, 8 sets of 10mm-80mm polystyrene insulation layers were added to the external side of the 0.3m-thickness external wall, and its impact on the annual energy consumption of the building was tested, Figure 1(a) gives the experimental results. It can be seen from the figure that the energy consumption of the building gradually decreases with the increase of the thickness of the insulation layer.
(a)
(b)
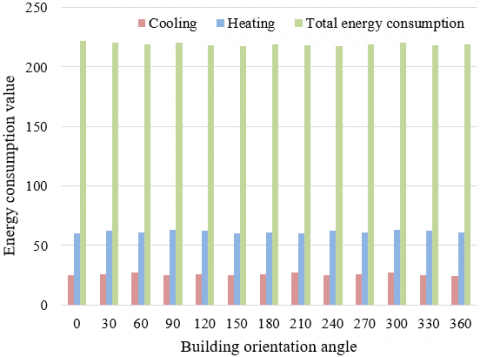
Figure 1. Impact of insulation-layer thickness and building orientation on building energy consumption
The orientation of buildings is very important to the visitors of tourist resorts. The sunlight exposure rate of the south-facing rooms and the north-facing rooms is quite different. Tourists would choose the room orientation based on the climatic conditions of the tourist resort and the architectural design of the buildings. More architects adopt the "passive building" strategies for the design of tourist resort buildings, such as setting high-low temperature buffer zones, minimizing the building shape coefficient, taking building façade thermal insulation measures, and making full use of geothermal energy and solar energy, etc. Using the eQuest3-64 software, this paper comparatively analyzed the changes in the cooling and heating energy consumption of buildings in 18 different azimuths from 0° to 360°. Figure 1(b) shows the experimental results, according to which we can see that the occupancy comfort and indoor ventilation effect are greatly affected by the orientation of the building. South-southwest 40° and 80° are building azimuth angles corresponding to the minimum and maximum building energy consumption.
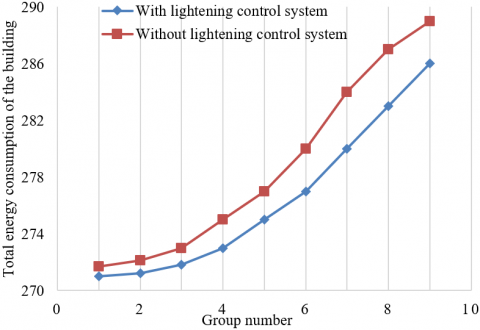
Figure 2. Change of total building energy consumption under different lighting control system settings
Figure 2 shows the change trend of total building energy consumption under different lighting control system settings. According to the figure, the better the lightening conditions of the building, the more energy saved, therefore, the window-to-wall ratio of tourist resort buildings has a great impact on indoor lighting and the energy consumption of heating and cooling equipment. Figure 3(a) gives the change of the annual energy consumption of the building under different window-to-wall ratios. It can be seen from the figure that the annual energy consumption of the tourist resort buildings increases linearly with the increase of the window-to-wall ratio, and the energy consumption values of indoor heating and cooling equipment are both increasing as well.
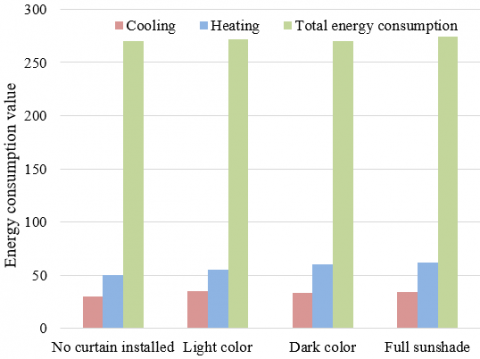
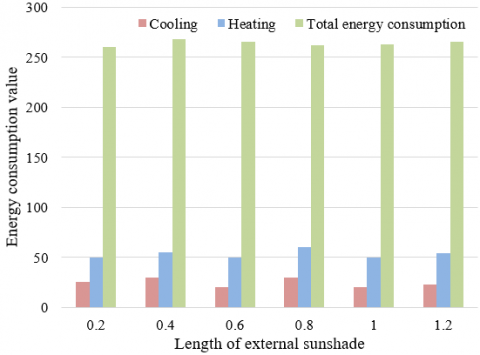
The shading method of buildings also has a great impact on energy consumption. The figure shows the comparison results of the annual energy consumption of buildings with different-type curtains. Figure 3(b) shows the comparison results of the building's annual energy consumption under different external sunshade lengths. According to the figure, curtains that can only block the light haven’t effectively reduced the heat gain of the building; the building’s annual energy consumption gradually reduces with the increase of the length of the external sunshade; but too-long external sunshade would decrease the indoor heat gain during winter, therefore, it’s necessary to reasonably design the shading method of the buildings in tourist resorts.
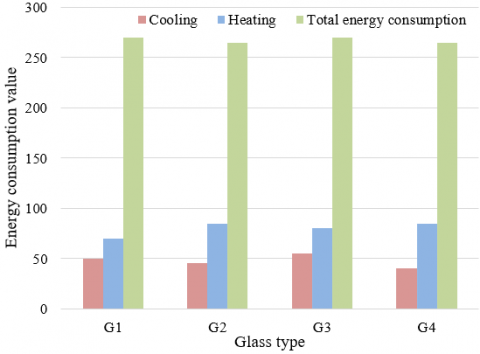
Different types of glass have different functions. Glass is used in various parts of buildings such as exterior windows, indoor screens, and glass doors, and a reasonable selection of glass types will improve the comfort of human body and enhance the energy conservation of buildings. Table 1 and Figure 4 show the energy consumption comparison of 4 types of glass. According to the table, the third type glass has the best energy-saving performance.
(a)
(b)
Figure 3. Impact of curtain type and length of external sunshade on building energy consumption
Figure 4. Impact of glass type on building energy consumption
Table 1. Building energy consumption of different-type glass
|
Glass type |
Energy consumption of heating |
Energy consumption of cooling |
Total energy consumption |
|
01 |
89.96 |
42.22 |
269.16 |
|
02 |
75.23 |
45.93 |
235.08 |
|
03 |
74.65 |
45.68 |
221.23 |
|
04 |
75.67 |
45.78 |
241.58 |
Whether tourists traveling in summer would open windows for natural ventilation and cooling down is directly related to the hygrothermal environment of the tourist resort. For buildings in tourist resorts, the effective reduction of energy consumed by air-conditioning in summer is mainly determined by two aspects: 1) by reasonably planning and scientifically transforming the structure and façade of buildings in tourist resorts, the cooling effect of natural ventilation could be enhanced; 2) using "high-quality cold resources" in summer where the tourist resort is located for cooling. In tourist resorts, the energy consumption method of winter heating is quite different from that of the cooling of air conditioners, the heating methods change greatly with the diverse heating equipment, which mainly includes electric heaters, air conditioners, and electric blankets, etc.
Based on the selection of energy types and the cost estimation of cooling and heating energy consumption, the cost of the energy consumption of tourist resort building operation can be calculated. In the building energy consumption of tourist resorts, the proportion of heating energy consumption is far greater than that of the cooling energy consumption, and this situation has resulted in that the economic cost and environmental features of heating energy consumption are higher than those of cooling energy consumption, and it’s necessary to analyze the correlations of parameters that are related to energy consumption. Suppose ka,b represents the simple correlation coefficient between parameter variables a and b; M represents the number of observed values of a and b; aj and aAV represent the j-th observed value and the average value of a; bj and bAV represent the j-th observed value and the average value of b. The ka,b of normal-distribution equal-interval measurement can be calculated using the Pearson product-moment correlation shown as Eq. (37):
${{k}_{a,b}}=\frac{\sum\limits_{j=1}^{M}{\left( {{a}_{j}}-{{a}_{AV}} \right)\left( {{b}_{j}}-{{b}_{AV}} \right)}}{\sqrt{\sum\limits_{j=1}^{M}{{{\left( {{a}_{j}}-{{a}_{AV}} \right)}^{2}}\sum\limits_{j=1}^{M}{{{\left( {{b}_{j}}-{{b}_{AV}} \right)}^{2}}}}}}$ (37)
To figure out the impact of building orientation on its energy consumption, Table 2 shows the energy consumption of 18 building orientations. According to the table, there’s a 7.3% difference between the largest energy consumption (building orientation is south-southwest 80°) and the smallest energy consumption (building orientation is south-southwest 40°); buildings of the former orientation angle have poorer lightening, less solar radiation, their cooling energy consumption is the minimum while the heating energy consumption is the maximum; on the contrary, buildings of the latter orientation angle receive more solar radiation, when their cooling energy consumption grows, the heating energy consumption decreases.
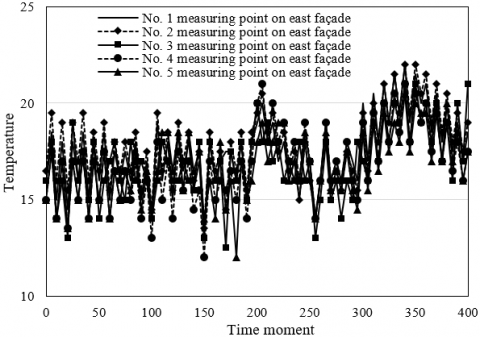
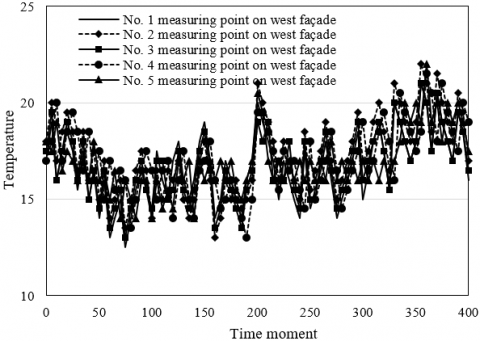
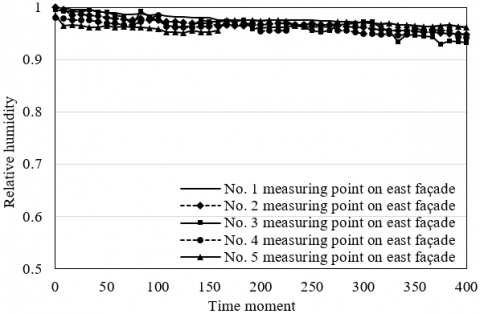
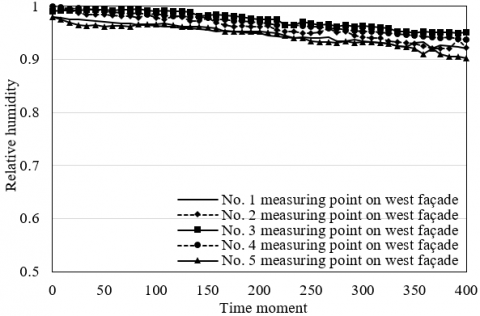
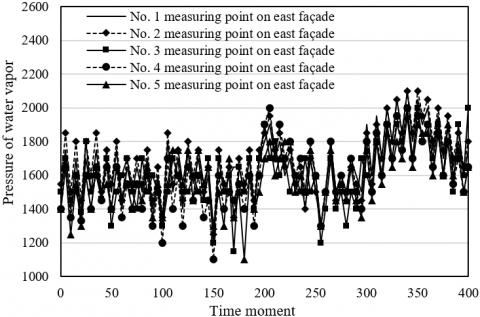
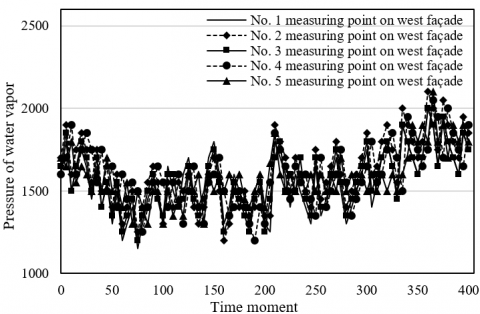
This paper measured temperature, humidity, and water vapor on the facade of tourist resort buildings. Figures 5(a) and (b) respectively show the temperature measurement results of the east and west façades; and Figures 6(a) and (b) respectively give the relative humidity measurement results of the east and west façades.
Table 2. Energy consumption of buildings in different orientations
|
Building orientation angle |
Heating energy consumption |
Cooling energy consumption |
Total energy consumption |
|
20° |
81.34 |
47.11 |
272.12 |
|
40° |
81.27 |
47.32 |
272.05 |
|
60° |
81.79 |
47.56 |
272.52 |
|
80° |
87.83 |
45.12 |
291.92 |
|
100° |
87.25 |
45.29 |
291.32 |
|
120° |
87.13 |
48.74 |
291.17 |
|
140° |
87.76 |
48.56 |
291.14 |
|
160° |
87.45 |
48.52 |
291.86 |
|
180° |
81.12 |
48.23 |
273.27 |
|
200° |
81.68 |
48.31 |
273.64 |
|
220° |
87.72 |
48.43 |
273.56 |
|
240° |
81.57 |
48.26 |
291.25 |
|
260° |
81.93 |
45.37 |
291.04 |
|
280° |
81.15 |
45.35 |
273.18 |
|
300° |
81.28 |
45.68 |
273.02 |
|
320° |
81.23 |
45.61 |
273.07 |
|
340° |
81.28 |
45.64 |
273.12 |
|
360° |
81.35 |
45.31 |
273.29 |
(a)
(b)
Figure 5. Temperature measurement results of building façades
It can be seen from Figure 5 that the temperature values on the east and west facades of the buildings both present small-range irregular periodic changes. The temperature fluctuations of the East-No.1 point and the West-No.1 point that are closest to the outdoor are the greatest since they are most affected by the outdoor temperature; on the contrary, the temperature fluctuations of the East-No.5 point and the West-No.5 point that are closest to the indoor are the smallest and present certain delays. The overall temperature change of the building façade has the same trend with the indoor and outdoor temperature changes. The above analysis results are similar to the measured results of the water vapor pressure of building façade shown in Figure 7.
(a)
(b)
Figure 6. Measured results of relative humidity of building façade
(a)
(b)
Figure 7. Measured results of water vapor pressure of building façade
(a)
(b)
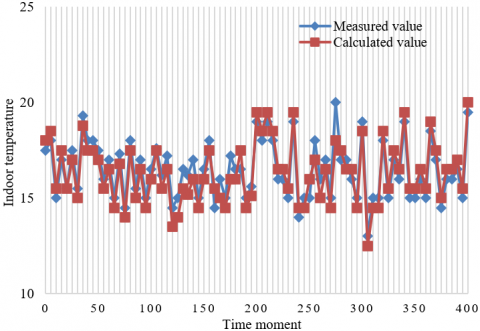
Figure 8. Comparison results of calculated and measured values of indoor temperature and relative humidity
According to Figure 6, the relative humidity values of the east and west façade of the buildings in the tourist resort are relatively high, then they show a decline trend with the increase of the measurement time. The relative humidity values of the East-No.1 point and the West-No.1 point that are closer to the outdoor and the East-No.5 point and the West-No.5 point that are closer to the indoor are relatively low.
Figure 8 shows the comparison between the calculated and measured values of indoor temperature and relative humidity. The largest error 2.03℃ between the calculated and measured indoor temperature appears in the 279th hour, and the calculation error is 12.14%. As for the relative humidity, the largest error 0.45 appears in the 165th hour, and the calculation error is 7.69%. The change trends of the two calculation curves are the same, and both are within the allowable range of construction projects.
Table 3. Correlation analysis of the impact of different heating methods on building energy consumption
|
Heating method |
HM1 |
HM2 |
HM3 |
HM4 |
HM5 |
HM6 |
|
|
HM1 |
Correlation |
1 |
/ |
/ |
/ |
/ |
/ |
|
Significance |
/ |
/ |
/ |
/ |
/ |
/ |
|
|
HM2 |
Correlation |
-0.075 |
1 |
/ |
/ |
/ |
/ |
|
Significance |
0.51 |
/ |
/ |
/ |
/ |
/ |
|
|
HM3 |
Correlation |
-0.69 |
0.151 |
1 |
/ |
/ |
/ |
|
Significance |
0.653 |
0.319 |
/ |
/ |
/ |
/ |
|
|
HM4 |
Correlation |
0.06 |
-0.058 |
-0.153 |
1 |
/ |
/ |
|
Significance |
0.91 |
0.615 |
0.181 |
/ |
/ |
/ |
|
|
HM5 |
Correlation |
-0.062 |
-0.093 |
-0.154 |
0.186 |
1 |
/ |
|
Significance |
0.523 |
0.452 |
0.236 |
0.142 |
/ |
/ |
|
|
HM6 |
Correlation |
-0.058 |
-0.077 |
-0.094 |
-0.092 |
-0.097 |
1 |
|
Significance |
0.637 |
0.523 |
0.435 |
0.458 |
0.483 |
/ |
|
|
HM1 |
Correlation |
-0.06 |
0.238 |
0.212 |
0.317 |
0.856 |
-0.112 |
|
Significance |
0.916 |
0.059 |
0.083 |
0.042 |
0.00 |
0.279 |
|
With heating energy consumption as the example, SPSS was used to analyze the correlation and significance of the impact of heating method on building energy consumption. Table 3 shows the analysis results of six heating methods: electric energy, liquefied gas, natural gas, firewood, coal, and clean oil. According to the table, when the energy consumption of a single heating method is taken as the dependent variable, the energy consumption of other heating methods has no obvious correlation with it, indicating that the energy consumption structure of buildings in the tourist resorts is relatively simple. However, according to the estimation of the cost of cooling and heating energy consumption and the cost of energy consumption of tourist resort building operation, the costs of the natural-gas heating method and the electric heating method account for more than 15% and 67% of the cost of total energy consumption, and the cost of cooling energy consumption accounts for about 21% of the total energy consumption. The energy consumption proportions of other heating methods are relatively small, and their impact on the cost of total energy consumption is litter.
This paper proposed a novel energy consumption assessment and energy-saving management method for buildings in tourist resorts in hygrothermal environment. Starting from the energy consumption of buildings, this paper first constructed a hygrothermal transfer model for tourist resort buildings and gave the corresponding boundary conditions; then, with conditions such as indoor moisture generation and indoor ventilation of the buildings taken into consideration, this paper combined the indoor humidity balance equation with the heat balance equation to establish the indoor hygrothermal balance equation for tourist resort buildings; after that, this paper proposed effective energy-saving strategies and analyzed their impact on the annual energy consumption of tourist resorts and the energy consumption of buildings; later on, related experiments were designed, and the temperature, humidity, and water vapor of the façade of buildings in tourist resorts were measured; at last, the SPSS software was used to analyze the correlation and significance of the impact of heating method on the energy consumption of buildings, and the experimental results had verified the rationality and effectiveness of the proposed energy consumption assessment and energy-saving management method.
[1] Karpov, D., Pavlov, M., Salikhova, R. (2020). Determination of surface temperature and moisture fields of structural elements of buildings by thermal imaging. International Conference Sustainable Energy Systems: Innovative Perspectives, Saint-Petersburg, Russia, pp. 253-258. https://doi.org/10.1007/978-3-030-67654-4_28
[2] Boukhattem, L., Boumhaout, M., Hamdi, H., Benhamou, B., Nouh, F.A. (2017). Moisture content influence on the thermal conductivity of insulating building materials made from date palm fibers mesh. Construction and Building Materials, 148: 811-823. https://doi.org/10.1016/j.conbuildmat.2017.05.020
[3] Kontoleon, K.J., Giarma, C. (2016). Dynamic thermal response of building material layers in aspect of their moisture content. Applied Energy, 170: 76-91. https://doi.org/10.1016/j.apenergy.2016.01.106
[4] Qin, M., Yang, J. (2016). Evaluation of different thermal models in EnergyPlus for calculating moisture effects on building energy consumption in different climate conditions. Building Simulation, 9(1): 15-25. https://doi.org/10.1007/s12273-015-0263-2
[5] Kumaran, M.K. (2006). A Thermal and Moisture Property Database for Common Building and Insulation Materials. ASHRAE Transactions, 112(2): 485-497.
[6] Dariusz, G., Kosny, J., Desjarlais, A. (2000). Effect of moisture on thermal performance and energy efficiency of buildings with lightweight concrete walls. Proceedings ACEEE Summer Study on Energy Efficiency in Buildings (3): 3149-3160.
[7] Katsman, R., Becker, R. (2000). Model for moisture-content evolution in porous building elements with hygro-thermal bridges and air-voids. Journal of Thermal Envelope and Building Science, 24(1): 10-41. https://doi.org/10.1177/109719630002400102
[8] Pihelo, P., Kalamees, T. (2016). The effect of thermal transmittance of building envelope and material selection of wind barrier on moisture safety of timber frame exterior wall. Journal of Building Engineering, 6: 29-38. https://doi.org/10.1016/j.jobe.2016.02.002
[9] Schulle, W. (1994). Influence of moisture content in ceramic building materials on the thermal insulation behavior. Keramische Zeitschrift, 46: 7-9.
[10] Yang, J., Fu, H., Qin, M. (2015). Evaluation of different thermal models in EnergyPlus for calculating moisture effects on building energy consumption in different climate conditions. Procedia Engineering, 121: 1635-1641. https://doi.org/10.1016/j.proeng.2015.09.194
[11] Li, N., Li, B., Yu, W., Wang, C. (2010). Building energy efficiency from residential thermal and moisture status in the Yangtze River Basin. 2010 International Conference on E-Product E-Service and E-Entertainment, Henan, China, pp. 1-4. https://doi.org/10.1109/ICEEE.2010.5660453
[12] Totten, P.E., Pazera, M. (2010). Thermal inefficiencies in building enclosures-causes of moisture related performance problems. Forensic Engineering 2009: Pathology of the Built Environment, pp. 43-54. https://doi.org/10.1061/41082(362)5
[13] Kic, P. (2017). Influence of moisture on thermal properties of walls in basements of buildings. In Proceedings of the Engineering for Rural Development-International Scientific Conference, Jelgava, Latvia, pp. 24-26. https://doi.org/10.22616/ERDev2017.16.N096
[14] Johra, H., Margheritini, L., Antonov, Y.I., Frandsen, K.M., Simonsen, M.E., Møldrup, P., Jensen, R.L. (2021). Thermal, moisture and mechanical properties of Seacrete: A sustainable sea-grown building material. Construction and Building Materials, 266: 121025. https://doi.org/10.1016/j.conbuildmat.2020.121025
[15] Abdellatef, Y., Khan, M.A., Khan, A., Alam, M.I., Kavgic, M. (2020). Mechanical, thermal, and moisture buffering properties of novel insulating hemp-lime composite building materials. Materials, 13(21): 5000. https://doi.org/10.3390/ma13215000
[16] Liu, X., Chen, Y., Ge, H., Fazio, P., Chen, G. (2015). Numerical investigation for thermal performance of exterior walls of residential buildings with moisture transfer in hot summer and cold winter zone of China. Energy and Buildings, 93: 259-268. https://doi.org/10.1016/j.enbuild.2015.02.016
[17] Vitiello, V., Castelluccio, R., Merino, M.D.R. (2020). Experimental research to evaluate the percentage change of thermal and mechanical performances of bricks in historical buildings due to moisture. Construction and Building Materials, 244: 118107. https://doi.org/10.1016/j.conbuildmat.2020.118107
[18] Cai, S., Zhang, B., Cremaschi, L. (2017). Review of moisture behavior and thermal performance of polystyrene insulation in building applications. Building and Environment, 123: 50-65. https://doi.org/10.1016/j.buildenv.2017.06.034
[19] Mukai, K., Hokoi, S., Kominami, K., Abuku, M., Suzuki, H., Iba, C. (2008). Thermal and moisture characteriscis in insulated wall of conventional wooden house: simulation of full-scale insulated wall experiment with airflow in porous building elements. Journal of Environmental Engineering (transaction of AIJ), 73(623): 17-22.
[20] Wang, Y., Zhao, Z., Liu, Y., Wang, D., Ma, C., Liu, J. (2019). Comprehensive correction of thermal conductivity of moist porous building materials with static moisture distribution and moisture transfer. Energy, 176: 103-118. https://doi.org/10.1016/j.energy.2019.03.178
[21] Ozaki, A., Lee, M., Kuma, Y. (2013). Prediction of sensory index under non-uniform thermal environment based on heat and moisture transfer and airflow of whole buildings. 13th Conference of International Building Performance Simulation Association, Chambéry, France, 26-28.
[22] Yan, Z., Lam, J.C., Liu, J. (2005). Experimental studies on the thermal and moisture properties of rammed earth used in adobe buildings in China. Architectural Science Review, 48(1): 55-60. https://doi.org/10.3763/asre.2005.4808
[23] Park, J.H., Kang, Y., Lee, J., Chang, S.J., Wi, S., Kim, S. (2019). Development of wood-lime boards as building materials improving thermal and moisture performance based on hygrothermal behavior evaluation. Construction and Building Materials, 204: 576-585. https://doi.org/10.1016/j.conbuildmat.2019.01.139
[24] Khoukhi, M. (2018). The combined effect of heat and moisture transfer dependent thermal conductivity of polystyrene insulation material: Impact on building energy performance. Energy and Buildings, 169: 228-235. https://doi.org/10.1016/j.enbuild.2018.03.055