Rong Chen | Yu Ai | Tianshun Zhang | Yue Rao | Hanhong Yue | Jiaxin Zheng*
© 2019 IIETA. This article is published by IIETA and is licensed under the CC BY 4.0 license (http://creativecommons.org/licenses/by/4.0/).
OPEN ACCESS
According to computational fluid dynamics, heat transfer theory, and chemical reaction kinetics theory, the models of single-pellet biomass combustion were established, flow, heat transfer and mass transfer of single-particle biomass fuel during combustion were analog calculated, and they showed about 2 min, a 2 cm biomass pellet fuel completely burnt out , the highest temperature is 1280 k, the release of gases such as H2O, CO2 and CO. The bed combustion model of biomass chain furnace was built based on the single particle fuel combustion model means the bed combustion process of biomass particles is in good agreement with the actual combustion process. This study provides a theoretical basis for the whole biomass briquette boiler system design and performance optimization and improvement.
numerical simulation, biomass combustion, biomass, thermogravimetric analysis
Research on biomass energy has been progressing rapidly and brought about great achievements in direct combustion, pyrolysis, gasification, liquefaction and fermentation techniques [1, 2]. The densely-molded biomass direct burning and use technology has attracted extensive attention [3] and has also been studied in China [4, 5]. However, the majority of relevant studies in China are still at the exploratory stage and ignore the development of corresponding combustion equipment. So far, the operation of the existing biomass pellet combustion equipment and combustion technology is restricted by several problems:
(1) combustion instability, low combustion efficiency, presence of abundant particulate matter and CO in gases [6, 7]; (2) high exhaust temperature, severe heat loss; (3) high dust content in smoke, risk of environmental pollution; (4) large excessive air coefficient, high power consumption by air blower; (5) low combustion effect and heavy agglomeration and slagging [8, 9]. These problems have not been solved mainly due to the inadequate understanding about the theories of biomass combustion and the combustion process. Thus, correctly understanding the theories and process of biomass pellet combustion will significantly guide the research on direct combustion techniques and the development and improvement of combustion equipment [10, 11].
Two types of spherical biomass pellets (diameter = 2 cm) which were produced by crushing, mixing and compressing straws and sawdust, respectively in a company in Kunming, China were selected. The biomass pellets were characterized by small volumes, large weights, fire resistance, and convenience for storage and transport. Specifically, their volumes are only 1/30 that of the original materials, the density is 1.1-1.4 t/m3 [12], and heat value is 17162±419 kJ/kg. Proximate analysis and ultimate analysis of the biomass pellets were tested on a 5E-MAC III infrared rapid coal quality analyzer (Table 1).
Table 1. Proximate analysis and ultimate analysis of the biomass pellets (%)
|
Sample |
Mad |
Vad |
Aad |
FCad |
Cad |
Had |
Nad |
Oad |
Sad |
Qnet,ad (kJ/kg) |
|
Straws |
4.87 |
65.31 |
13.96 |
15.76 |
35.14 |
5.10 |
0.85 |
33.95 |
0.11 |
13980 |
|
Sawdust |
9.87 |
70.45 |
3.22 |
16.45 |
45.55 |
4.48 |
0.136 |
35.86 |
0.08 |
18064 |
2.1 Effects of volatiles, water and ashes on combustion characteristics
The volatiles and heat value of biomass pellets largely affect the ignition and combustion. The initial temperature of volatile release from high-heat-value biomass is also very high [13,14]. Under the heat action, the water inside the biomass pellets is evaporated from the surfaces, while the volatile combustible gases are decomposed and released. When the volatiles on pellet surfaces reach a certain concentration and approach the appropriate gas, the pellets will be burnt at a certain temperature. If the water content is larger, the amount of combustible matter resulting from the biomass pellets as well as the heat value decreases. A higher water content further complicates the combustion and decelerates the burning rate. Ash is a harmful component that reduces the calorific value of biomass and easily causes incomplete combustion, and the accumulation of ash, residues and corrosion further complicates the equipment maintenance and operation. The sawdust contained very high volatile content, low water content less than 10%, and low ash content, which accounted for the high heat value, easy ignition and combustion stability (Table 1). In comparison, the straws containing low heat value were featured by difficult ignition and unstable combustion [15]. Thus, higher volatile content and lower water and ash contents of biomass pellets resulted in the higher heat value, easier ignition and more stable combustion.
2.2 Effects of ignition index and combustion characteristic index on ignition
The ignition index FZ is defined under the hypothesis of heterogeneous coke ignition [16]:
$F Z=\left(V_{a d}+M_{a d}\right)^{2} \times F C_{a d} \times 100$ (1)
where, Vad, Mad and FCad are the volatile content, moisture content and fixed carbon all of air dried basis, respectively. A larger FZ indicates a better ignition performance. ZM is the combustion characteristic index defined as follows [17]:
$Z M=\frac{V_{a d}+M_{a d}}{F C_{a d}} \times 100$ (2)
A larger ZM indicates a better combustion performance. The FZ and ZM of straw or sawdust pellets were calculated (Table 2). Clearly, the straws were harder to ignite and had higher ignition temperature and lower combustion performance compared with the sawdust (Table 2).
Table 2. FZ and ZM of straw and sawdust
|
Sample |
FZ |
ZM |
|
Straw |
7.76 |
445.30 |
|
sawdust |
10.61 |
488.26 |
The FZ and ZM emphasize the positive influence of volatile matter and water analysis on the combustion process of biomass pellets, but the difference is that the fixed carbon content affects the combustion process. FM indicates that voids are formed in carbon after the precipitation of volatile matter and internal moisture. The larger (Vad+Mad) means the larger specific surface area and the stronger activity of carbon. The effect of the internal moisture and volatile matter precipitation on the ignition is the same as that of carbon, and the effect of (Vad+Mad) on ignition is more significant than that of Cad. According to ZM, the fixed carbon content negatively influences the ignition temperature. The main influence factors on the ignition of biomass pellets are inner surface area and inner pore morphology. Although the internal moisture is not combustible, the internal moisture release forms voids inside the biomass pellets, which is conducive to the release of volatiles and ignition. The ZM is closer to the reality due to the high volatile content and low fixed carbon content in the biomass.
2.3 Thermogravimetric (TG) analysis of combustion
TG analysis of straw and sawdust pellets was conducted on an STA449F3 TG analyzer (Netzsch, Germany). TG, derivative thermogravimetric (DTG) and differential scanning calorimetry (DSC) curves were determined from the TG experiments of straw and sawdust. The reaction gas was air at flow rate 50 mL·min-1, and the protection gas was argon gas. The heating rate was 10 ºC·min-1 to the target of 900 ºC, and the dosage of samples was 10 mg.
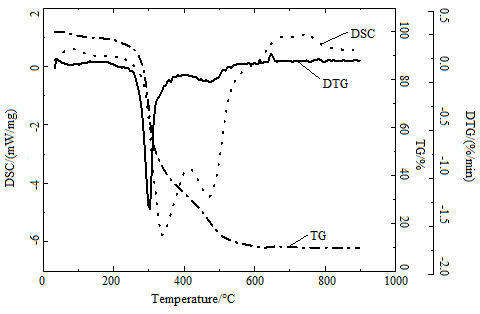
Figure 1. Thermogravimetric analysis curves of straw combustion
Figure 1 shows the TG curve of straw. During the burning process of straw, two distinct peaks appeared in the DTG curve. The maximum weight loss peak appeared at 220 -320 °C, mainly due to the large amount of volatile matter being precipitated and burned. The second, relatively flat peak appeared at 410-500 °C, mainly for the combustion of carbon. The first exothermic peak appeared at 320-380 °C in the DSC curve, mainly due to the large amount of heat generated by the volatiles. An endothermic peak appears at 380-450 °C because the conversion of lignin into biomass carbon is an endothermic process, and the heat released by the volatile combustion has not yet reached the heat demand for the conversion of lignin into biomass carbon and combustion. A second exothermic peak appears at 450-500 °C because of the carbon combustion exotherm. The DSC curve changes exactly coincide with the TG curve and the DTG curve.
Figure 2. Thermogravimetric analysis curves of sawdust combustion
Figure 2 shows the TG curve of wood chips. The first weight loss peak appeared at 210-340 °C, which was volatile release and burning. The second peak appears at 380-410°C for a violent burning of carbon. The DSC curve of sawdust is roughly the same as that of straw, there are two exothermic peaks and one endothermic peak, but the peak is relatively flat, which is caused by the high volatile and fixed carbon content in wood chips.
The changing trends of weight loss and weight loss rate along with temperature were consistent between the two types of pellets (Figure 1, 2). The whole combustion process can be divided into four stages: drying stage, volatile separation & combustion stage [18], fixed carbon combustion stage, and ash formation stage [19].
It is in the drying stage before the first DTG weight loss peak appeared, the temperature of the TG curve was relatively flat due to the low temperature, the water is evaporating in the fuel. In the DTG curve, the first weight loss peak interval is the volatile release and combustion stage, which is mainly the combustion reaction and most combustibles consumption. The weight loss rate at this stage was about 50%. DTG curves showed the weight loss increased rapidly and maximized, indicating a large amount of volatiles was separated out, ignited and burnt. In the second weight loss peak is a fixed carbon combustion stage. The TG curve declines more gently in this stage. Above 800°C, the curve is the ash formation stage, the combustibles were basically burnt out, and the resulting ash shells gradually accumulated and thickened, forming integral ash balls, which accounted for 3% - 15% of total weight. The ash proportions were consistent with the proximate analysis.
However, these four stages mutually intersected without obvious boundaries. DTG curves showed two evident weight loss peaks, which corresponded to volatile combustion and fixed carbon combustion, respectively. Since the peak of DTG curves represented the maximum combustion rate, the pellets showing a more evident weight loss peak at the volatile stage were more ignitable and combustible.
3.1 Mathematical modeling
The TG results showed the biomass pellets were first heated in a high-temperature condition, and then water was separated out at the balanced temperature. With further temperature rise, the subsequent processes were volatile separation & combustion, coke combustion, and ash residue formation [20, 21]. Then the flows, heat transfer, mass transfer, and pellet structural changes in the above four stages were analyzed. On this basis, a 2D general model underlying single-pellet biomass pellet combustion was built by using the theories of computational fluid dynamics, heat transfer and chemical reaction kinetics.
Before the modeling, three hypotheses were made: (1) the biomass pellets were equal-diameter spheres throughout the combustion; (2) the heat exchange between pellets and the gas phase was heat convection; (3) water, volatiles, coke and ashes were all uniformly distributed inside the pellets.
3.1.1 Basic equations
The transfer processes of biomass pellet combustion should meet the continuous, momentum, energy and component transfer control equations. The basic conservation equations are as follows [22, 23]:
Continuous equation:
$\frac{\partial \rho}{\partial t}+\frac{\partial}{\partial x_{j}}\left(\rho u_{g, j}\right)=0$ (3)
where, ρ is the flow density; t is time; xj is the j-dimensional coordinate; ug,jis the velocity vector.
Momentum equation:
$\frac{\partial}{\partial t}\left(\rho u_{i}\right)+\frac{\partial}{\partial x_{j}}\left(\rho u_{j} u_{i}\right)=\frac{\partial}{\partial x_{j}} \tau_{j i}+f_{i}$ (4)
where, τji is the surface component of fluid force at the i-the direction, or namely the generalized Newton viscous stress; fi is the fluid volume force at the i-the direction.
Energy equation:
$\frac{\partial}{\partial t}(\rho H)+\frac{\partial}{\partial x_{j}}\left(\rho u_{j} H\right)=\frac{\partial}{\partial x_{j}}\left(\Gamma_{h} \frac{\partial}{\partial x_{j}} H\right)+\frac{\partial p}{\partial t}+S_{h}$ (5)
where, H is the total heat enthalpy of the fluid; ui is velocity vector at the i-the direction; Γh is the heat transfer coefficient; ρ is the fluid pressure; Sh is the heat source and radiation heat transfer inside the fluid.
Component transfer equation:
$\frac{\partial \rho Y_{i}}{\partial t}+\frac{\partial}{\partial x_{j}}\left(\rho u_{j} Y_{i}\right)=\frac{\partial}{\partial x_{j}}\left(\Gamma_{i} \frac{\partial}{\partial x_{j}} Y_{i}\right)+R_{i}+S_{i}$ (6)
where, Γi is the mass transfer coefficient of component i, Yiis the mass fraction of component i, Ri is the generation rate or consumption rate of component i, Si is the item of sources, including the production rate of component i introduced by the disperse item.
3.1.2 Solid-phase and gas-phase physiochemical models
The physiochemical processes of biomass pellet combustion mainly include water evaporation, volatile separation & combustion, and coke combustion. These three stages are not obviously isolated and usually appear in the order of water evaporation, volatile separation & combustion, and coke combustion & gasification.
(1) Water evaporation
After the biomass pellets were heated, the water was first separated out. The water evaporation rate can be expressed as [24]:
$R_{\text {water}}=\left\{\begin{array}{ll}{S_{a} \cdot D_{m}\left(C_{w, s}-C_{w, g}\right)} & {T_{n}<100^{\circ} C} \\ {Q / H_{e v p}} & {T_{n}>100^{\circ} C}\end{array}\right.$ (7)
When the surface layer temperature of the biomass is <100°C, the water is not fully separated and is controlled by the mass transfer [25]:
$R_{\text {water}}=S_{a} \cdot D_{m}\left(C_{w, s}-C_{w, g}\right)$ (8)
where, Cw,sand Cw,g are the vapor densities in the solid-phase surface layer and the gas phase, respectively; $C_{w, s}=\frac{p_{s a t}\left(T_{n}\right) M_{H_{2} O}}{R T_{s}}$, psat(Tn) is the vapor saturated pressure at the surface layer temperature Tn of the pellets; Cw,g=ρgYH2O; Dm is the surface mass transfer coefficient of pellets, m/s, and can be calculated from the dimensionless association when the gas cross-flows the spheres.
The Sherwood number of single spheres Shs=2.0+1.1Re0.6Sc1/3, relative to the Sherwood number of multiple pellets on the lower layer, should be modified as follows: Sh=fShs=[1+1.5(1-ε)]Shs, Reynolds number Re=ρgUmagd/μ, and Schmidt number $S c=\frac{\mu}{\rho_{g} D_{H_{2} O}}$. Thereby, we have Dm=DH2OSh/d, where DH2O is the diffusion coefficient of vapor.
When the surface temperature of biomass pellets is ≥100 ℃, the pellets directly absorbed heat, so the water is separated out, and the water evaporation rate is decided by the heat transfer speed:
$R_{\text {water}}=Q / H_{\text {evp}}$ (9)
where, Q is the heat absorption of pellets; Q =Sa(h¢(Tg-Ts)+esb(T4 env-T4 s)); Hevp is the latent heat of water evaporation.
(2) Volatile separation and combustion
When the temperature of pellets reached a certain level, the volatiles are separated out and burnt, which result in coke and ashes. The volatile separation rate is calculated by a first-order model and is assumed to be proportional to the residual volatile content:
$R_{v o l}=k \rho_{s} Y_{v o l}$ (10)
where, k is the speed coefficient, Tsis the pellet temperature; Yvol is the instant mass fraction of volatiles.
The volatile separation and combustion rate are [26, 27]:
$R_{m i x}=0.35\left[\begin{array}{c}{150 \frac{D_{8}(1-\varepsilon)^{2 / 3}}{d^{2} \varepsilon}+} \\ {1.75 \frac{U_{g}(1-\varepsilon)^{1 / 3}}{d \varepsilon}}\end{array}\right] \mathrm{m}$ in $\left(\frac{C_{f u e l}}{\Omega_{f u e l}}, \frac{C_{o x}}{\Omega_{o x}}\right)$ (11)
where, Dg is the diffusion coefficient of volatile gas; ε is the pellet porosity; C is the matter concentration; Ω is the reaction equivalent coefficient; the subscripts fuel and ox represent the pellet fuels and the oxidizer, respectively.
Like the EBU-Arrhenius model [28], the minimum value between Arrhennius speed and the gas mixing rate is the homogeneous combustion rate of volatiles:
$R=\min \left(R_{l a m}, R_{m i x}\right)$ (12)
where, Rlam is the laminar flow reaction rate, or namely the speed determined from the Arrhenius equation:
$R_{l a m}=\Omega\left(k \prod_{j=1}^{N}\left[C_{j}\right]^{\eta_{i}}\right)$ (13)
where, Cj is the concentration of material j, and ηj is the concentration index. β is the temperature index, A is the pre-exponential factor, E is the activation energy, k is the reaction rate constant or namely $k=A T_{g}^{\beta} \exp \left(-\frac{E}{R T_{g}}\right)$, where R is the general gas constant.
The gas homogeneous combustion reaction and the laminar flow reaction rate R [29, 30]:
a. $C H_{4}+2 O_{2} \rightarrow C O_{2}+2 H_{2} O(g)$ (14)
$R_{1}=1.58 \times 10^{13}\left[\mathrm{CH}_{4}\right]^{0.7}\left[\mathrm{O}_{2}\right]^{0.8} \exp (-24343 / T)$
b. $C O+0.5 O_{2} \rightarrow C O_{2}$ (15)
$R_{3}=2.239 \times 10^{12}[\mathrm{CO}]\left[\mathrm{O}_{2}\right]^{0.25}\left[\mathrm{H}_{2} \mathrm{O}\right]^{-0.5} \exp (-20446 / T)$
(3) Coke combustion
After the volatiles are burnt out, the temperature further rose, and then the coke combustion started. The oxidation of coke and oxygen is:
$C+\frac{1}{\alpha} O_{2} \rightarrow \frac{2(\alpha-1)}{\alpha} C O+\frac{2-\alpha}{\alpha} C O_{2}$ (16)
The reaction process is: oxygen passed through the gas film on surface of the pellets and the ash shell on surfaces of the carbon core, and reacted with the inner carbon core at high temperature. It is indicated the reaction temperature, gas film resistance and the ash layer diffusion resistance will affect the whole reaction process and also decide the combustion reaction rate.
Coke combustion rate is:
$R=\frac{M_{c h a r} \alpha S}{M_{o_{2}}} \rho_{g} Y_{O_{2}} \frac{1}{k_{r}^{-1}+k_{m}^{-1}}$ (17)
where,
$k_{r}=A T_{s} \exp \left(-\frac{E}{R T_{s}}\right)$ (18)
A=2.02, E=8640, and km can be determined from the association equation of pellet mass transfer. Firstly, the Sherwood number of single-pellet spheres is determined:
$S h_{s}=2.0+1.1 \mathrm{R} \mathrm{e}^{0.6} \mathrm{Sc}^{1 / 3}$ (19)
where, Sc and Re are the Schmidt number and Reynolds number of pellet diameter, respectively. However, the Sherwood number of multiple pellets on the bed should be modified to Sh=f×Shs, and the correction coefficient f is f=1+1.5(1-ε).
3.1.3 Multi -pellet material layer combustion model
Solid phase continuity equation:
$\frac{\partial \rho_{s}}{\partial t}+\frac{\partial}{\partial x_{j}}\left(\rho_{s} u_{s, j}\right)=-S_{s}$ (20)
ρs is solid density, -Ss is Loss of solid phase mass during combustion of biomass briquette, us,j is solid phase apparent velocity in direction
Solid phase composition equation:
$\frac{\partial \rho_{s} Y_{s, i}}{\partial t}+\frac{\partial}{\partial x_{j}}\left(\rho_{s} u_{s, j} Y_{s, i}\right)=\frac{\partial}{\partial x_{j}}\left(D_{s, e f f} \frac{\partial\left(\rho_{s} Y_{s, i}\right)}{\partial x}\right)-M_{s, i}$ (21)
-Ms,iis mass of gas solid heterogeneous reaction into gas phase component I, Ds,eff is mass diffusion coefficient, Ys,i is mass fraction of moisture, volatiles and coke.
Solid energy equation:
$\frac{\partial \rho_{s} \bar{C}_{p, s} T_{s}}{\partial t}+\frac{\partial}{\partial x_{j}}\left(\rho_{s} u_{s, j} \bar{C}_{p, s} T_{s}\right)=$
$\frac{\partial}{\partial x_{j}}\left(\lambda_{s, e f f} \frac{\partial T_{s}}{\partial x_{j}}\right)-S_{a} h_{s}^{\prime}\left(T_{s}-T_{g}\right)+\sum \Delta H_{k}$ (22)
where the first item on the right side is the solid-phase heat conduction quantity; the second item is the gas-solid convective heat transfer quantity; the third item is the solid-phase heat quantity from the gas-solid heterogeneous reaction and gas homogeneous reaction; $\bar{C}_{p,s}$ is the average solid specific heat, λs,eff is the efficient thermal conductivity of solids.
Gas phase composition equation:
$\frac{\partial}{\partial t}\left(\phi \rho_{g} Y_{g, j}\right)+\frac{\partial}{\partial x_{j}}\left(\phi \rho_{g} u_{j} Y_{j}\right)=$
$\frac{\partial}{\partial x_{j}}\left(D_{g, e f f} \frac{\partial\left(\phi \rho_{g} Y_{j}\right)}{\partial x_{j}}\right)+M_{s, j}+M_{g, j}$ (23)
Yg,j is mass fraction of gas component j, include CH4, CO2, CO, H2O, O2, H2 and so on, Ms,j and Mg,j is the mass of component H produced by gas homogeneous reaction and gas solid heterogeneous reaction respectively, Dg,eff is effective diffusion coefficient, Dg,eff=Dg+0.5d|Ug|, Dg is Gas molecular diffusivity.
Gas phase continuity equation:
$\frac{\partial\left(\phi \rho_{g}\right)}{\partial t}+\phi \rho_{g} \frac{\partial u_{j}}{\partial x_{j}}=S_{g}$ (24)
ρg is Gas density, Sg means the gas mass from biomass briquette combustion, uj is velocity in direction.
Momentum equation of the gas phase:
$\frac{\partial\left(\phi \rho_{g} u_{j}\right)}{\partial t}+\frac{\partial\left(\rho_{g} u_{j} u_{i}\right)}{\partial x_{j}}=-\frac{\partial p_{g}}{\partial x_{j}}+S$ (25)
S is Source term.
Gas phase energy equation:
$\frac{\partial\left(\phi \rho_{g} \bar{C}_{p, g} T_{g}\right)}{\partial t}+\frac{\partial}{\partial x_{j}}\left(\phi \rho_{g} u_{g} \bar{C}_{p, g} T_{g}\right)=$
$\frac{\partial}{\partial x_{j}}\left(\lambda_{g, e f f} \frac{\partial T_{g}}{\partial x_{j}}\right)-S_{a} h_{s, g}\left(T_{s}-T_{g}\right)+\sum \Delta H_{k}$ (26)
where, λs,eff is the efficient thermal conductivity; the first item on the right side is the gas-phase heat conduction quantity; the second item is the gas-solid convective heat transfer quantity; the third item is the solid-phase heat quantity from the gas-solid heterogeneous reaction and gas homogeneous reaction.
3.2 Combustion process simulation
Then the combustion process of single-pellet biomass was simulated on FLUENT. The spherical sawdust pellets used here were in size of 2 cm, density of 919 kg/m3, lower heating value of 18064 kJ/kg, water content of 7%. In brief, the pellets were put into a reactor, and then were mixed and burnt with the air blown in from the bottom. Then the flow, heat transfer and mass transfer of pellet combustion were simulated. The boundary conditions during the computation were set as follows: (1) the bottom of the reactor was the air velocity inlet boundary, and the air temperature, speed and composition were preset; (2) the left and right walls of the reactor were slipless and insulated boundaries; (3) the top boundaries of the reactor were the pressure outlet, where the relative pressure was 0 Pa.
Figure 3. Comparison of simulated and experimental TG curves
The combustion of single-pellet spherical biomass fuel was simulated. The TG curves from computation and experiments were compared in Figure 3. The experimental curves and the computation were very consistent. The TG combustion curve showed a deviation of ~ 5% between the experimental data and the simulation results.
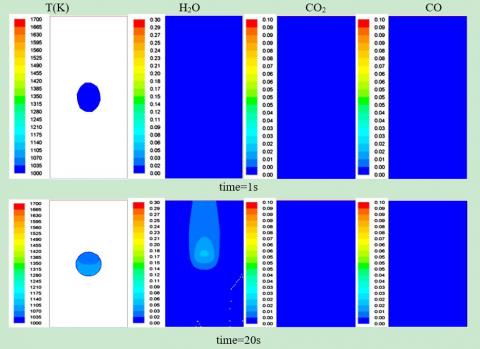
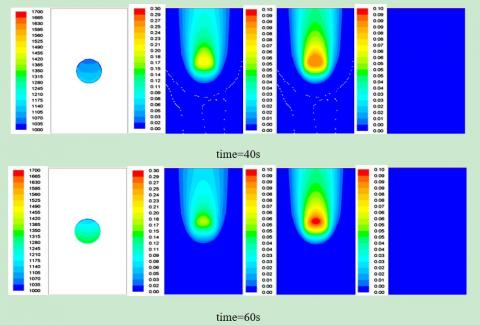
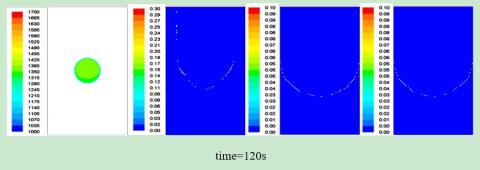
The simulation of single-pellet biomass combustion showed the combustion lasted 2 min, reaching the highest temperature of 1280 K, and the released gases included H2O, CO2 and CO. After the biomass pellets contacted and mixed with the high- temperature air, the free water in the pellets was rapidly evaporated, as shown at t=20 s in Figure 4. When the pellet temperature further rose at t=40 s, abundant H2O and CO2 were formed. The main reason was that the volatile combustible gas-state substances were largely separated out from the surface of the biomass pellets, and the volatiles contacted with oxygen for exothermic chemical reaction. At t=60 s, a small amount of volatiles on the surfaces of single-pellet biomass were burnt, and more importantly, the combustion penetrated to the deeper part of the pellets. At t=80 s, the coke was diffused and combusted to form CO2, CO and other gases that diffused outwards. During the combustion, CO continually combined with O2 to form CO2. Thus, during this process, the pellet temperature further rose, and the resulting gases were mainly H2O, CO2 and CO. However, compared with the above process, the mass fraction of H2O decreased slightly, while the mass fractions of CO2 and CO increased. At t=100 s, the combustion penetrated deeper, and the main reaction in the intralayer was carbon combustion, where the pellet temperature was maximized, and the main gas products were CO2 and CO. At t=120 s, the combustibles were basically burnt out, without forming gases, and the pellet temperatures gradually dropped. During this process, the pellets were burnt into ash spheres.
Figure 4. Temperature distribution and gas composition during single-pellet biomass combustion
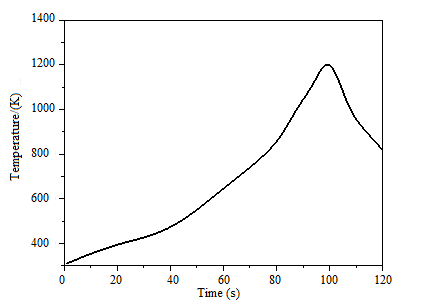
Figure 5. Average pellet temperature changes with time
Figure 5 shows the average temperature changes of pellets. Clearly, when the single-pellet biomass was ignited at t=0 s, the temperature gradually rose until t = 100 s, and then declined. The whole process consisted of water evaporation, volatile separation & combustion, and coke combustion. The temperatures gradually rose during these three stages. At first, the high-temperature gases transferred heat to the pellets, the water was evaporated endothermically, and temperature rise was very slow. However, as the volatiles were separated out and burnt exothermically, the pellet temperature rose quickly. Finally, abundant heat was released from coke combustion, as the pellet temperature rose further until the coke was burnt out. After that, air was blown in top-to-bottom, which cooled down the pellets.
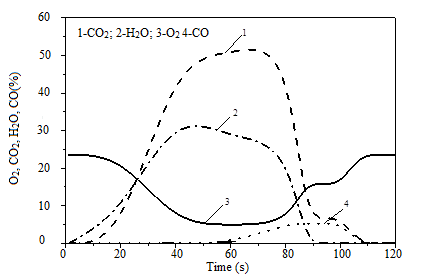
Figure 6. Pellet concentrations changes with time
The temporal change of surface gas composition during the whole combustion process was shown in Figure 6. Clearly, the pellets were initially at the heated drying stage, when the H2O content on pellet surfaces gradually increased, while the O2 concentration was basically unchanged and its mass fraction was 23%. After a short time period, the volatiles were continually separated out and ignited. In the gases, the concentrations of CO2 and H2O quickly increased, but that of O2 decreased. After that, coke combustion reaction started, the CO concentration in the product gases gradually rose, while the CO2 concentration first increased and then decreased, and the H2O concentration gradually declined until disappearance. At this moment, the volatiles and coke were gradually burnt out, and the O2 concentration increased slowly. Moreover, the whole combustion process was dominated by volatile separation and carbon residue combustion. The main reason was that the biomass pellets contained as high as 65% - 75% of volatiles, and the volatile release rate and burning rate from the high-pressure biomass pellets were very slow. The coke burning rate in the biomass pellets was also very slow, and the CO and CO2 generation rates were also very slow.
3.3 Multi -pellet material layer combustion characteristics
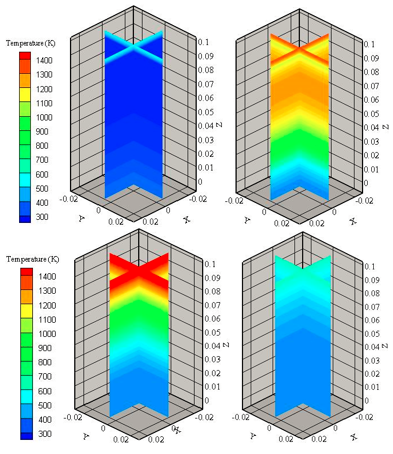
Figure 7 of temperature nephogram shows the material layer temperature distributions at the surfaces of x- and y-axis center throughout the chain-boiler combustion. At first, the high-temperature zone at the upper part of the material layer was very thin, and the temperatures were lower than the combustion zone interior. After volatile combustion, the high temperature zone accounted for 3/4 of thickness of total fuel material layer, and the temperatures on the material layer and in the gas both gradually declined from top to down. At the end of fixed carbon combustion, the high temperature zone accounted for 1/2, and the temperatures on the material layer gradually declined from top to down. During Ash formation, the high temperature region in the upper part of the material layer gradually thinned, and the material layer temperatures slowly declined.
Figure 7. Multi -pellet material layer temperature distribution
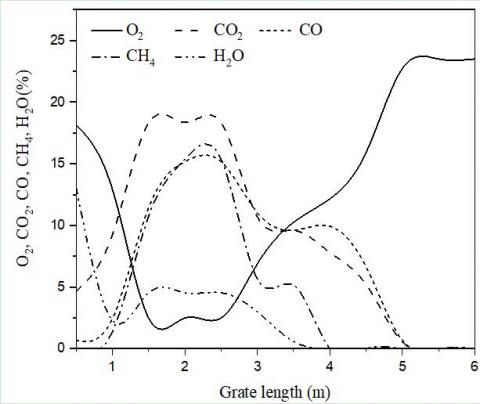
Figure 8. Contents of gas components versus grate length
Figure 8 shows the variation of gas concentrations of major components on the material layer combustion surface with the grate length. The newly-added biomass briquettes, upon entering the furnace, were immediately radiated by the high-temperature smoke (flames) and the walls in the furnace, so the water on the material layer surface and from the bottom fuels evaporated first and the surface water content on the material layer surface was very high, and the oxygen concentration was basically unchanged. The moisture during evaporation absormaterial layer the heat from the fuel material layer and the gases. Consequently, the upward heat transfer was decelerated, the water in the upper layer of the fuel material layer was evaporated at slower rate, and the surface water content on the material layer declined rapidly. As the fuel material layer temperature gradually rose, the volatiles were continually separated out and burnt, and the biomass briquette started to be ignited and combusted. Accordingly, coke started to react, and the CO2 and H2O concentrations on fuel material layer surface gradually increased, while the oxygen concentration declined to very low level. Accordingly, the first maximum CO2 and H2O concentrations appeared. At this moment, the surface fuel particles were under high temperature and sufficient O2, and the coke combustion generated certain amounts of CO2 and CO. After that, as the reduction zone appeared and thickened in the major combustion segment, the CO and CH4 concentrations gradually increased, while the CO2 concentration declined, indicating the occurrence of very severe oxygen deficiency. When the CO and CH4 concentrations maximized, the reduction zone became thinner, and the material layer surface CO and CH4 concentrations gradually declined. After the reduction zone disappeared, oxidation reaction yet occurred on the fuel material layer, and the second maximum CO2 and H2O concentrations appeared. After that, the coke layer thickness decreased and the O2 demand declined. Thus, the O2 concentration in the material layer surface gases gradually increased and finally reached the mass fraction of 23%.
A two-dimensional computational model of single-pellet and multi-particle spherical biomass combustion was established, and the combustion process of single-pellet and multi-particle biomass fuel was simulated under the preset boundary conditions. On this basis, the processes of water evaporation, volatilization, combustion and coke combustion were studied. The TG combustion curve showed a deviation of ~ 5% between the experimental data and the simulation results. The simulation results are well consistent with the trend of TG curve. At the same time, the accuracy of the model is verified. In addition, the model is also applicable to the calculation of single-pellet spherical fuels such as coal. However, the model accuracy, computational efficiency and the specific reaction mechanism of biomass combustion still need to be further improved.
The flow, heat transfer and mass transfer of single-pellet biomass combustion were simulated. It was found the biomass pellet computation in size of 2 cm took about 2 min in the whole combustion, and the highest temperature during the combustion was 1280 K, and the released gases included H2O, CO2 and CO. The stages of biomass pellet combustion were water evaporation, volatile separation & combustion (producing abundant H2O, CO2), and coke combustion (producing mainly CO2 and CO, but minor H2O). During the whole process, the pellet temperature gradually rose until the combustibles were basically burnt out, and then the pellet temperature declined slowly.
Based on the combustion model of single-particle biomass molding fuel, a bed combustion model of biomass-formed fuel heat-conducting oil chain furnace was constructed, and the flow, heat transfer and mass transfer process between gas phase and solid phase during bed combustion were simulated. The results showed that the bed combustion process of biomass particles is in good agreement with the actual combustion process, which verifies the accuracy of the mathematical model of bed combustion.
Our work has been financially supported by the Yunnan Natural Science Foundation Youth Fund Project (Grant No. 2017FD080).
|
subscripts ad |
based on air drying |
|
Mad |
water |
|
Vad |
volatile |
|
Aad |
ash |
|
FCad |
fixed carbon |
|
Cad |
carbon |
|
Had |
hydrogen |
|
Nad |
nitrogen |
|
Oad |
oxygen |
|
Sad |
sulfur |
|
Qnet,ad |
calorific value |
|
FZ |
ignition index |
|
ZM |
combustion characteristic index |
|
ρ |
flow density |
|
t |
time |
|
xj |
j-dimensional coordinate |
|
ug,j |
velocity vector |
|
τji |
surface component of fluid force at the i-th direction |
|
fi |
fluid volume force at the i-th direction |
|
H |
total heat enthalpy of the fluid |
|
ui |
velocity vector at the i-th direction |
|
Γh |
heat transfer coefficient |
|
ρ |
fluid pressure |
|
Sh |
heat source and radiation heat transfer inside the fluid |
|
Γi |
mass transfer coefficient of component i |
|
Yi |
mass fraction of component i |
|
Ri |
generation rate or consumption rate of component i |
|
Si |
item of sources |
|
Cw,s |
vapor densities in the solid-phase surface layer |
|
Cw,g |
vapor densities in the gas phase |
|
k |
speed coefficient |
|
Ts |
pellet temperature |
|
Yvol |
instant mass fraction of volatiles |
|
Dg |
diffusion coefficient of volatile gas |
|
ε |
pellet porosity |
|
C |
matter concentration |
|
Ω |
reaction equivalent coefficient |
|
subscripts fuel |
fuels |
|
subscripts ox |
oxidizer |
|
Rlam |
laminar flow reaction rate |
|
Cj |
concentration of material j |
|
ηj |
concentration index |
|
β |
temperature index |
|
A |
pre-exponential factor |
|
E |
activation energy |
|
k |
reaction rate constant |
|
R |
general gas constant |
|
Sc |
Schmidt number |
|
Re |
Reynolds number |
[1] Kraussler, M., Pontzen, F., Müller-Hagedorn, M., Nenning, L., Luisser, M., Hofbauer, H. (2018). Techno-economic assessment of biomass-based natural gas substitutes against the background of the EU 2018 renewable energy directive. Biomass Conversion and Biorefinery, 8(4): 935-944. https://doi.org/10.1007/s13399-018-0333-7
[2] Mao, G., Huang, N., Chen, L., Wang, H. (2018). Research on biomass energy and environment from the past to the future: A bibliometric analysis. Science of The Total Environment, 635: 1081-1090. https://doi.org/10.1016/j.scitotenv.2018.04.173
[3] Bajwa, D.S., Peterson, T., Sharma, N., Shojaeiarani, J., Bajwa, S.G. (2018). A review of densified solid biomass for energy production. Renewable and Sustainable Energy Reviews, 96: 296-305. https://doi.org/10.1016/j.rser.2018.07.040
[4] Zhang, X., Cai, Z., Zhang, D., Zhang, Z. (2016). Process optimization for densification of water hyacinth pellets fuel. Transactions of the Chinese Society of Agricultural Engineering, 32(5): 239-244.
[5] Guo, H. (2017). Application review of biomass energy and its application prospect in rural areas in China. Journal of Chinese Agricultural Mechanization, 38(03): 77-81. https://doi.org/10.13733/j.jcam.issn.2095-5553.2017.03.018
[6] Zhang, Z., Zhang, Y., Gao, Z.Q., Wang, W., Zhang, Y.L., He, F. (2017). A comparative study on domestic and foreign emission standards for small-to-medium sized biomass combustion equipments. Journal of Shandong University of Technology (Natural Science Edition), 31(5): 12-17. https://doi.org/10.13733/j.jcam.issn.2095-5553.2017.03.018
[7] Qiu, G. (2013). Testing of flue gas emissions of a biomass pellet boiler and abatement of particle emissions. Renewable Energy, 50: 94-102. https://doi.org/10.1016/j.renene.2012.06.045
[8] Tsai, C.H., Tsai, W.T., Liu, S.C., Lin, Y. Q. (2017). Thermochemical characterization of biochar from cocoa pod husk prepared at low pyrolysis temperature. Biomass Conversion and Biorefinery, 8(2): 237-243. https://doi.org/10.1007/s13399-017-0259-5
[9] Wang, X., Zhang, L., Wang, X.M., Tan, H.Z., Xu, T.M. (2013). Mechanism of coking on heating surface of biomass combustion equipment. Journal of Engineering Thermophysics, 34(11): 2189-2193.
[10] Petkovic, D. (2018). Large Biomass Burners for fuel Switch in Existing Fossil Fuel Based Plants. Reference Module in Materials Science and Materials Engineering. https://doi.org/10.1016/b978-0-12-803581-8.11121-x
[11] Jones, J.M., Lea-Langton, A.R., Ma, L., Pourkashanian, M., Williams, A. (2014). Pollutants Generated by the Combustion of Solid Biomass Fuels. Springer Briefs in Applied Sciences and Technology. https://doi.org/10.1007/978-1-4471-6437-1
[12] Lu, H., Baxter, L.L. (2011). Biomass combustion characteristics and implications for renewable energy. Green Energy and Technology, 95-121. https://doi.org/10.1007/978-1-84996-393-0_5
[13] Gou, W., Wang, X., Zhong J. (2018). Study on physical properties and combustion characteristics of biomass fuels by different formulas. Anhui Agricultural Science, 46(24): 177-181, 223. https://doi.org/10.13989/j.cnki.0517-6611.2018.24.058
[14] Tian, H., Liao, Z.C. (2017) Physical properties and combustion properties of biomass solid briquette fuel. Guangdong Chemical Industry, 45(02): 35-36, 41. https://doi.org/10.13226/j.issn.1006-6772.2017.03.002
[15] Baetge, S., Kaltschmitt, M. (2018). Rice straw and rice husks as energy sources—comparison of direct combustion and biogas production. Biomass Conversion and Biorefinery, 8(3): 719-737. https://doi.org/10.1007/s13399-018-0321-y
[16] Fu, W.B., Zhang, E.Z. (1993). General relation and discriminating indices between heterogeneous coal ignition temperature and coal types. Power Engineering, (4): 13-16.
[17] Miao, Y. (1998). Characterization of coal combustion based on proximate analysis. Northeast Electric Power Technology, (5): 1-6.
[18] Zhou, C., Liu, G., Wang, X., Qi, C., Hu, Y. (2016). Combustion characteristics and arsenic retention during co-combustion of agricultural biomass and bituminous coal. Bioresource Technology, 214: 218-224. https://doi.org/10.1016/j.biortech.2016.04.104
[19] Ma, K., Wu, S., Wang, X., Xiong, Y., Chen, H., Lou, B. (2015). Numerical simulation and analysis of biomass briquettes grate furnace combustion based on FLIC. Kezaisheng Nengyuan/Renewable Energy Resources, 33(5): 766-770. https://doi.org/10.13941/j.cnki.21-1469/tk.2015.05.020
[20] Dhahak, A., Bounaceur, R., Le Dreff-Lorimier, C., Schmidt, G., Trouve, G., Battin-Leclerc, F. (2019). Development of a detailed kinetic model for the combustion of biomass. Fuel, 242: 756-774. https://doi.org/10.1016/j.fuel.2019.01.093
[21] Royo, J., Canalís, P., Quintana, D., Díaz-Ramírez, M., Sin, A., Rezeau, A. (2019). Experimental study on the ash behaviour in combustion of pelletized residual agricultural biomass. Fuel, 239: 991-1000. https://doi.org/10.1016/j.fuel.2018.11.054
[22] Zhou, P., Zhou, N.J., Jiang, A.H. (2006). Principles and Numerical Simulation of Transfer Process. Central South University Press: Changsha, China, Chapter 9: 65-68.
[23] Zhou, A.Z., Tu, Y., Xu, H.P. Yang, W.M., Zhao, F.Y., Boon, S.K., Subbaiah, P. (2019) Numerical investigation the effect of air supply on the biomass combustion in the grate boiler. Energy Procedia, 158: 272-277. https://doi.org/10.1016/j.egypro.2019.01.088
[24] Yang, Y.B., Sharifi, V.N., Swithenbank, J. (2007). Converting moving-grate incineration from combustion to gasification-Numerical simulation of the burning characteristics. Waste Management, 27(5): 645-655. https://doi.org/10.1016/j.wasman.2006.03.014
[25] Dernbecher, A., Dieguez-Alonso, A., Ortwein, A., Tabet, F. (2019). Review on modelling approaches based on computational fluid dynamics for biomass combustion systems. Biomass Conversion and Biorefinery, 9(1): https://doi.org/10.1007/s13399-019-00370-z
[26] Kaufmann, H., Nussbaumer, T., Baxter, L., Yang, N. (2000). Deposit formation on a single cylinder during combustion of herbaceous biomass. Fuel, 79(2): 141-151. https://doi.org/10.1016/s0016-2361(99)00137-4
[27] Jiang, X.M., Zheng, C.G., Yan, C., Liu, D.C., Qiu, J.R, Li, J.B. (2002). Physical structure and combustion properties of super fine pulverized coal particle. Fuel, 81(6): 793-797. https://doi.org/10.1016/s0016-2361(01)00209-5
[28] Pronobis, M. Evaluation of the influence of biomass co-combustion on boiler furnace slagging by means of fusibility correlations. Biomass and Bioenergy 2005, 28(4): 375-383. https://doi.org/10.1016/j.biombioe.2004.11.003
[29] Mätzing, H., Gehrmann, H.J., Seifert, H., Stapf, D. (2018). Modelling grate combustion of biomass and low rank fuels with CFD application. Waste Management, 78: 686-697. https://doi.org/10.1016/j.wasman.2018.05.008
[30] Xu, Y., Zhai, M., Jin, S., Zou, X., Liu, S., Dong, P. (2019). Numerical simulation of high-temperature fusion combustion characteristics for a single biomass particle. Fuel Processing Technology, 183: 27-34. https://doi.org/10.1016/j.fuproc.2018.10.024