Ratthasak Prommas* | Sahachai Phiraphat | Phadungsak Rattanadecho
© 2019 IIETA. This article is published by IIETA and is licensed under the CC BY 4.0 license (http://creativecommons.org/licenses/by/4.0/).
OPEN ACCESS
Analysis of the energy and exergy for a naturally ventilated roof called a PV roof solar collector (PV-RSC) was the main purpose of this study, which is comprised of a PV panel (120 W) formed on an upper layer and an aluminum plate on the lower layer of the channel with a length and width of 1.2 and 0.7 m, respectively. Measurements of 30o and 15 cm were set for the gradient angle and air gap of the channel, respectively. The PV panel temperature and air flow temperature affected the efficacy of energy and exergy, as suggested by the results. The research showed effectiveness values of 35-67 % and 15-21 % for total energy and exergy, respectively. Because exergy is expended in the system to geneproportion entropy, exergy yield is reduced compared to the exergy contribution of the system. Further, a correlation exists between the determined and computed values for mass flow proportion through the PV-RSC. Besides, study for other various conditions (such as different weather, PV inclination angles, aspect ratios) is required which would be leading to draw more than general conclusion and spread into adaptation of the system to make higher performance while adjusting the appropriated factors. The aim of this study is to investigate a natural ventilated PV roof solar collector (PV-RSC) and analysis the energy and exergy of the system. A simulation model was comprised of a PV panel (120 W) formed on an upper layer and an aluminum plate on the lower layer of the channel with a length and width of 1.2 and 0.7 m, respectively. Measurements of 30 o and 15 cm were set for the varies gradient angle and air gap of the channel. The PV panel temperature and air flow temperature affected the efficacy of energy and exergy, as suggested by the results. The research showed effectiveness values of 35-67 % and 15-21 % for total energy and exergy, respectively. Because exergy is expended in the system to gene proportion entropy, exergy yield is reduced compared to the exergy contribution of the system. Further, a correlation exists between the determined and computed values for mass flow proportion through the PV-RSC. Besides, study for other various conditions (such as different weather, PV inclination angles, aspect ratios) is required which would be leading to draw more than general conclusion and spread into adaptation of the system to make higher performance while adjusting the appropriated factors.
exergy analysis, PV roof solar collector, natural ventilated PV RSC, air flow
Increasing fuel price has compelled relevant person to plan for different options to meet the energy demands. Solar energy is a clean energy, and appropriate to apply in the buildings and industrial processes. Both of solar thermal and photovoltaic have been interested to produce heat and electricity as appropriate. Normally the studies of energy are concerned about the quantity of energy that can get from solar radiation in forms of electricity by photovoltaic cells or thermal by solar collectors. Efficiencies conversion percentage of energy got from the studies are calculated.
Sarhaddi et al. found that energy function assay for a PV/T (Photovoltaic/Thermal) air collector system can be assessed according to the first and second laws of thermodynamics, which are termed energy efficiency and exergy efficiency, respectively [1]. They studied assessment of conversions in all forms that can be converted in the whole system that can give works together with looking through the deficiencies that occur. Shahvar et al. designed as well as verified a system for naturally ventilated PV/T air collectors [2]. They also measured energy and exergy function for two kinds of glazed and unglazed PV surfaces in Iran. The model developed was used and comparing with experimental value with good agreement in results.
In terms of energy and exergy efficacies in the system, they tested the functioning of the system. Exergy involves the energy available that is gained from deducting the inaccessible energy from the overall energy and the energy corresponding to work that can be changed. The overall of energy systems that to be considered was actually not only quantity but both with quality of utilizing it for works. In the sustainable building design, the passive solar system is a popular integproportiond on the building envelope, viz. ventilated roof (VR) and double wall (DW). Numerous experimental and numerical studies have been conducted concerning the thermal operation of the VR and DW.
In the part of ventilated roof: Puangsombut et al. studied the thermal performance of ventilated roof, called the roof solar collector- radiant barrier (RSC-RB) comprised of standardized heat flux on the upper layer of the channel [3-4]. The experimental were examined the convective heat transfer coefficient and natural ventilation proportion in the inclined rectangular channel. Nusselt number and Reynolds number comprised two dimensionless parameters used for connection between three notable factors including Rayleigh number, inclination angle and aspect ratio. The radiant barrier supporting enhanced ventilation by about 40-50% and lessened heat transfer through the lower layer by about 50% was verified by the experiments. H. Tong and H. Li studied the heat transfer in a ventilated roof on the laboratory experiments and validated CFD model [5]. In order to calculate potential heat transfer through the naturally ventilated inclined roof, a theoretical model was created to assess radiative and convective thermal resistance. However, confirmation experiments for vertical and inclined roofs with asymmetric heat were carried out using a CFD model built to mimic the unstable natural flow in the inclined roof. Subsequently, Phiraphat et al. cultivated a PV ventilated roof called the PV roof solar collector (PV-RSC) aided by a DC fan [6]. The PV-RSC is made of a PV panel on its upper layer and an aluminum plate situated on the lower layer of the channel with 15 cm of gap. Investigation found that the PV-RSC could lessen roof heat gain by about 5-40 % in addition to improving PV-RSC operation effectiveness by between 20 and 30%. Concerning the double wall (DW), Khedari et al. examined the functionality of an improved Trombe wall, called a partially-glazed modified Trombe wall (PG-MTW) [7]. A masonry wall comprised of transparent material, air gap, and a mixture of aluminum-foiled gypsum board and acrylic panel are used to form the PG-MTW, which is intended to minimize the collection of heat, cause higher natural aeration and offer better lighting indoors. To assess the angle of a solar chimney returning the highest natural air flow through the channel, a mathematical engineering model was established [8]. Solar irradiation parts (direct, diffuse, ground-reflected) taken up by the solar chimney for fluctuating tilt and height at a given time (day of the year, hour) and also solar chimney position form the aspects of the mathematical model. Suitable agreement was achieved for a 1 m long solar chimney at different tilt positions based on theoretical estimates and experiments.
Ananacha et al. also researched a Thai modern facade wall (TMF) and Thai modern façade wall with fin (TMF-WF) both experimentally and numerically [9-11]. Two vertical layers comprising an outer layer of fiber glass cement and aluminum plate and an inner layer of clear glass are used to form a TMF. Three layers including two similar layers to the TMF with a third layer having aluminum fin fitted to the front of the outer layer comprises the TMF-WF. The TMF-WF showed it could lower heat gain by up to 227 W/m2, as expressed by the experimental results, as well as provide induce airflow was about 0.015-0.04 m3/second corresponding to number of air change is about 3-8 ac/h. With the numerical simulation, the findings express that the model correlates well with the experimental data. Nevertheless, as above review; they reported only energy transfer process (quantity of energy: first law of thermodynamics), exclude internal deficiencies and energy efficacy is not a sufficient measure for the systems. The characteristic change of solar energy transfer process, use and depletion through the building component are revealed by the exergy analysis (quality of energy: second law of thermodynamics). Many research studies on the exergy analysis viz. inclined ducts, photovoltaic/ thermal (PV/T) collector cooled by air and water and also building energy use [12-15]. Most of the study focuses on the first and second law efficiency also energy and available energy all of processes, which was analyzed to efficient energy use. However, the energy and exergy analysis of the solar collector is significantly considered. Tyagi et al. considered the parametrics of concentrating type sun-oriented gathering [16]; consequent to sun-oriented fixation, the performing parameters including exergy yield, warm and exergetic efficiencies, and also stagnation temperature, bay temperature, and surrounding temperature were enhanced. Then again, the rising capacity of the mass stream proportion for a predefined estimation of sunlight based focus was found to include exergy yield, warm and exergetic efficacies.
Bahrehmand et al. contemplated the energy and exergy examination of various sun-oriented air authority framework with power convection [17]. Likewise evaluated were agent parameters including profundity, length, blade shape, and Re number. Frameworks with blade and thin metal sheets (TMS) have expanded viability contrasted with other contemplated frameworks concerning energy and exergy proficiency, as uncovered in past outcomes. There are several researches that proceeded to enhance the solar collector systems that can be utilized the solar power both to electricity and thermal use. Many parameters were used in the experiments or mathematics models Ucar and Inalli researched the solar air collector with varied forms and collections of absorber exteriors in comparison to a traditional solar air collector [18]. The results indicated performance improvement by using passive techniques. Dividing three to six sheets of staggered absorber and adjusting the air flow facing to these sheets at oblique angle 2° would gain more from the heat radiation and mass flow proportion increasing. The improvement of efficiency achieved from 10 % up to 30 %. For the four types of model experiments with air mass flow proportion 0.026 kg/s, additional exergy efficacy assessment was done. The exergy loss was found varied decreasing from 64.38% down to 43.91 %. Badescu used solar collector model with simplifying assumptions to make the problems mathematic tractable employing an open-loop system, flat-plate solar collector and water mass-flow proportion as control factors [19]. Numerical optimization techniques were used in co-considerations with meteorological and actinometrical information to discover the ideal activity techniques for exergy gain amplification. Reenactments were performed in warm and chilly season. Most extreme exergetic effectiveness was as low as 3% or less while reasoned that amid the warm season the ideal mass-stream proportion was all around connected with the worldwide sun powered irradiance. Afterward, Mahfuz et al. concerned the energy and exergy efficiencies investigation and execution improvement of a shell and cylinder warm energy stockpiling with stage change material (PCM-which was paraffin wax in their trial) in perspective of life cycle cost contrasting with ordinary warm energy stockpiling [20]. Good agreement with the conditions of increasing the flow proportions of heat transfer fluid they used. Nano-fluids (metal oxide) also used in research as mentioned by Muhammad et al. was suggested in the thermal functioning of improved flat-plate and evacuated solar collectors [21]. Thermal conductivity comprises a significant factor to ensure the use of nano-fluids as heat transfer materials for solar applications. However, it is also being considered for additional fiscal cost to gain better conductivity with decreased outlay.
Moradi et al. reviewed of PV/T technologies pointing out to the control parameters that would effect to the systems [22]. Either water or air or combination of both fluids were enjoyed growing attentions of investigations the effected to PV/T systems and a standout amongst the most understanding is mass stream proportion is an essential parameter. In this paper, the investigation of one valuable energy usage in a building is viewed as helpful and destructive irreversible energy i.e., exergy efficiency would be analyzed in terms of output gained to electricity and thermal absorbed to the PV roof solar collector. A Trombe wall is one classically passive system favorable to integproportion on the building envelope for sustainable building design, and furthermore known as a warm capacity divider and additionally sun based warming divider. Duan et al. [23] brought up that review both energy and exergy efficiencies of a warm framework will have more instructive respect to the ideal working zone, due to the degree of achievement of energy transformation gain and destruction, i.e. the amount and nature of energy. The investigation glanced through the concentproportiond energy and exergy examination of various Trombe dividers; (Type I) Trombe divider with the safeguard plate stuck on the warm capacity divider and (Type II) Trombe divider with the safeguard plate put between the glass cover and the warm capacity divider. The energy and exergy balance conditions are logically determined and comprehended. The outcomes demonstproportiond that, the energy and exergy efficiencies of the wind current proportion and air temperature ascend noticeable all around divert in Type II are higher than those of Type I.
This paper is an endeavor to express the systematic execution of a PV rooftop sun-powered authority based on the first and second laws of thermodynamics (energy and exergy examination). The ventilation of the air gap is a naturally ventilated, and opeproportiond in real sunshine conditions. In Section 2, Energy and exergy were assessed and analyzed from 1st and 2nd laws of thermodynamic in forms of equations. Followed by Section 3 describing the experiment set up and measurements of parameters. Section 4 presented the outcome results comparing by graphic trending curves and conclusions in Section 6 while there are explanations of uncertainty theory in Section 5.
Appraisal of the total efficiency of the system is the most appropriate way in which to assess the functionality of the PV roof solar collector (PV-RSC). Commonly, the first and second laws of thermodynamics are utilized to consider the energy and exergy efficiencies, respectively.
2.1 Energy assessment
Used to create heat and electricity, the PV-RSC is a combined system. The first law of thermodynamics is employed to define the heat induced by natural flow (The preservation of energy under steady-state open system), with suitable heat determined by Eq. (1)
${{\dot{Q}}_{u}}=\dot{m}{{c}_{p}}({{T}_{f,o}}-{{T}_{f,i}})$ (1)
where ${{\dot{Q}}_{u}}$ useful heat, W
$\dot{m}$ mass flow proportion, kg/ s
${{c}_{p}}$ definite heat at constant pressure,
J/ kg. K
${{T}_{f,o}}$ outlet air flow temperature, K
${{T}_{f,i}}$ inlet air flow temperature, K
The power output can be measured using the electric voltage and current of load motors, the power output calculated by Equation (2).
${{P}_{output}}={{I}_{l}}{{V}_{l}}$ (2)
where ${{P}_{output}}$ power output, W
${{I}_{l}}$ load current, Amp
${{V}_{l}}$ load voltage, V
Equations (3) and (4) can be used to find the thermal and electrical efficiencies of PV-RSC, respectively.
${{\eta }_{th}}=\frac{\dot{m}{{c}_{p}}({{T}_{f,o}}-{{T}_{f,i}})}{{{I}_{T}}{{A}_{PV}}}$ (3)
${{\eta }_{electrical}}=\frac{{{I}_{l}}{{V}_{l}}}{{{I}_{T}}{{A}_{PV}}}$ (4)
where ${{I}_{T}}$ solar intensity on a tilt angle, W/ m2
${{A}_{PV}}$ area of a PV panel, m2
The overall energy efficacy can be determined by Equations (5) and (6)
${{\eta }_{en}}={{\eta }_{th}}+{{\eta }_{electrical}}$ (5)
${{\eta }_{en}}=\frac{\dot{m}{{c}_{p}}({{T}_{f,o}}-{{T}_{f,i}})}{{{I}_{T}}{{A}_{PV}}}+\frac{{{I}_{l}}{{V}_{l}}}{{{I}_{T}}{{A}_{PV}}}=\frac{\dot{m}{{c}_{p}}({{T}_{f,o}}-{{T}_{f,i}})+{{I}_{l}}{{V}_{l}}}{{{I}_{T}}{{A}_{PV}}}$ (6)
where ${{\eta }_{en}}$ overall energy efficacy, %
${{\eta }_{th}}$ thermal competence, %
${{\eta }_{electrical}}$ electrical competence, %
2.2 Exergy examination
The exergy is the idea to dissect the accessible energy of the framework. This idea depends on the second law of thermodynamics under unfaltering state condition. The exergy balance condition for a PV-RSC can be composed as Eq. (7), which incorpoproportions the aggregate exergy inflow, exergy surge and exergy pulverization of the framework.
$\sum{\dot{E}{{x}_{i}}}=\sum{\dot{E}{{x}_{o}}+\sum{\dot{E}{{x}_{dest}}}}$ (7)
where $\sum{\dot{E}{{x}_{i}}}$ proportion of total exergy inflow, W
$\sum{\dot{E}{{x}_{o}}}$ proportion of total exergy outflow, W
$\sum{\dot{E}{{x}_{dest}}}$proportion of exergy devastation of the system, W
The proportion of overall exergy inflow to the PV-RSC as the thermal and solar radiation exergies by Eq. (8)
$\sum{\dot{E}{{x}_{i}}}=\dot{E}{{x}_{i,air}}+\dot{E}{{x}_{i,sun}}$ (8)
where $\dot{E}{{x}_{i,air}}$ is the proportion of thermal exergy at inlet to the PV-RSC from the air flow, given by Eq. (9).
$\dot{E}{{x}_{i,sun}}$ is the proportion of exergy inflow of solar radiation given by Eq. (10).
The natural flow of the proportion thermal exergy inflow from the air flow while spanning the channel can be gained by Eq. (9)
$\dot{E}{{x}_{i,air}}=\dot{m}{{c}_{p}}\left[ \left( {{T}_{f,i}}-{{T}_{amb}} \right)-{{T}_{amb}}\ln \left( \frac{{{T}_{f,i}}}{{{T}_{amb}}} \right) \right]$ (9)
The exergy inflow to the PV-RSC from the solar radiation given by Eq. (10)
$\dot{E}{{x}_{i,sun}}=\left[ 1-\frac{4}{3}\frac{{{T}_{amb}}}{{{T}_{sun}}}+\frac{1}{3}{{\left( \frac{{{T}_{amb}}}{{{T}_{sun}}} \right)}^{4}} \right]{{I}_{T}}{{A}_{PV}}$ (10)
where ${{T}_{amb}}$ ambient temperature (K)
${{T}_{sun}}$ temperature of the sun (5777K), [24]
The proportion of thermal exergy outflow is defined by Eq. (11).
$\sum{\dot{E}{{x}_{o}}}=\dot{E}{{x}_{o,air}}+\dot{E}{{x}_{electrical}}$ (11)
where is the proportion of thermal exergy outflow from the air flow, given by Eq. (12).
$\dot{E}{{x}_{o,air}}=\dot{m}{{c}_{p}}\left[ \left( {{T}_{f,o}}-{{T}_{amb}} \right)-{{T}_{amb}}\ln \left( \frac{{{T}_{f,o}}}{{{T}_{amb}}} \right) \right]$ (12)
Electrical energy can absolutely change into work. Therefore, electrical exergy is equivalent to electrical energy, which can be expressed as by Eq. (13).
$\dot{E}{{x}_{electrical}}={{I}_{l}}{{V}_{l}}$ (13)
Eqs. (14) and (15) can be used to measure thermal and electrical exergy efficiencies of PV-RSC, respectively.
${{\varepsilon }_{th}}=\frac{\dot{m}{{c}_{p}}\left[ \left( {{T}_{f,o}}-{{T}_{amb}} \right)-{{T}_{amb}}\ln \left( \frac{{{T}_{f,o}}}{{{T}_{amb}}} \right) \right]}{\left[ \dot{m}{{c}_{p}}\left[ \left( {{T}_{f,i}}-{{T}_{amb}} \right)-{{T}_{amb}}\ln \left( \frac{{{T}_{f,i}}}{{{T}_{amb}}} \right) \right] \right]+\left[ 1-\frac{4}{3}\frac{{{T}_{amb}}}{{{T}_{sun}}}+\frac{1}{3}{{\left( \frac{{{T}_{amb}}}{{{T}_{sun}}} \right)}^{4}} \right]{{I}_{T}}{{A}_{PV}}}$ (14)
and
${{\varepsilon }_{electrical}}=\frac{{{I}_{l}}{{V}_{l}}}{\left[ \dot{m}{{c}_{p}}\left[ \left( {{T}_{f,i}}-{{T}_{amb}} \right)-{{T}_{amb}}\ln \left( \frac{{{T}_{f,i}}}{{{T}_{amb}}} \right) \right] \right]+\left[ 1-\frac{4}{3}\frac{{{T}_{amb}}}{{{T}_{sun}}}+\frac{1}{3}{{\left( \frac{{{T}_{amb}}}{{{T}_{sun}}} \right)}^{4}} \right]{{I}_{T}}{{A}_{PV}}}$ (15)
Overall exergy efficacy of PV-RSC can be computed by Eqns. (16) and (17)
${{\varepsilon }_{tot}}={{\varepsilon }_{th}}+{{\varepsilon }_{electrical}}$ (16)
${{\varepsilon }_{tot}}=\frac{\dot{m}{{c}_{p}}\left[ \left( {{T}_{f,o}}-{{T}_{amb}} \right)-{{T}_{amb}}\ln \left( \frac{{{T}_{f,o}}}{{{T}_{amb}}} \right) \right]}{\left[ \dot{m}{{c}_{p}}\left[ \left( {{T}_{f,i}}-{{T}_{amb}} \right)-{{T}_{amb}}\ln \left( \frac{{{T}_{f,i}}}{{{T}_{amb}}} \right) \right] \right]+\left[ 1-\frac{4}{3}\frac{{{T}_{amb}}}{{{T}_{sun}}}+\frac{1}{3}{{\left( \frac{{{T}_{amb}}}{{{T}_{sun}}} \right)}^{4}} \right]{{I}_{T}}{{A}_{PV}}}\\+\frac{{{I}_{l}}{{V}_{l}}}{\left[ \dot{m}{{c}_{p}}\left[ \left( {{T}_{f,i}}-{{T}_{amb}} \right)-{{T}_{amb}}\ln \left( \frac{{{T}_{f,i}}}{{{T}_{amb}}} \right) \right] \right]+\left[ 1-\frac{4}{3}\frac{{{T}_{amb}}}{{{T}_{sun}}}+\frac{1}{3}{{\left( \frac{{{T}_{amb}}}{{{T}_{sun}}} \right)}^{4}} \right]{{I}_{T}}{{A}_{PV}}}$ (17)
where ${{\varepsilon }_{tot}}$ total exergy efficiency, %
${{\varepsilon }_{th}}$ thermal exergy efficiency, %
${{\varepsilon }_{electrical}}$electrical exergy efficiency, %
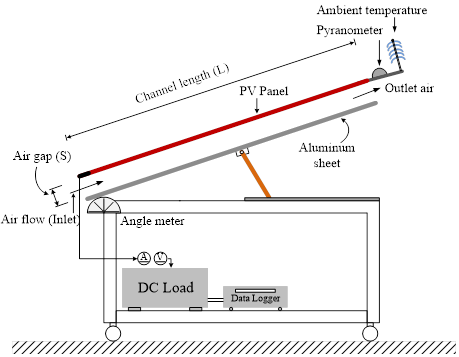
The design of this experiment form a straight measurement of a system that produced electricity but also adding the acting of air flows with the consideration in relations of temperature in flows and out flows at the same setting. Figure 1 shows a schematic of a PV roof solar collector (PV-RSC) using a real picture setup. The test unit was made to mimic a roof solar collector. From the horizontal plane, a tilt angle of 30o was fixed. The significant components are as follows: (i) a PV panel (120 Wp) placed on the upper layer, having length, width and height are 1.2, 0.7 and 0.03 m, respectively. (ii) An aluminum plate with 3 mm of thick was located on the lower layer, while the two side walls were comprised of aluminum plate. (iii) The air gap between upper and lower layers is 15 cm. (iv) Two DC motors are opeproportiond continuously. (v) To keep constant voltage for feeding the load motors, a DC voltage regulator was created. The walls were shielded by using foam of thickness 25 mm to reduce heat loss due to wind and thermal diffuse to the environment, with the bottom of the lower layer (ambient side) also being insulated.
Figure 1. Schematic of experimental apparatus with actual setup photo
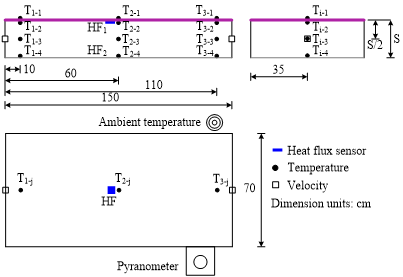
The PV panel consisted of five layers. The top layer is a tempered glass, the second and fourth layers are the ethylene vinyl acetate (EVA) film, which is preventing humidity and dirt penetrating the PV panel, the middle (third) layer is PV cell (Poly-crystalline) and the fifth layer is the white tedlar with 0.85 of emissivity. When the PV panel absorbed the solar radiation, it gets changed over into power and warmth. Because of warm energy of sun based radiation; the PV board get warmed then the PV board temperature expanded and furthermore the PV execution diminished. For this reasons, the warmth expulsion from the PV board is fundamental. The wind current went through the channel of PV-RSC can diminished the PV board temperature, which is increasing power output and improving PV performance. In this study, air flow comprises natural ventilation that regulates the stimulated flow proportion within the channel. The important parameter of each experiment is monitored and recorded during 10:00 to 15:00; the data interval was recorded every 30 minutes. The following parameters should be measured: the PV surface temperatures (top and bottom surfaces), aluminum surface temperature (top and bottom surfaces), air flow temperature, inlet and outlet wind stream temperatures and encompassing temperature, warm motion, sun-oriented radiation and airspeed, and furthermore the voltage and ampere of PV boards. Thermocouples types K (run: 0-1250 oC, precision ± 0.5oC) were introduced at three areas (Figure 2) associated with an information lumberjack (Hioki: Model 8422-52, exactness ± 0.8 %). Each area contained one thermocouple noticeable all around; on connected to a PV board (rear) and another appended to the aluminum plate (channel side). Further, thermocouples were utilized to gauge the PV surface temperatures and encompassing temperature. A hotwire anemometer (KIMO: Model VT 100, territory: 0-50 m/s, mistake ±0.5 %) was utilized to gauge airspeed at the bay, outlet, and center of the channel. Pyranometer was utilized to gauge the sun oriented radiation on the PV tiles (Kipp and Zonen, Model: CMP11), territory: 310-2800 µm, vulnerability < 2%. The electrical intensity of PV board associated with DC stack with volt-meter and amp-meter. Warmth motion sensor (Omega HFs-3, territory: 1-1400 W/m2) estimated warm motion through the underneath of PV board. Warmth motion is estimated through the underneath of PV board.
Figure 2. Sites for temperature, velocity, pyranometer and heat flux sensors
4.1 Energy and exergy findings
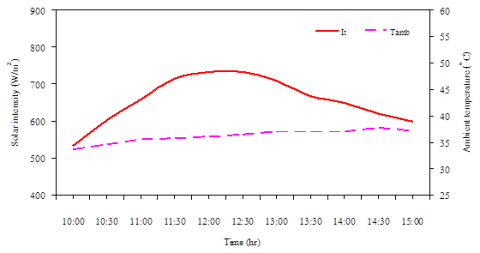
Experimental data was obtained for a clear day in a summer month of year 2017 in Nonthaburi Province, Thailand. To examine the consequence of ambient conditions on the functioning of the PV-RSC, Thailand was used for study. A naturally-ventilated model creating an air gap between a PV panel and an aluminum plate, with air inlet and outlet at both ends comprises the PV-RSC system. As revealed in Figure 3, solar intensity on the tilt angle (30 degree) and ambient temperature are logged from 10:00 to 15:00. It was a clear day with no clouds and ambient temperature sensors left free in the air were not influenced by wind or direct solar radiation, as stated previously.
Figure 3. Solar intensity and ambient temperature during experiment
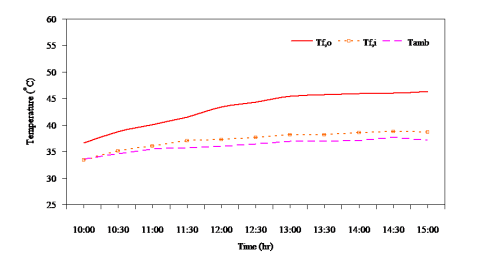
Figure 4 shows the inlet and outlet air flow temperatures and ambient air temperature. Some value has to clarify, which concerns the inlet air flow temperature. Due to the measuring positions (Figure 2) of the inlet air is located at 10 cm from the entrance. The air enters the channel, which will be heated by radiation and convection from a PV panel (backside) throughout the channel length. It was observed that ambient temperature was lower than inlet air flow temperature. Outlet air flow temperature was higher than the other temperatures, as anticipated. Still, identifying the link between air flow temperature and air velocity through the channel remains important. In both of Figures 4 and 5, it was observed that the air flow temperatures were increasing, the air velocity and mass flow proportion were also increasing similar trend as the air flow temperatures. This is due to the air flow temperature as a function of air density.
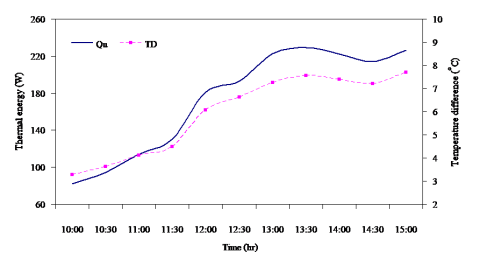
Beside this, there was another relationship as shown in Figure 6: the temperature variance concerning inlet and outlet air flow temperatures and thermal energy. It is observable that thermal energy was increasing at the same time as the temperature difference was intensifying.
Figure 4. PV-RSC inlet and outlet air flow temperatures
Figure 5. Mass flow proportion and air velocity through the PV-RSC
Figure 6. Thermal energy and temperature difference of air flow
Figure 7. PV panel temperature, ambient air temperature and electrical conversion efficiency
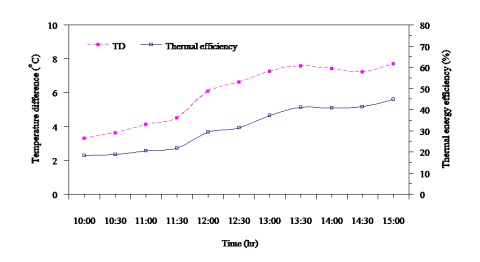
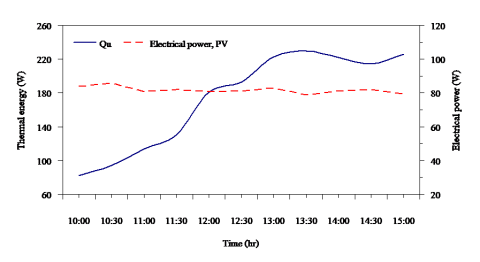
Regarding the PV panel temperature as shown in Figure 7, it was elevated compared to the ambient temperature by around 16 to 21oC. In the meantime, the PV panel temperature was stable at about 55-56oC (during 12:00 to 15:00), it is deemed an isothermal surface. Revealed in Figure 7 is an evaluation of the PV panel temperature and electrical conversion effectiveness of the PV panel. The electrical transformation productivity of the PV board is planned as capacity of PV board temperature as [23]. Where is the temperature coefficient (0.0045 K-1), and is the board proficiency (0.127) at the reference temperature (25oC). Of course, the electrical change productivity of PV board is structure to least when the PV temperature is the most extreme. It was seen that the electrical transformation effectiveness drops when the PV board temperature expanded. With the end goal to appraise the energy and exergy proficiency of the PV-RSC dependent on the deliberate information; viz. PV board temperature, bay and outlet wind current temperature, sun powered force, and air speed under normally ventilated. As made reference to before, all conditions are tackled and introduced in this segment. Figure 8 demonstrates the warm energy and electrical intensity of the framework. It can be observed that the electrical power almost stable throughout the experiment, while can observe that the thermal energy was increasing and also the thermal efficiency was increasing as shows in Figure 10. Besides this, the thermal efficiency is upward trend, which is dependent on the inlet and outlet air flow temperature differences. Earlier in section 2, the electrical power is defined as. In this work, a DC voltage mechanism was created to sustain continuous voltage to feed the load motors. Figures 8 and 10 reveal the link between electrical power and electrical efficiency measurements, respectively.
Figure 8. Thermal energy and electrical power of the PV
Figure 9. Thermal energy efficacy and temperature variation between inlet and outlet air flow temperatures
Figure 10 shows the thermal, electrical and total energy efficiencies versus time. It was revealed that thermal, electrical and overall energy effectiveness varied from 18-50 %, 13-18 % and 35-67 %, respectively. The overall energy competence of the PV-RSC system relies on a number of considerations. solar intensity, geometry of the channel, PV panel temperature and etc.
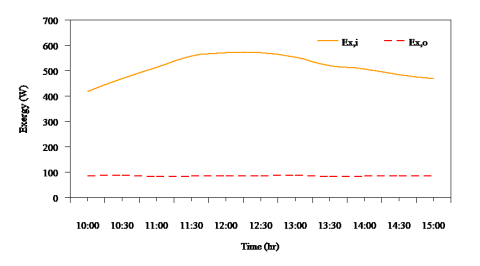
This section presents the exergy assessment, the exergy inflow, and exergy outflow as well as exergy proficiencies analysis. Figure 12 reveals the exergy inflow and exergy outflow of the system, which showed that the exergy inflow of the system rose from 10:00 to 12:00 and then decreasing to 15:00 as hourly variation of solar intensity. While, the exergy outflow is stable range between 80-85 W. The minimum and maximum exergy inflow was found to vary between 416 and 571 W.
Figure 10. Thermal, electrical and overall energy competence of the PV-RSC system
Figure 11. Hourly variation of exergy inflow and exergy outflow
Figure 12. Overall exergy competence and the outlet air temperature
Figure 12 demonstrates outlet air flow temperature as well as overall exergy competence. It was revealed that the overall exergy efficacy trailed the outlet air flow temperature tendency. It is obvious that there are disparities in thermal, electrical and overall exergy competence between 0.1-0.9 %, 14-20 % and 14.5-20.5 %, respectively, as shown in Figure 13.
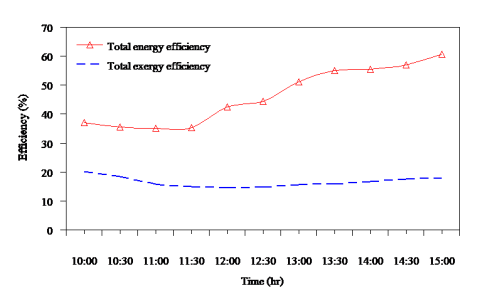
Examination between aggregate energy proficiency and aggregate exergy productivity of the framework was displayed in Figure 14. It is clear from this assume the aggregate energy productivity has elevated qualities compared to the aggregate exergy proficiency. As a result of, the exergy investigation (second law of thermodynamics) can mirror the quality difference in sunlight based energy exchange process through the PV-RSC framework.
Figure 13. Thermal exergy, electrical exergy and total exergy efficiencies
Figure 14. Overall energy competence and overall exergy proficiencies
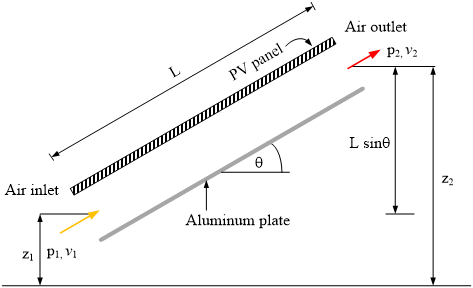
4.2. Analysis of air flow proportion for PV-RSC system
The current research experimentally examined a naturally ventilated PV-RSC system, as revealed in Figure 16. Bernoulli’s equation and continuity equation for equivalent cross-sectional regions at the inlet and outlet of a channel can be used to find the mass flow proportion.
Figure 15. Schematic of a PV-roof solar collector (PV-RSC)
$\begin{align} & {{P}_{1}}+\frac{{{\rho }_{1}}v_{1}^{2}}{2}+{{\rho }_{1}}g{{Z}_{1}}-f\frac{L}{{{D}_{H}}}\frac{{{\rho }_{a}}{{v}^{2}}}{2}-{{k}_{1}}\frac{{{\rho }_{1}}v_{1}^{2}}{2} \\ & ={{P}_{2}}+\frac{{{\rho }_{2}}v_{2}^{2}}{2}+{{\rho }_{2}}g{{Z}_{2}}+{{k}_{2}}\frac{{{\rho }_{2}}v_{2}^{2}}{2} \\\end{align}$ (18)
$Q={{A}_{1}}{{v}_{1}}={{A}_{2}}{{v}_{2}}={{A}_{ch}}v$ (19)
Rearranging and solving Eqns. (18) and (19) obtain:
$({{\rho }_{1}}-{{\rho }_{2}})gL\cdot \sin \theta =\left( f\frac{L}{{{D}_{H}}}+{{k}_{1}}+{{k}_{2}} \right)\frac{{{\rho }_{a}}{{v}^{2}}}{2}$ (20)
The buoyancy force driving the air through the PV-RSC is presented in the left side of Eq. (20), while the right side reveals major loss (wall friction and air flow) along with minor loss.
DH is the hydraulic span of the channel expressed as Eq. (21)
${{D}_{H}}=\frac{2\cdot w\cdot S}{w+S}$ (21)
where w width of the PV-RSC, m
S air gap of the PV-RSC, m
The continuity equation and basic correlation between temperature and density can be gained by Eq. (22)
$\dot{m}=\rho {{A}_{ch}}v$ (22)
and
${{\rho }_{T}}=\rho \beta T$ (23)
where $\rho $ air density within the PV-RSC, kg/ m3
${{A}_{ch}}$ cross sectional area of PV-RSC, m2
$v$ air velocity in the PV-RSC, m/s
${{\rho }_{T}}$ density of air at any temperature, kg/m3
$\beta $ thermal spread of air, $\beta =1/{{T}_{f}}$ (K-1)
$T$ temperature of air, °C
Rearranging and solving Eqns. (20), (22) and (23) for the air velocity, we obtain
${{\dot{m}}^{2}}=\left[ \frac{2g\beta L\cdot \sin \theta ({{T}_{f,out}}-{{T}_{f,in}}){{(\rho {{A}_{ch}})}^{2}}}{f\frac{L}{{{D}_{H}}}+{{k}_{1}}+{{k}_{2}}} \right]$ (24)
where ${{T}_{f,out}}$ outlet air temperature of the PV-RSC, °C
${{T}_{f,in}}$ inlet air temperature of the PV-RSC, °C
L channel length, m
The useful heat by the natural induces air flow through the PV-RSC is given by Eq. (25)
${{Q}_{u}}=\dot{m}{{c}_{p}}({{T}_{f,out}}-{{T}_{f,in}})={{\eta }_{th}}{{I}_{T}}{{A}_{PV}}$ (25)
Substituting for $({{T}_{f,out}}-{{T}_{f,in}})$from Eq. (24) in Eq. (23), we obtain as Eq. (25)
$\dot{m}={{\left[ \frac{2g\beta L\cdot \sin \theta {{(\rho {{A}_{ch}})}^{2}}{{\eta }_{th}}{{I}_{T}}{{A}_{PV}}}{{{c}_{p}}\left[ f\frac{L}{{{D}_{H}}}+{{k}_{1}}+{{k}_{2}} \right]} \right]}^{\frac{1}{3}}}$ (26)
To plainly confirm the mass flow proportion, the PV-RSC relies on the air temperature variance at both ends of the inlet and outlet, as well as wall friction, the inlet and outlet pressure deficits, and solar intensity incidence on the PV panel. Based on the experimental data; the solar intensity, thermal efficacy and air density are employed to measure the mass flow proportion in Eq. 25. For a rectangular channel heated on one wall with open both ends [6], proposed k1=1.5, k2=1.0 and f=0.056. These correlations are calculated to compare the experiment data recorded.
Figure 16. Discrepancy of mass flow proportion per hour (gauged and calculated)
Mass flow proportion through the PV-RSC from the calculated data and estimation is revealed in Figure 16. During 10:00 to 11:30, the measured data closed to the calculation data; during 11:30 to 15:00 both of measured data and calculated data show a similar trend. The effect of air flow temperature and solar intensity is the cause. From Eq. (25), the computed mass flow proportion varies constantly form the increasing irradiance 10:00 until 16:00, as presented in Figure 16. However, the tangible determination of mass flow proportion gained did not vary at a specific value. In between 10:00 to 11:30 the proportion was rising as per equation then experiment system approached to be a steady state condition after 11:30 which can be assumed steady state was from 12:00 to 15:00 as clearly shown in Figure 16. This is because the heat absorbed from the first period was high enough to reduce the different temperature expected from inlet and outlet of the channel. The ration of mass flow assessed failed to vary. Still, the investigational information conformed logically well with the estimates. In future trials, exergy proportion fluctuations of initial and final mass in control volume should be studied.
Uncertainty evaluation is needed to assess the trail information. An uncertainty evaluation in this work was carried out based on the proposed method [26]. A specified function of the individual variables x1, x2, x3…xn is the result R. Vagueness in the result wR with such odds can occur if uncertainties in the individual variables w1, w2, w3… wn are all specified with identical odds, which can be expressed using Equation (27)
${{w}_{R}}={{\left[ {{\left( \frac{\partial R}{\partial {{x}_{1}}}{{w}_{1}} \right)}^{2}}+{{\left( \frac{\partial R}{\partial {{x}_{2}}}{{w}_{2}} \right)}^{2}}+\cdot \cdot \cdot +{{\left( \frac{\partial R}{\partial {{x}_{n}}}{{w}_{n}} \right)}^{2}} \right]}^{1/2}}$ (27)
In this paper, the temperatures, air velocity and voltage and ampere were calculated using proper tools, as described earlier. Use of Eq. (27) was carried out for error assessment to appraise the maximum uncertainty in the trial results, which were deemed to be tolerable at 2.5 % for overall energy competence and 3.0% for overall exergy competence.
This study assessed the energy and exergy measurements of a naturally ventilated PV roof solar collector (PV-RSC) with experimental trials [27] Energy and exergy examination was conducted and revealed according to the trail data results gained from testing the system. Thermal, electrical and overall energy proficiencies of the PV-RSC system ranged from 18-50 %, 13-18 % and 35-67 %, respectively, while thermal, electrical and electrical and overall exergy competences of the PV-RSC system varied from 0.1-0.9 %, 14-20 % and 15-21 %, respectively. The additional conclusions have been made as follows:
It is recommended that this is a consideration of combinations to energy balance and management that could be useful for conservations of energy such as in buildings, i.e. BIPV, PV/T for energy savings. Forced air flow by electric dc fan at the next step of experiment shall be further set up for more results leading to having wide range of analysis and therefore improvement and development of the studies could be proceeded.
E (Effective) work potential
A1 Inlet area of channel, m
A2 Outlet area of channel, m
f Friction factor
g Acceleration due gravity, m2/s
k1 Inlet pressure loss coefficient
k2 Outlet pressure loss coefficient
P1 Pressure at inlet of channel, Pa
P2 Pressure at outlet of channel, Pa
Q Volume flow proportion, m3/s
v1 Velocity at inlet of channel, m/s
v2 Velocity at outlet of channel, m/s
Greek symbols
q Tilt angle, degree
ra Density of air in channel, kg/m3
r1 Density of air at inlet of channel, kg/m3
r2 Density of air at outlet of channel, kg/m3
The authors wish to express their gratitude to Rajamangala University of Technology Rattanakosin (RMUTR) for its financial and resource support of this work and the Thailand Research Fund (contract No. RTA 5980009) and the Thailand government budget grant provided financial support for this study.
[1] Sarhaddi F, Farahat S, Ajam H, Behzadmehr A. (2010). Exergetic performance assessment of a solar photovoltaic thermal air collector. Energy and Buildings 42: 2184-2199. http://dx.doi.org/10.1016/j.enbuild.2010.07.011
[2] Shahsvar A, Ameri M, Gholampour M. (2012). Energy and exergy analysis of photovoltaic-thermal collector with natural air flow. Journal of Solar Energy Engineering 134: 011014-1-011014-10. http://dx.doi.org/10.1115/1.4005250
[3] Puangsombut W, Hirunlabh J, Khedari J, Zeghmati B, Win MM. (2007). Enhancement of natural ventilation rate and attic heat gain reduction of roof solar collector using radiant barrier. Building and Environment 42: 2218-2226. http://dx.doi.org/10.1016/j.buildenv.2005.09.028
[4] Puangsombut W, Hirunlabh J, Khedari J, Zeghmati B. (2007). An experimental study of free convection in an inclined rectangular channel using radiant barrier. Experimental Heat Transfer 20: 171-184. http://dx.doi.org/10.1080/08916150601091514
[5] Tong S, Li H. (2014). An efficient model development and experimental study for the heat transfer in naturally ventilated inclined roofs. Building and Environment 81: 296-308. http://dx.doi.org/10.1016/j.buildenv.2014.07.009
[6] Phiraphat S, Prommas R, Puangsombut W. (2017). Experimental study of natural convection in PV roof solar collector. International Communications in Heat and Mass Transfer 89: 31-38. http://dx.doi.org/10.1016/j.icheatmasstransfer.2017.09.022
[7] Khedari J, Pongsatirat C, Puangsombut W, Hirunlabh J. (2005). Experimental performance of a partially-glazed modified Trombe wall. Int. J. Ambient Energy 26 (1): 27-36. http://dx.doi.org/10.1080/01430750.2005.9674968
[8] Sakonidou EP, Karapantsios TD, Balouktsis AI, Chassapis D. (2008). Modeling of the optimum tilt of a solar chimney for maximum air flow. Solar Energy 82: 80-94. http://dx.doi.org/10.1016/j.solener.2007.03.001
[9] Ananacha T, Puangsombut W, Hirunlabh J, Khedari J. (2013). Field investigation of the thermal performance of a Thai modern facade wall. Int. J. Ventilation 12(3): 223-233. http://dx.doi.org/10.1080/14733315.2013.11684018
[10] Ananacha T, Puangsombut W, Hirunlabh J, Khedari J. (2014). Daylighting and thermal performance of thai modern façade wall. Energy Procedia 52: 271-277.
[11] Ananacha T, Puangsombut W, Hirunlabh J, Khedari J. (2015). Experimental performance and simulation of a Thai modern facade wall. Int. J. Ventilation 14(3): 255-271. http://dx.doi.org/10.1016/j.egypro.2014.07.078
[12] Brinkworth BJ. (2000). A procedure for the routine calculation of laminar free and mixed convection in inclined duct. Int. J. Heat and Fluid Flow 21: 456-62. http://dx.doi.org/10.1016/S0142-727X(00)00027-8
[13] Dubey S, Solanki SC, Tiwari A. (2009). Energy and exergy analysis of PV/T air collectors connected in series. Energy and Buildings 41: 863-870. http://dx.doi.org/10.1016/j.enbuild.2009.03.010
[14] Chow TT, Pei G, Fong KF, Lin Z, Chan ALS, Ji J. (2009). Energy and exergy analysis of photovoltaic-thermal collector with and without glass cover. Applied Energy 86: 310-16. http://dx.doi.org/10.1016/j.apenergy.2008.04.016
[15] Yucer CT, Hepbasli A. (2011). Thermodynamic analysis of building using exergy analysis method. Energy and Buildings 43: 536-542. http://dx.doi.org/10.1016/j.enbuild.2010.10.019
[16] Tyaki SK, Wang S, Singhal MK, Kaushik SC, Park SR. (2007). Exergy analysis and parametric study of concentrating type solar collector. Int. J. Thermal Science 46: 1304-1310. http://dx.doi.org/10.1016/j.ijthermalsci.2006.11.010
[17] Bahrehmand D, Ameri M, Gholampour M. (2015). Energy and exergy analysis of different solar air collector systems with forced convection. Renewable Energy 83: 1119-1130. http://dx.doi.org/10.1016/j.renene.2015.03.009
[18] Inalli UM. (2006). Thermal and exergy analysis of solar air collectors with passive augmentation techniques, International communications in heat and mass transfer. 33: 1281-1290. http://dx.doi.org/10.1016/j.icheatmasstransfer.2006.08.006
[19] Badescu V. (2007). Optimal control of flow in solar collectors for maximum exergy extraction, International Journal of Heat and Mass Transfer 50: 4311-4322. http://dx.doi.org/10.1016/j.ijheatmasstransfer.2007.01.061
[20] Mahfuz HM, Anisur MR, Kibria MA, Saidur R, Metselaar IHSC. (2014). Performance investigation of thermal energy storage system with phase change material (PCM) for solar water heating application. International Communications in Heat and Mass Transfer 57: 132-139. http://dx.doi.org/10.1016/j.icheatmasstransfer.2014.07.022
[21] Muhammad MJ, Muhammad IA, Sidik NAC, Yazid MNAW. (2016). Thermal performance enhancement of flat-plate and evacuated tube solar collectors using nanofluid: A review. International Communications in Heat and Mass Transfer 76: 6-15. http://dx.doi.org/10.1016/j.icheatmasstransfer.2016.05.009
[22] Moradi K, Ebadian MA. (2013). A review of PV/T technologies: Effects of control parameters. International Journal of Heat and Mass Transfer 64: 483-500. http://dx.doi.org/10.1016/j.ijheatmasstransfer.2013.04.044
[23] Duan S, Jing C, Zhao Z. (2016). Energy and exergy analysis of different Trombe wall. Energy and Buildings 126: 517-523. http://dx.doi.org/10.1016/j.enbuild.2016.04.052
[24] Moran MJ. (1982). Availability analysis: A guide to efficiency energy use, Prentice-Hall Inc. Englewood Cliffs.
[25] Raman V, Tiwari GN. (2008). Life cycle cost analysis of HPVT air collector under different Indian climatic conditions. Energy Policy 36: 603-611. http://dx.doi.org/10.1016/j.enpol.2007.08.031
[26] Holman JP. (1994). Experimental Method for Engineers, sixth ed., McGraw-Hill Co., Singapore.
[27] Nonthiworawong D, Rattanadecho P, Prommas R. (2019). Energy and exergy analysis of low-cooling in building by using light-vent pipe. Science & Technology Asia 24: 41-53. http://dx.doi.org/10.14456/scitechasia.2019.5