OPEN ACCESS
Humanitas is a private group of medical facilities based in Italy, offering medical care and promoting prevention initiatives, research and teaching. The Humanitas Group includes the Istituto Clinico Humanitas (ICH) in Rozzano (Milan) and several relevant private clinics in northern Italy and Sicily.
The Humanitas group started a process of implementing real time monitoring of energy consumption as a means to aid the diagnosis and management of buildings and their technical facilities, in collaboration with the University of Genoa and its academic spin off IESolutions. Such platform is developed by IESolutions in collaboration with Softeco Sismat, an IT company based in Genoa.
This paper presents the implementation of the monitoring system as a common cloud based web service on three facilities of the Humanitas group, namely the Cellini Clinic, the Gradenigo Hospital and an orthopaedic rehabilitation facility part of the ICH in Rozzano. It is also presented how a multi site, multi client platform provides users with cross data to help assess the consumption profiles of the hospital facilities, to define common Key Performance Indicators (KPI) and to identify best practices as a common ground between various buildings to optimize use of energy resources, minimize energy waste and reduce overall costs.
energy monitoring, hospitals, energy efficiency, KPI, facility management
Management policies of hospital facilities are aimed at combining sustainable operational costs with efficient performance and continuity in the delivery of health care services. The energy sector plays a key role in this context, having to ensure optimal management of technological systems based on the knowledge of energy consumption, possibly organized by centers of consumption, by type of energy and by type of service [1].
The Humanitas Group is in the process of implementing real time energy monitoring as a means to aid the diagnosis and management of their buildings and technical facilities through detailed knowledge of their energy consumption [2] [3]. The chosen platform is a cloud based web service named ESOS (Energy Smart Optimization System) developed by IESolutions, an academic Spin Off of the University of Genoa and Softeco Sismat, an IT company based in Genoa.
The processing platform collects field data from sensors and records them in a database, allowing the visualization of load profiles, the determination of energy indicators and specific energy data analysis [9]. The scope of such platform is to monitor energy consumption and to drive corrective actions, to constantly operate the system within predefined optimum operational criteria.
Humanitas was established in 1988 by the Techint Group, along with other industrial and financial partners, in order to promote, implement and manage health care initiatives. In particular, Humanitas has built or acquired and manages a number of high-complexity health care institutions in Italy. Humanitas’ management model relies on a wide application of advanced integrated information technology systems, and on the use of the Internet to facilitate the relationship between the hospitals and both clients and suppliers.
The Humanitas group at present includes the Istituto Clinico Humanitas near Milan; the Humanitas Gavazzeni hospital in Bergamo; Humanitas Cellini, one of Turin’s major clinics; Humanitas Centro Catanese di Oncologia in Catania (Sicily) and Humanitas Mater Domini in Castellanza (Varese). Since the beginning of 2016, Humanitas San Pio X, a clinic in the center of Milan, and Humanitas Gradenigo, a hospital with an emergency department located in Turin, are also part of the network. The Techint Group also controls Fornaca di Sessant, a private hospital located in Turin.
The energy monitoring platform has so far been implemented on three facilities of the Humanitas Group, namely the Cellini Clinic and The Gradenigo Hospital, both based in Turin, and the orthopaedic rehabilitation center of the Istituto Clinico Humanitas (ICH) in Rozzano.
The Cellini Clinic is a polyspecialistic facility spreading over a total area of approximately 11.000 m2. It offers 120 beds for a considerable number of services: the clinic averages 6.000 yearly patient admissions and hospitalizations in Day Hospital or Day Surgery and delivers a yearly average of 22.000 radiology tests, 200.000 laboratory tests and 46.000 specialized visits.
The main building spreads over 6.500 m2 and consists of 5 floors above ground and one underground floor destined for hospital use, plus a basement and an outdoor cover for the technical rooms. Further to the main building, the clinic encompasses two more buildings, with a surface of 600 m2 and 4.000 m2, respectively. They are destined for hospital use and hosting of technical rooms. The clinic has 8 operating rooms, plus a hemodynamics room, all having a strong impact on the power management of the structure, being such facilities extremely energy-intensive.
The electric system of the Cellini Clinic is constituted by a 15 kV Medium Voltage point of delivery, to feed all loads via two MV/LV transformer stations, named Cabin A and Cabin B. These run respectively one and two transformers in parallel, all sized 630 kVA. All medical facilities are fed via an emergency power supply with two power generators of sizes 411 kVA and 200 kVA, respectively.
The Gradenigo hospital is a health post located in Turin, equipped with an emergency department. The hospital offers 180 beds for hospitalizations on an ordinary basis or in day surgery, as well as for admissions from the emergency room. The Gradenigo hospital delivers a yearly average of 15.000 hospitalizations, 70.000 radiology tests, 1.000.000 laboratory tests and 240.000 specialized visits. The hospital spreads over a total area of approximately 22.000 m2 and is divided into two buildings, namely the ’historical site’ and the ‘new site’. The historical site was built in early years of 1900 and spreads over 13.000 m2. It consists of 7 floors above ground and 2 floors underground and it hosts the emergency department, operating rooms, beds for hospitalizations, several specialized day hospital rooms and laboratories for analyses. The new site spreads over 8.000 m2 and is of recent construction. It consists of 6 floors above ground and 2 floors underground and it hosts beds for hospitalizations, specialized day hospital rooms as well as specialized day surgery rooms.
Electric power is delivered via two separate 22kV Medium Voltage points of delivery (one per building), each feeding two power transformers of 1.600 kVA for the historical site and of 500 kVA for the new site. All medical facilities, including 4 operating rooms and 2 day surgery rooms are fed via an emergency power supply with two power generators of sizes 1.100 kVA (historical site) and 630 kVA (new site).
Part of ICH in Rozzano is the newly built physiatric and rehabilitation center, a multi-specialist structure dedicated to orthopedic, neurological and cardiorespiratory rehabilitation treatments serving up to 270 patients per day, with 6 gyms, 12 rooms for manual therapies and 4 clinics. Monitoring of both electric energy and natural gas consumption has been implemented for this facility.
Electric power is delivered via a Low Voltage point of delivery feeding all loads, mainly a Chiller weighing for 75kW of electric power demand, several air treatment units, fan coils and radiators, all adding up to a 120 MWh yearly power consumption, roughly. Natural Gas is feeding two gas boilers of 250 kW and 220 kW peak, respectively.
The energy monitoring platform adopted by Humanitas is a multi client, multi user and multi site software to monitor real time energy consumption and perform analyses on the recorded data. Field data are collected and transmitted to the central server, where they are stored into a database and made available to the processing logic. All the platform features are accessible to users, according to each own privileges, through a web browser application. The interface layout is designed to provide easy shortcuts to frequently used charts, tables and analyses for each individual monitored element, selectable by the operator from a hierarchical tree diagram.
The monitoring platform is based on enterprise web technology and is integrated with the field through proprietary RTU (Remote Terminal Unit) components, or by directly interfacing any middleware already in place for technical assets management, with the ability to interact on different communication protocols (e.g. Modbus serial, Modbus TCP, TCP/IP, BACnet, etc). The platform functions are implemented depending on the application, starting from energy monitoring to advanced energy analysis functions, such as KPI and benchmarks definitions, typical consumption profiles, seasonality, statistical analyses (e.g. ABC curve, spectral analysis, data correlation) and energy balance calculation.
The installation on the Cellini Clinic involves the monitoring of electric energy consumption at the MV Point of Delivery as well as on other distribution panels, grouped in a logical way by location and by type of served loads (e.g. technological users, aggregated loads, UPS devices).
The installation on the Gradenigo Hospital involves the monitoring of electric energy consumption at both MV points of delivery, as well as on several distribution panels on both buildings. Once again, the distribution panels are grouped by location and by type of served loads in the tree branch structure.
The installation on the physiatric rehabilitation center part of the ICH in Rozzano involves the monitoring of electric energy consumption at the LV point of delivery, as well as of the gas consumption feeding the boilers for heating and domestic hot water at the point of delivery.
One of the main advantages presented by an energy monitoring platform common to similar facilities, such as the clinics and hospitals of the Humanitas group, is the shared database of historical consumption data. Such information can be used to take advantage of the experience and practices of each particular facility to supply the other facilities with valuable information and provide a reference on which to fine-tune their own energy management policies [4].
One simple way to perform such cross analyses is to define specific Key Performance Indicators (KPI’s) and identify related benchmarks as points of reference. Benchmarking for hospital facilities with reference to literature is made possible by defining specific KPIs in order to compare similar structures with respect to parameters such as geographic location, type of building, utilization, number and type of technical facilities, etc. The more homogeneous the compared structures, the better.
For instance, two of the most useful KPI’s to compare the energy performance of hospital facilities are:
consumed energy per square meter = $\frac{k W h}{m^{2}}$ (1)
consumed energy per bed = $\frac{\mathrm{kWh}}{\mathrm{bed}}$ (2)
They would make little sense if they were used to compare a highly specialized hospital making use of numerous technological equipment with a mainly residential structure dedicated to hospital stays.
In fact, one of the challenges of benchmarking the performance of a hospital facility vs. reference KPI’s taken from literature is represented by the odds of comparing data from different structures, located in different parts of the world, with different technical installations, different casing, serving different clients and providing different services. Once relevant operational data is found in literature, it is very tempting to compare data from our facility to this data as if they were the same thing, but often times the differences are significant enough that any useful comparison needs to take such differences into account, which is rarely an easy task to accomplish. Also, fresh literature data updated with recent information is not easy to find, which provides for a further degree of uncertainty as technology is quickly developing energy efficiency solutions and therefore what is considered good energy performance today might not be such in a just few years’ time [5].
On the other hand, given specific KPI’s, benchmarks can be defined with reference to each structure’s own historical operational data, i.e. by comparing the current operational data of the structure with the data of the same structure related to a previous time interval. This procedure is particularly useful when an ‘optimum operating range’ with regards to energy performance is known for the structure, therefore measuring actual performance of the structure vs. the optimized status is a safe way of benchmarking actual operation. Provided that technical installations are kept the same (i.e. no change in the electrical or heating systems, loads, generators, etc.) this way of benchmarking energy performance of a structure is also a good way of assessing behavior of the same facility under different operating conditions (i.e. different seasons, different occupancy, different times of the day or days of the week, etc.).
A great benchmarking strategy provides for a combination of the two approaches just described, where measuring the facility’s relevant KPIs against benchmarks derived from literature provides the first step of any energy audit. This helps highlighting issues and directing specific corrective actions to improve energy efficiency. Then, after corrective actions are implemented and upon reaching acceptable results, an operating point of reference can be defined and thus taken as benchmark against which to measure the future behavior of the facility. In such a context, the trend of the reference KPIs can also be monitored, representing an important ranking factor of the way the structure evolves over time after a reference ‘optimal’ status is reached; either to try to improve over the ‘optimal’ status or, as a minimum, to prevent the system from drifting back to unoptimized, and thus less energy efficient, operation.
The Cellini Clinic is the first facility of the Humanitas group where a real time energy monitoring system was implemented. A preliminary assessment based on historical data was carried out to identify the current operating conditions and energy demand.
The preliminary analysis covered two and a half years previous to energy monitoring implementation (2012, 2013 and half of 2014), where electric energy consumption summed up to 3.103.700 kWh, 2.999.467 kWh and 2.662.325 kWh, respectively. The steep reduction in demand of year 3 vs. year 2 (-11%) is due to extraordinary maintenance performed during year 3 on refrigeration units, despite the summer degree days between the two years are comparable: 304 CDD (Cooling Degree Days) for year 2 and 316 CDD for year 3. Total electric energy consumption allocation to cost bands (F1 peak cost, F2 and F3 off-peak cost) is as follows: 39% is reported to F1, 23% to F2 and 38% to F3. Summer consumption is generally 30% higher than in winter, due to air conditioning. Summary data and significant KPI’s are shown in the following Table I.
Table I. Yearly electric energy consumption prior to monitoring and relevant KPIs: Cellini clinic
|
Year |
El. Energy Consumption kWh |
Energy vs. Area [kWh/m2] |
Energy per Bed [MWh/bed] |
|
2012 |
3.103.700 |
282,15 |
25,86 |
|
2013 |
2.999.467 |
272,68 |
25,00 |
|
2014 |
2.662.325 |
242,03 |
22,20 |
Table Ⅱ. Peak/off peak power consumption ratio prior to monitoring: Cellini clinic
|
Peak/Off Peak |
2012 |
2013 |
2014 |
|
Yearly |
1,35 |
1,40 |
1,39 |
|
Summer |
1,47 |
1,50 |
1,29 |
|
Winter |
1,31 |
1,39 |
1,38 |
Also the relationship between power consumption during peak hours (F1) off-peak hours (F2 and F3) was calculated, both on an annual and seasonal basis. The following Table II shows the calculated KPI’s.
While considering that hospitals present a Peak/Off Peak ratio lower than most other structures, typically in the neighborhood of 2 [4] [5], given their 24/7 operation and high energy requirement during night hours, the calculated KPI’s highlighted an interesting potential for savings.
After the monitoring platform was commissioned and started service, operational data began to be collected and examined through the analysis of the load curves. In general, the installation of the monitoring system allowed recording the precise absorption of the different electrical panels during a significant period of time. On the basis of the measured data several adjustments to the management strategy of the technical installations were made, thus targeting energy saving actions at 'zero cost'.
Particular attention was given to the use of the refrigeration units and of the Air Handling Units (AHU), whose consumption profiles used to be little modulated over the 24 hours, by optimizing the start times and the operation modes. In particular, specific operation calendars were created for the various zones, according to the different comfort requirements, activities and work shifts, modulating the power output of the AHU accordingly. The operation of AHU serving surgery rooms was provided with a calendar-bypass option that would run the units at full power to reach the necessary ambient temperature in case emergency surgery activities are to be performed out of the standard time schedule.
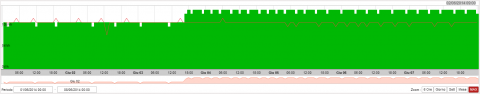
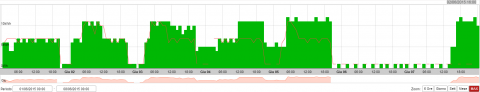
As an example, the following load curves (Figures 1 and 2) represent the weekly energy consumption relative to the surgery rooms before and after the implementation of specific calendars. The red curve represents energy consumption relative to the previous week and is reported to highlight the regularity of the average behavior of loads.
Figure 1. Load profile AHU surgery rooms 01 - 07 June 2014
Figure 2. Load profile AHU surgery rooms 01 - 07 June 2015
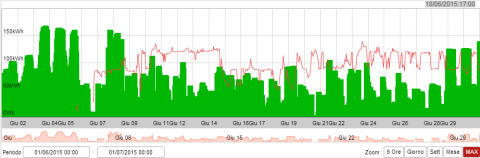
Figure 3. Monthly load profile refrigeration unit B, June 2014 (red curve) vs. June 2015 (green area)
A second action to rationalize electric energy consumption related to climate control was the creation of three distinct modes of operation for the refrigeration system (night, economy, comfort), in order to adapt the system operating temperature of refrigeration per area to the different time shifts and related requirements. Figure 3 reports the monthly load profile related to one of the refrigeration units. The green area is related to the energy consumed after the action was put in place. The red line is related to the energy consumed during the same month of the previous year.
Following this specific action, a 20 MWh monthly savings on climate control due to reduced energy consumption was calculated, given equal climatic seasonal conditions (same average external temperature), see Table I.
Table III. Refrigeration units electric energy consumption – June 2015 vs June 2014
|
|
Refrig. Unit A [kWh] |
Refrig. Unit B [kWh] |
Avg. Ext. Temperature[°C] |
|
June 2014 |
24.862 |
58.041 |
22 |
|
June 2015 |
23.011 |
39.614 |
22 |
|
Difference |
- 1.850 |
- 18.426 |
- |
In general, the total consumption shows a steady decrease from the time of activation of the monitoring platform (June 2014). An analysis of the cumulative electric energy demand data for the years 2013 - 2016 shows how during 2014 the demand decreased by roughly 100 MWh over the previous year, despite the rising trend that distinguishes the first months of 2014, prior to the implementation of the monitoring platform. Extending the analysis to the entire period of activity of the monitoring system, the decrease in consumption over the same period of the previous year sums up to about 290 MWh. In the following Table II the evolution of consumption from 2013 to 2016 is provided.
Table Ⅳ. Yearly energy consumption Cellini clinic
|
Year |
kWh |
|
2013 |
2.999.467 |
|
2014 |
2.662.325 |
|
2015 |
2.266.814 |
|
2016 |
2.169.419 |
Electric energy consumption in 2016 is 4% lower than consumption in 2015 and 27% lower than in 2013, being 2013 the last year before energy monitoring was implemented.
Following reduced electric energy consumption, relevant KPIs also improved, as shown in the following Table III.
Table V. Cellini clinic yearly KPIs following energy monitoring
|
Year |
El. Energy Consumption |
Energy vs Area [kWh/m2] |
Energy per Bed [MWh/bed] |
|
2016 |
2.169.419 |
197,22 |
18,08 |
One interesting remark should be made by comparison of such results with data presented by ENEA (Italian National Agency for New Technologies, Energy and Sustainable Economic Development) on their nation-wide survey from 2014 [8] regarding energy consumption of hospital facilities located in north-west Italy (climatic zone E) over the years 2012 - 2013, where the considered KPIs are as follows: 163 kWh/m2 (average specific electric energy consumption per square meter) and 14,07 kWh/bed (average specific electric energy consumption per bed).
The availability of national survey data provides the energy managers with interesting references and starting points for the analysis. The actual values of the KPIs are influenced by several different factors that might vary widely from surveyed facility to facility (type of building, technological plants, medical machinery, level of specialization, etc.), thus the survey data are filtered by important structural parameters such as number of beds, number of laboratories, number of operating rooms, etc. Nevertheless, such data can hardly represent specific target values for structures undergoing an actual energy efficiency process.
For such reason, for the energy manager to be able to rely on a shared database of consumption data, such as the one provided by the monitoring platform to the Humanitas group, is of utmost importance: mutual benchmarking of facilities and cross-evaluation of data can be performed on the basis of direct knowledge of all the elements influencing KPI calculation and can account properly for such elements.
As a result, a sound set of data taken from the internal database can lead to a library of reliable reference benchmarks, and the more the facilities included in the platform and the more the overall monitoring time and historical data, the better the dataset and the narrower the target values available to the energy manager.
The presented case study of the Cellini Clinic highlights how the energy-monitoring platform was used to modify technical equipment management policies and reduce energy consumption, by curtailing unnecessary services and related energy requirements. The detailed knowledge of the load profiles over time is the enabling factor of any decision related to energy management, either involving the way technical equipment are operated or relating to changes in technical equipment, to improve its energy efficiency (e.g. upgrade of electric motors to better efficiency class, lights upgrade to LED-based technology, UPS upgrade with newer technology, etc.). The key to any targeted decision is the ability to measure. Once a metering system is in place and the system under control, a reference on which to measure and pursue continuous improvement is made available, which is the case of the Cellini Clinic.
Also, the consumption data of the Cellini Clinic represents a reference point for all other facilities of the Humanitas group. In fact, despite the differences from facility to facility (services offered, technological equipment, type of building, capacity, workload, etc.), the availability of all relevant information about the hospitals allows for an informed rationalization of any calculated indicator. Moreover, all the facilities fall within the same climatic zone (save for the oncological center in Catania) providing a strong common base for all considered structures, with respect to the most influential factor in energy consumption, that being summer air-conditioning and winter heating.
Table VI. Yearly energy demand prior to monitoring and relevant KPIs (year 2016): Gradenigo hospital
|
Year 2016 |
Building A |
Building B |
|
Electric Energy Consumpt. (kWh) |
1.554.037 |
2.995.033 |
|
Total surface (m2) |
8.000 |
13.000 |
|
Beds |
180 |
|
|
kWh/m2 |
194,25 |
230,39 |
|
kWh/m2 general |
216,62 |
|
|
MWh/bed general |
25,27 |
|
As already mentioned, the evolution over time of reference KPIs represents for any single facility a way to monitor improvement and to avoid drifts towards non-optimized operation for any given boundary conditions. When extending the reference scenario to more monitored facilities, such as is the expanding case of the Humanitas hospitals and clinics, the toolset available to energy managers for the optimization of energy consumption broadens considerably, as the common database of real-time collected data is populated and the related library of reference indicators is consolidated and made more reliable month after month.
The methodology used on the Cellini Clinic can be extended to the Gradenigo hospital. The hospital consists of two buildings, which were included in the energy monitoring platform in August 2016 (Building A) and January 2017 (Building B). In the following
Table IV a brief summary of the 2016 energy consumption data is provided.
The KPIs calculated for the Gradenigo hospital are similar to the ones of the Cellini Clinic prior to the installation of the energy monitoring system (see Table ), especially with respect to the MWh/bed value and with the kWh/m2 value referred to the larger of the two buildings (i.e. Building B). Given the significant energy savings obtained on the Cellini Clinic with the work done on refrigeration and AHU units, the first step of analysis on the Gradenigo hospital should concern the study of air conditioning. Below are the hourly active and reactive energy consumption profiles of the refrigeration units of Building B, registered during the week spanning from 22 to 28 August 2016.
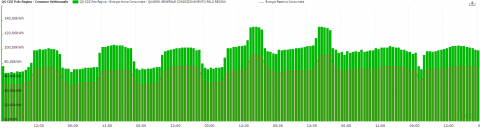
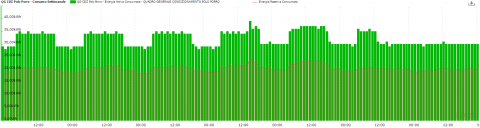
Figure 4. Refrigeration load profile Polo Regina (building B) 22-28 August 2016
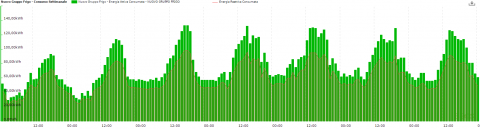
Figure 5. Refrigeration load profile Polo Porro (building B) 22-28 August 2016
Figure 6. Refrigeration load profile New Refrigeration Units (building B), 22-28 August 2016
Figure 4 the load profile of the refrigeration unit of Polo Regina is shown. There’s hardly any difference in energy consumption during night hours or daytime. Furthermore, energy consumption over the weekend is comparable to the daytime levels registered during weekdays, with almost no modulation during night time. Two peaks are also evident, occurring in the late afternoon of Thursday and Friday.
In Figure 5 the load profile of the refrigeration unit of Polo Porro is shown. Here again the difference in energy consumption during night hours or daytime is minor. The load profile of the refrigeration unit suggests that two different temperature set points for the unit are in place: one for the night time and weekends, and one for the workdays during day time.
Figure 6 depicts the load profile of the refrigeration unit of Polo Porro. Contrary to the other refrigeration units, this unit appears to modulate with different behavior every day and a clear day / night distinction.
The analysis of the load profiles of the three refrigeration groups shows that only the new unit modulates depending on usage and on the external temperature. The other two units appear to operate regardless of the boundary conditions. This suggests that a thorough analysis of the refrigeration units usage and a subsequent definition and application of an optimized management strategy to the air conditioning of Gradenigo can be the correct approach forward. Possibly following the path traced by the Cellini Clinic and relying on this previous experience to identify and reduce energy waste of Gradenigo and reduce energy spent.
This paper presented the implementation of a real time energy monitoring platform on some hospital facilities part of the Humanitas Group. A brief description of the energy monitoring system and of the monitored sites was provided.
The case study of the Cellini Clinic was presented, where the monitoring platform was successfully applied to help drive the reduction of the facility’s electric energy consumption by 27% over 3 years, of which 2,5 covered by monitoring. A brief explanation of the implemented actions was provided as well as of the results achieved. The data collected by the Cellini Clinic monitoring activity put the basis to the creation of an internal library of KPIs and to the definition of a methodology to study the other structures of the Humanitas group.
Analogous structural and functional features to the Cellini Clinic suggest a similar approach to the optimization of energy consumption for the Gradenigo hospital, recently equipped with the monitoring platform, also based in Turin and also part of the Humanitas group. Preliminary analyses of the load profiles show similarities between the behavior of the refrigeration units of Gradenigo and that of the ones of the Cellini Clinic before the optimization actions were implemented, thus targeting possibly similar results in terms energy savings after corrective actions are put in place.
The future steps will be to implement the monitoring platform on other Humanitas group sites to drive the overall decrease of energy demand. Another important goal will be to create a database with reference to each structure’s own historical operation data and KPIs, in order to compare different structures and to verify the evolution of energy performance of the buildings through the years, especially considering the scarce availability of consistent benchmarks in literature for hospital facilities.
[1] Masoero M., Vitto S., Azzini S., Bacci M. (2009). I consumi energetici negli ospedali parametrati sui volumi: valutazione di alcune realtà in Piemonte, Lombardia e Liguria (in Italian), AICARR workshop, Milan.
[2] Bagnasco A., Picollo R., Silvestro F., Vinci A. (2012). Miglioramento dell’efficienza energetica in ambito ospedaliero: modello funzionale e caso studio della Clinica Oculistica dell’Università di Genova (in Italian), AIGE Conference, Ferrara.
[3] Bagnasco A., Fresi F., Saviozzi M., Silvestro F., Vinci A. (2015). Electrical consumption fore-casting in hospital facilities: An application case, Energy and Buildings, Vol. 103, pp. 261-270.
[4] Chung W. (2011). Review of building energy-use performance benchmarking methodologies, Applied Energy, Vol. 88, No. 5, pp. 1470-1479.
[5] Christiansen N., Kaltschmitt M., Dzukowski F. (2016). Electrical energy consumption and utilization time analysis of hospital departments and large scale medical equipment, Energy and Buildings, Vol. 131, pp. 172-183.
[6] Belcastro F., Di Santo D., Fasano G. (2010). Benchmark di consumo per diverse tipo-logie di edificio e all’applicabilità di tecnologie innovative nei diversi climi italiani negli edifici ospedalieri, Report ENEA in Italian.
[7] Grassi W., Testi D., Menchetti E., Della Testa D., Bandini M., Niccoli L., Grassini G.L., Fasano G. (2009). Valutazione dei consumi nell’edilizia esistente e benchmark mediante codici semplificati: analisi di edifici ospedalieri, Report RSE/2009/117.
[8] Baldazzi S., Beltrone E., D’alessandris P., Mostacci A., Mura A., Napoleoni D., Pasquino F., Santangelo A., Stemperini A., Toso A. (2014). Rapporto sulla raccolta dati per la determinazione e caratterizzazione delle tipologie di impianto per il condizionamento invernale ed estivo negli edifici ad uso ospedaliero”, Report Rds ENEA.
[9] Chiara Delmastro, Guglielmina Mutani and Stefano Perassi (2016). n use monitoring of public buildings. Case study in North Italy, International Journal of Heat and Technology, Vol. 34, No. Sp. 2. DOI: 10.18280/ijht.34Sp0212