OPEN ACCESS
European and national policies have encouraged the investigation of solutions for the reduction of the energy demand and the improvement of energy efficiency. In particular, in the residential sector the knowledge of actual energy uses represents a key aspect in order to achieve the goals set by European Directives. In such a context, a numerical model, implemented in Excel® and Matlab®, was developed in order to assess the energy consumption for space heating, DHW and cooking in the residential sector, based on a statistical dataset including 20,000 records that was collected by ISTAT in the context of a survey on the energy consumption of Italian families during year 2013. The space heating model is based on the definition and evaluation of classes of dwelling-types, function of the geometrical and thermo-physical properties of the dwellings and of the occupants’ uses. The energy consumption for DHW and cooking are calculated on a record per record basis according to a Standard-based approach. The present study describes the methodology and the main results of the model, which have been compared with the data of the ISTAT survey for each energy use and type of fuel. A detailed validation of the model is currently carried out based on the ISTAT survey.
energy consumption, households, numerical model, residential sector, survey
The regulation (EC) No 1099/2008 of the European Parliament and of the Council of 22 October 2008 on energy statistics, and the amending Commission Regulation (EU) No 431/2014 of 24 April 2014 on energy statistics impose an obligation on Member States to provide annual data on energy consumption of households for final destination and energy source.
ISTAT, in collaboration with ENEA and MiSE (Italian Ministry of Economic Development) carried out a survey on household’s energy consumption [1] to comply the obligation.
The survey was conducted in 2013 on a representative sample of 20,000 households and provided information on characteristics, consumption habits, types of plant and energy costs of Italian households, specified by energy product (primary energy sources and energy carriers) and end-use (heating, cooling, domestic hot water, cooking, lighting and electrical equipment) as requested by European regulation.
In such a context a methodology, based on numerical models implemented in Excel® and Matlab®, was developed in order to assess the energy consumption for space heating, DHW and cooking in the residential sector, based on a statistical dataset from the survey.
Furthermore, this methodology will be used in the activity ENEA-ISTAT to estimate the energy consumption of households for the years between two subsequent surveys.
The proposed methodology consists of a model to estimate the energy consumption for space heating, and a model for DHW and cooking uses.
The model for space heating is based on the equivalent resistance-capacitance model proposed in the European standard EN ISO 13790 [2] and was implemented in Excel®. The input of the model was obtained by the processing of the provided statistical data from the ISTAT 2013 survey [1] and on the identification of dwelling type classes, summarized in Table 1, to represent the Italian residential building stock.
Table 1. Dwelling type classes for the space heating model
|
Type of dwelling |
Year of built |
|||
|
Before 1950 |
1950-1969 |
1970-1989 |
From 1990 |
|
|
S. F. House |
DTC1 |
DTC6 |
DTC11 |
DTC16 |
|
Multif. House |
DTC2 |
DTC7 |
DTC12 |
DTC17 |
|
Gr. Fl. Apt. |
DTC3 |
DTC8 |
DTC13 |
DTC18 |
|
Mid. Fl. Apt. |
DTC4 |
DTC9 |
DTC14 |
DTC19 |
|
Top Fl. Apt |
DTC5 |
DTC10 |
DTC15 |
DTC20 |
Note. S.F. House: single family house; Multif. House: multifamily house; Gr. Fl. Apt.: ground floor apartment; Mid. Fl. Apt.: middle floor apartment; Top Fl. Apt.: top floor apartment.
The numerical model for the determination of the energy consumption for domestic DHW and cooking uses was implemented in the Matlab® environment with a Standard-based approach. The input was obtained from the ISTAT 2013 survey [1]. Moreover, most parameters were taken from the analysis of the state of the art, BATs and a market survey of domestic appliances. The model for domestic DHW production and cooking calculate the energy consumption on a record per record basis. Energy consumption was considered proportional to the number of occupants, corrected in order to account for periods spent away from the home. Therefore, the annual occupation frequency was equal to one for occupants usually living in their home, and less than one for occupants who spent a continuous or cyclic period somewhere else.
2.1 Model for space heating energy consumption
The estimation of the energy consumption for space heating is divided by the model in different stages:
a) calculation of the thermal energy demand, in continuous heating mode, of each dwelling-type in the different climatic zones;
b) calculation, for each dwelling-type class in each climatic zone, of the reduction factor for intermittent heating, based on the average number of daily hours during which the heating system is switched on;
c) assumption of the efficiency of the different types of plant for each dwelling-type class in each climatic zone;
d) calculation of the primary energy demand, in intermittent heating mode, for each dwelling-type class in each climatic zone;
e) estimation of the total annual energy product consumption for space heating for each dwelling-type class on a national basis.
The main information provided by the ISTAT 2013 survey and used for the space heating consumption estimation methodology were:
• dwelling characteristics;
• characteristics of the heating systems;
• frequency of use of the heating systems;
• energy cost by energy product.
The classification of the dwellings was chosen as a function of:
• year of construction: before 1950, 1950-1969, 1970-1989, from 1990;
• type of dwelling: single family house, multi-family house, ground floor apartment, middle floor apartment and top floor apartment.
To perform the calculations in each climatic zone, the input weather data (temperature, radiation and humidity) adopted for the simulations were those of the main town whose degree days are "barycentric" with respect to the degree days interval of the climatic zone.
For further details on the space heating model, a detailed description can be found in [3].
2.2 Model for the DHW production
The energy use for DHW production was estimated either according to the number of occupants or, alternatively, to the floor surface of the apartment. In the former case, the average daily hot water demand per capita was estimated according to the Italian Standard UNI 9182 [4], and calibrated on the records of the survey where LPG was used for DHW and/or for cooking, as described hereafter. In the latter case, the daily how water demand was assessed as a function of the floor surface of the apartment, using a correlation provided by UNI/TS 11300:2 [5]. In both approaches, the energy demand was calculated with a supply temperature of 40°C and a mains water temperature of 15°C.
According to the selected approach, the annual DHW energy demand QDHW was calculated as follows:
- User-based:
$Q_{\mathrm{DHW}}=K_{r} \times n_{o c c}^{*} \times c_{w} \times V_{w, o c c} \times \Delta T_{w} \times 365$ (1)
where Kr is a correction factor provided by [4] which accounts for the number of rooms in the apartment, n*occ is the number of occupants corrected in order to consider the actual frequency of occupation in a year, cw is the thermal capacity of water (1.162·10-3 kWh/(kg K) ), Vw,occ (in litres) is the average daily hot water demand per capita, ΔTw = 25°C is the temperature difference of water, and 365 are the days in a year.
- Floor surface based:
$Q_{\mathrm{DHW}}=c_{w} \times V_{w, a p t} \times \Delta T_{w} \times 365$ (2)
where Vw,apt (in litres) is the average daily hot water demand of the apartment calculated on the useful floor surface of the apartment Sapt according to the following linear correlation with parameters a and b taken from [5] :
$V_{w}=a \times S_{a p t}+b$ (3)
In case solar collectors were installed for DHW production, the annual contribution of solar thermal was estimated by considering the number of solar collectors and the typical design fractions of the DHW loads supplied by solar energy, and it was subtracted from the DHW energy demand in order to estimate the quota supplied by fossil fuels.
The equipment efficiencies were determined according to [5]-[6], as a function of the age and type of the system (stand-alone, independent vs. centralised), and on the fuel.
2.3 Model for cooking uses
The assessment of the cooking annual energy consumption included domestic ovens and hobs. In agreement with Eurostat guidelines [7], auxiliary appliances as microwave ovens, kettles, coffee makers and toasters were not considered, because their use is generally sporadic or limited.
The theoretical basis of the model was found in the EC Regulations No. 65/2014 [8] and 66/2014 [9] on Ecodesign requirements, and Standard EN 60350-2 [9] on methods for measuring the performance of household electric cooking appliances. ISTAT survey provided the type of fuel and the use frequency of ovens and hobs. Additional data available for ovens were the age (regardless of the fuel) and the size (only for electrical ovens), i.e. small, medium or large.
The energy consumption of a single cooking cycle of electrical and gas-fired ovens was calculated starting from the energy consumption to heat up a normalized load in a single cycle (ECoven), according to [8]:
$E C_{\text {cavity}}=E E I_{\text { cavity }} \frac{S E C_{\text {cavity}}}{100}$ (4)
where EEI is the energy efficiency index of the ovens in a single cycle, while SEC is the standard energy consumption required to heat up a normalized load during a cycle, which depends on the energy source and was calculated according to one of the following relations [8]:
- for electrical ovens (in kWh):
SECcavity = 0.0042×V +0.55 (5)
- for gas fired ovens (in MJ):
$S E C=0.0440 \times V+3.53$ (6)
In the previous formulas, V is the volume of the oven cavity, extrapolated from the classes provided by the ISTAT survey: small (assumed 40 L), medium (54 L), and large (65 L). As for the other fuels, no data were available from the survey, hence ovens fueled with gas or LPG were assumed with V = 65 L based on a market analysis. The SEC for LPG ovens was calculated with the same formula of natural gas.
The index EEI, which defines the energy efficiency class of the ovens according to the European classification [8], was estimated on the age of the ovens, i.e. an average EEI value was calculated for each year, weighted on the energy efficiency classes of ovens sold in that year [10]-[11].
Eq. (4) to (6) refer to a normalized cooking cycle, which the model considered equivalent to the energy demand of two occupants. Moreover, the model assumed the energy demand proportional to the couples of occupants in each record. Therefore, it was possible to estimate the annual energy consumption by multiplying the energy demand of all the occupants in a single cycle times the average weekly use frequency of the oven.
A slightly different model was used for the hobs, because no historical data on sales units based on energy efficiency classes were available – hobs were sold without energy labels before 2010. The energy consumption of a single cooking cycle EChob was calculated as the ratio between the energy demand EDhob (theoretic minimum energy in a single cooking cycle) and the average hob efficiency εhob:
$E C_{h o b}=\frac{E D_{h o b}}{\varepsilon_{h o b}}$ (7)
Normalised tests, which include heating up and keeping the temperature for a defined period, represent a typical household cooking process, as stated in [9]. As will be described in the next section, the average mass load per cooking cycle was determined in order to minimise the median deviation between the data from the survey and the results of the model. While EDhob was assumed independent of the fuel (it refers to a normalised load), the efficiency depends on the hob type. Missing the information on the specific technology (e.g. electrical resistance, radiant, induction), electrical hobs were assumed inductive; a market analysis showed that induction hobs currently represents the majority of electrical units sold and the most efficient category, with an estimated average efficiency εhob,ele = 74%. Reference values for the other types of hobs used in the model were: εhob,gas = 40% for natural gas, εhob,lpg = 50% for LPG and εhob,bio = 10% for biomass hobs [12]-[13].
According to Annex I of EC Regulation No. 66/2014 [9] and to a market analysis [11], the normalised energy consumption for induction hobs was assumed EChob,ele = 230 Wh/kg. Therefore, according to Eq. (7), it was possible to calculate the energy demand EDhob and, finally, the energy consumption for the other fuels. Moreover, a direct proportionality between the average load per cooking cycle and the equivalent number of occupants was considered.
Similar to the ovens, the annual energy consumption was calculated by multiplying the energy demand per cycle of the occupants times the average weekly use frequency of the hobs.
3.1 Statistical analysis
The statistical analysis on the ISTAT data showed that the family units in the dataset had a number of components variable between 1 and 12, with an average of 2.63 components per family. In 6.6% of the occurrences at least one component spent away a period of the year.
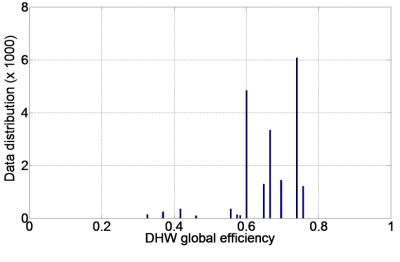
Figure 1. Global efficiency of the DHW systems
As regards cooking appliances, ovens and hobs were present in 93.0% and 98.8% of the records, respectively. If classified according to the fuel, 14.1% of the ovens used natural gas, 80.8% electrical energy, 4.6% LPG and 0.6% biomass (wood log or pellets), while 73% of the hobs used natural gas, 4.4% electricity, 22.2% LPG and 0.4% biomass. On the other side, the main/unique DHW systems can be divided according to the type: centralised (6.8%), independent (75.8%), local (17.5%), and according to the fuel, mainly represented by natural gas (68.2%), diesel oil (4.6%), LPG (9.1%), electrical (12.6%) and biomass (4.1%). Secondary DHW systems were sporadic; hence, they were neglected in the model. The global efficiencies of the DHW systems depend of the age, type and fuel of the system, and were calculated according to [5]-[6], figure 1.
As far as the space heating model is concerned, the data of the ISTAT survey have been used for the definition of the characteristics of the dwelling-type classes, of the heating plant efficiencies for each dwelling-type class, for the reduction factor for intermittent heating, as described in §2.1 and detailed in [3].
3.2 Calibration of the model
The calibration of the model was initially done for cooking uses: the energy consumption was compared with the records of the ISTAT survey where the fuel was used specifically for cooking, in order to avoid approximations due to the extrapolation of the energy consumptions for space heating and DHW. In fact, data disaggregation would involve uncertainties of the same order of magnitude of the energy consumption for cooking. It was not possible to perform such comparison for electricity because the current version of the model does not consider electrical appliances, lighting and space cooling. Moreover, the calibration of the energy model for cooking considered only appliances fueled with LPG, because the number of records where LPG was used exclusively for cooking was statistically more representative than the other fuels. In fact, LPG was used only for cooking in 2,671 records (that is 60.4% of the records where LPG was used for this use), much larger than natural gas (794 over 14,450 that is 5.5% of the records) and biomass (34 over 168 that is 20.2% of the records). Then the main parameters assessed with LPG were applied also to the other cooking appliances regardless of the fuel, because the model makes no distinctions on the cooking habits of the domestic users. In the next step, the model of the DHW production was tuned on the records where the fuel was used for cooking and/or for DHW production, using a larger data set, as reported in Table 2, where column “DHW only” shows the smaller number of records which could be used whether an exclusive use of the fuel for DHW was considered.
Table 2. Number of records used for the model’s calibration
|
Fuel |
Cooking only 1 |
DHW only |
Cooking or DHW 2 |
|
Natural gas |
794 (5.5%) |
114 (0.8%) |
2398 (15.8%) |
|
LPG |
2671 (60.4%) |
231 (12.7%) |
3676 (78.1%) |
|
Diesel oil |
n.a. |
289 (31.5%) |
289 (31.5%) |
|
Biomass |
34 (20.2%) |
28 (3.4%) |
65 (7.0%) |
Notes: 1. Records used for the calibration of the model for cooking uses. 2. Records used for the calibration of the model for DHW production.
As a result of the calibration, the average load per cycle of the hobs – expressed in terms of kg of water heated up according to the standard test procedure described in [9] - was determined by minimising the median deviation between the selected data from the survey and the model, resulting in 1.8 kg of water pro capita. The average value of the daily hot water demand per capita was calibrated on the records of the survey where LPG was used for DHW and/or for cooking. The resulting daily DHW demand per capita resulted equal to 60 L, which is between the demand prescribed by UNI 9182 for social housing (40 to 50 L) and for middle class housing (70 to 80 L). Moreover, the results obtained with this value of daily DHW demand were similar to those obtained with Eq. (2), based on the floor surface of the apartment.
3.3 Comparison with the survey data
Before comparing the results, it was necessary to convert the economic data of the ISTAT survey into energy values. In fact, the survey provided the annual costs from the bill of the main fuels between the second semester of 2012 and the second semester of 2013, without distinction of the type of use. The following unit prices, tax and VAT included, were used for the validation of the models: 0.2089 €/kWh for LPG, 0.27995 €/kWh for electricity, 0.04459 €/kWh for wood logs, 0.06383 €/kWh for pellets and 0.145 €/kWh for diesel oil. As regards natural gas, the unit cost of energy was determined with reference to the economic conditions of the protected market set by the National Authority for the Electrical Energy, the Natural Gas and the Hydro System (AEEGSI) [14] while tax, excise duty and VAT were calculated in the ranges of gas consumption defined by AEEGSI for ordinary statute Regions [14]. The unit costs for gas used in the numerical code, reported in Table 3, represented the average of the single components weighted on the people resident in each Region in 2012 [16]. Then the gross unit cost was calculated by including the average fixed costs for sale (40.34 €/y) and for the network (34.66 €/y), and considering a lower heating value of gas equal to 9.59 kWh/Sm3.
Table 3. Average cost components for natural gas (€/Sm3)
|
Gas Sm3 y |
Sale |
Network |
Excise duty |
Regional surtax |
VAT % |
|
0 - 120 |
0.410 0.410 0.410 0.410 0.410 0.410 |
0.058 |
0.044 |
0.012 |
10% |
|
121 - 480 |
0.201 |
0.175 |
0.018 |
10% |
|
|
481 - 1,560 |
0.176 |
0.170 |
0.019 |
21% |
|
|
1,561 - 5k |
0.172 |
0.186 |
0.019 |
21% |
|
|
5k - 80k |
0.142 |
0.186 |
0.019 |
21% |
|
|
80k - 200k |
0.099 |
0.186 |
0.019 |
21% |
Table 4. Average annual energy consumption per area (kWh/m2 y) for space heating, natural gas as fuel
|
Type of dwelling |
Year of built |
|||
|
Before 1950 |
1950-1969 |
1970-1989 |
From 1990 |
|
|
S. F. House |
263 |
229 |
151 |
145 |
|
Multif. House |
246 |
215 |
144 |
136 |
|
Gr. Fl. Apt. |
163 |
114 |
91 |
97 |
|
Mid. Fl. Apt. |
73 |
58 |
35 |
34 |
|
Top Fl. Apt |
136 |
92 |
79 |
80 |
The average annual energy consumption per area for space heating, for each dwelling-type class on a national basis, is summarized in tables from Table 4 to Table 7, representing the estimated consumption of a single fuel. Regardless of the fuel, the energy consumption per area increases with the age and decreases for the types of dwelling with smaller external surfaces (apartments and middle floor apartment in particular). In addition to the thermo-physical and geometrical properties, which are at the basis of the identification of the dwelling-type classes, the space heating demand estimated by the model is greatly influenced by the geographical distribution of the families involved in the ISTAT survey among the different climatic zones, and by the number of hours of daily usage of the heating plant.
Table 5. Average annual energy consumption per area (kWh/m2 y) for space heating, LPG as fuel
|
Type of dwelling |
Year of built |
|||
|
Before 1950 |
1950-1969 |
1970-1989 |
From 1990 |
|
|
S. F. House |
247 |
178 |
110 |
118 |
|
Multif. House |
241 |
222 |
101 |
106 |
|
Gr. Fl. Apt. |
119 |
67 |
53 |
69 |
|
Mid. Fl. Apt. |
47 |
33 |
23 |
19 |
|
Top Fl. Apt |
82 |
49 |
39 |
45 |
Table 6. Average annual energy consumption per area (kWh/m2 y) for space heating, Diesel oil as fuel
|
Type of dwelling |
Year of built |
|||
|
Before 1950 |
1950-1969 |
1970-1989 |
From 1990 |
|
|
S. F. House |
328 |
274 |
184 |
198 |
|
Multif. House |
307 |
277 |
198 |
199 |
|
Gr. Fl. Apt. |
212 |
127 |
122 |
153 |
|
Mid. Fl. Apt. |
108 |
70 |
40 |
45 |
|
Top Fl. Apt |
158 |
132 |
99 |
175 |
Table 7. Average annual energy consumption per area (kWh/m2 y) for space heating, biomass as fuel
|
Type of dwelling |
Year of built |
|||
|
Before 1950 |
1950-1969 |
1970-1989 |
From 1990 |
|
|
S. F. House |
331 |
255 |
162 |
166 |
|
Multif. House |
296 |
237 |
157 |
173 |
|
Gr. Fl. Apt. |
252 |
161 |
112 |
141 |
|
Mid. Fl. Apt. |
125 |
80 |
49 |
54 |
|
Top Fl. Apt |
189 |
137 |
112 |
126 |
The average (median) annual energy consumption per family calculated by the model for cooking uses was 1,077 kWh for the hobs and 125.6 kWh for the ovens. Regardless of the fuel, the energy required for cooking is equal to:
- For the average family unit: 1,192 kWh (annual) or 3.26 kWh (daily),
- Pro capita: 562 kWh (annual) or 1.54 kWh (daily).
These results are comparable with benchmarks obtained from a literature review. According to [5], the daily energy consumption for the domestic cooking uses of a family unit may follow these rules of thumb: 4 kWh for dwellings up to 50 m2 of floor area, 5 kWh between 50 m2 and 120 m2, and 6 kWh above 120 m2, while the annual energy consumption per capita in the Turin area is about 350 kWh according to [17]. As regards the annual energy consumption of single appliances, electrical hobs (with a total burner heating rate of 3 kW and 45’ average daily use) absorb 1,100 kWh while electrical ovens absorb from 65 kWh to 100 kWh [18]. Among the reasons of the different values reported in the literature, the energy demand is greatly influenced on the frequency of use and length of the cooking cycle.
The average annual consumptions for DHW and cooking calculated by the model, subdivided on a family and per capita level and in function of the fuel, are summarised in Table 8.
Table 8. Average annual energy consumption (kWh y) for DHW and cooking calculated by the model
|
Fuel |
Family |
Per capita |
||
|
|
Cooking |
DHW |
Cooking |
DHW |
|
Electrical |
126 |
1718 |
46.5 |
858.9 |
|
Gas |
1077 |
2114 |
538.5 |
954.3 |
|
LPG |
920 |
2116 |
430.8 |
916.1 |
|
Diesel |
n.a. |
2290 |
n.a. |
1108.2 |
|
Biomass |
5473 |
4581 |
2154 |
1546 |
|
Average |
1192 |
2114 |
562 |
951 |
The comparison between the model and the survey was made on a record per record basis, and the per cent difference was calculated with this relation:
$\Delta E C=\frac{E C_{s}-E C_{m}}{E C_{m}} \times 100$ (8)
where subscript m refers to the results of the model, while subscript s refers to the survey.
Table 9 Median of space heating consumption [kWh y] and of the difference model vs. survey
|
Fuel |
Survey |
Model |
difference [%] |
|
Natural gas |
9552 |
7934 |
20.4 |
|
LPG |
1197 |
3710 |
-67.7 |
|
Diesel oil |
7586 |
8456 |
-10.3 |
|
Biomass |
11100 |
17933 |
-38.1 |
Regarding the space heating consumption, the comparison between the survey data and the data estimated by the model, summarized in Table 9, shows that the model underestimated the energy consumption for natural gas of about 20% and slightly overestimated the consumption of diesel oil (about 10%): this can be considered a promising result; whereas bigger differences are observed for the other fuels. Further analysis is required in order to evaluate the reasons of such differences, but they can be mainly attributed to the following factors:
• the hypothesis of not considering the contribution of any secondary heating device, since the data collected from the survey are not as detailed as required by the model. The consequence is that the implemented model attributes all the heating demand to the main plant, while there may be secondary appliances powered by other fuels suppling a non-negligible amount of the heat, thus varying the actual consumption of the main plant. The presence of secondary heating devices depends on the fuel: 43% for Natural gas fueled main plant, 55% for LPG, 57% for Diesel oil and 71% for biomass.
• the uncertainty derived by the estimation of the energy consumptions from the survey, based on economic data.
• the thermo-physical characteristics of the dwelling-type classes (opaque envelope type, transparent envelope type, thermal capacitance) were obtained by technical standards at the national level, while there can be significant regional and local differences.
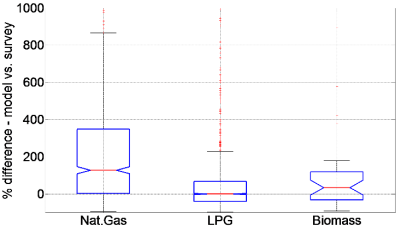
As far as the cooking and the DHW models are concerned, the synthetic results of the comparison between the calculated energy consumption and the “actual” energy consumption are depicted in Figure 2 for cooking only. The boxplots represent the interquartile ranges while the red line represent the median for each distribution. The differences are also summarised in Table 10.
Figure 2. Difference model vs. survey for cooking
Table 10. Median of the difference model vs. survey, cooking uses and DHW production
|
Fuel |
Cooking only |
DHW only |
Cooking or DHW |
|
Natural gas |
127.5% |
122.9% |
74.5% |
|
LPG |
0.0% |
69.1% |
-7.4% |
|
Diesel oil |
n.a. |
226.2% |
226.2% |
|
Biomass |
34.3% |
339.8% |
93.3% |
The median difference between the results of the model and the ISTAT survey for LPG is -7.4%, that is the model slightly overestimated the energy consumption for DHW and/or cooking. Higher values were obtained for the other fuels. As regards cooking only, the median value is equal to +127.5% for natural gas and +34.3% for biomass, that is the model underestimates the energy consumption extrapolated from the survey. Further analysis is required in order to evaluate the reasons of such large differences. Focusing on gas, many records in the survey were characterised by consumptions unusually high for uses limited to cooking, i.e. above 5,000 kWh/pers. A possible explanation may be the contribution of secondary equipment for space heating, which was not evaluated by the space heating model, which considered only the principal/unique generation system. As regards biomass appliances, no standard test procedures were found to support the implemented model, moreover cooking appliances generally are also used for space heating and such effect is difficult to quantify.
Table 11. Median of the aggregate energy consumption (kWhy) and difference model vs. survey
|
Fuel |
Survey |
Model |
Difference [%] |
|
Natural gas |
9553 |
10161 |
-6.1 |
|
LPG |
1340 |
1718 |
-22.0 |
|
Diesel oil |
8965 |
10851 |
-17.4 |
|
Biomass |
12950 |
19962 |
-35.1 |
Considering the estimated aggregate energy consumption for space heating, cooking uses and DHW production on a national basis, as summarized in Table 11, the proposed model slightly overestimated the energy consumption for natural gas (of about 6%) that is the fuel representing approximately 65% of the total energy consumed according to the ISTAT 2013 survey. The overestimation for the other fuels varied between approx. 22% and 35%.
The results of the models and the comparison between models and survey, both at single-use and at aggregate level, also provided useful elements for the update of the next survey in order to achieve additional information allowing a further improvement of the models themselves.
The implementation of a methodology for the estimation of the energy consumption for space heating, DHW and cooking in the residential sector was presented.
The energy consumption for space heating was based on the equivalent resistance-capacitance model proposed in the European standard EN ISO 13790 and was implemented in Excel®, with inputs based on dwelling-type classes identified on the ISTAT 2013 survey data. The model show promising result as far as natural gas and diesel oil are concerned.
The energy consumption for DHW and cooking was modelled in the Matlab® environment using a Standard-based approach, and results were compared on a record basis on the ISTAT survey, and with benchmarks found in the literature.
As far as the aggregate energy consumption for space heating, cooking uses and DHW production on a national basis, the model slightly overestimated (about 6%) the natural gas consumption which represents a share of approx. 65% of the total energy consumed according to the ISTAT 2013 survey
Future works will focus on the reduction of the deviation between the model and the survey, by considering the impact of secondary equipment for space heating, and possibly by refining the analysis at a regional scale.
This research was part of the "Electric System Research" project, implemented under the 2015-2017 Programme Agreement between the Italian Ministry for Economic Development and ENEA.
|
c |
thermal capacity, kJ.Kg-1.K-1 |
|
EC |
energy consumption, kWh or MJ |
|
ED |
energy demand, KWh or MJ |
|
EEI |
energy efficiency index, dimensionless |
|
n |
number of persons |
|
Q |
thermal energy, kWh or MJ |
|
S |
floor surface, m2 |
|
SEC |
standard energy consumption, kWh or MJ |
|
T |
temperature, K |
|
V |
volume, m3 |
|
Greek symbols |
|
|
ε |
efficiency |
|
Subscripts |
|
|
apt |
apartment |
|
m |
model |
|
occ |
occupants/persons |
|
s |
survey |
|
w |
water |
[1] ISTAT. (2013). Indagine sui Consumi Energetici delle Famiglie, Istituto Nazionale di Statistica.
[2] Energy performance of buildings - calculation of energy use for space heating and cooling. (2008). EN ISO 13790 Standard.
[3] Puglisi G., Zanghirella F., Ungaro P., Cammarata G. (2016). A Methodology for the generation of energy consumption profiles in the residential sector, International Journal of Heat and Technology, Vol. 34, No. 3, pp. 491-497. DOI: 10.18280/ijht.340320
[4] Impianti di alimentazione e distribuzione d'acqua fredda e calda-Progettazione, Installazione e Collaudo, Italian, UNI Standard 9182.
[5] Prestazioni energetiche degli edifici-Parte 2: Determinazione del fabbisogno di energia primaria e dei rendimenti per la climatizzazione invernale, per la produzione di acqua calda sanitaria, per la ventilazione e per l'illuminazione in edifici non residenziali, UNI/TS Standard 11300-2.
[6] Prestazioni energetiche degli edifici - Parte 4: Utilizzo di energie rinnovabili e di altri metodi di generazione per la climatizzazione invernale e per la produzione di acqua calda sanitaria (2012). UNI/TS Standard 11300-4.
[7] Eurostat. (2013). Manual for statistics on energy consumption in households, from http://ec.europa.eu/eurostat/documents/3859598/5935825/KS-GQ-13-003-EN.PDF/baa96509-3f4b-4c7a-94dd-feb1a31c7291
[8] Commission Delegated Regulation (EU). (2014). No 65/2014 of 1 October 2013 supplementing directive 2010/30/EU of the European Parliament and of the Council with regard to the energy labelling of domestic ovens and range hoods, Official Journal of the European Union.
[9] Commission Regulation (EU). (2014). No 66/2014 of 14 January 2014 implementing Directive 2009/125/EC of the European Parliament and of the Council with regard to eco-design requirements for domestic ovens, hobs and range hoods, Household electric cooking appliances - Part 2: Hobs - Methods for measuring performance, Official Journal of the European Union, CEI EN Standard 20350-2, 2013.
[10] Presutto M., Villani M.G., Scarano D., Fumagalli S. (2010). Il mercato degli elettrodomestici e la sua evoluzione temporale, Report RdS/2010/255, from http://www.enea.it/it/Ricerca_sviluppo/documenti/ricerca-di-sistema-elettrico/tecnologie-riduzione-consumi/5-rapporto-indagine-mercato.pdf
[11] Forni Elettrici a Incasso, from www.eurotopten.it
[12] Hager T.J., Morawicki R. (2013). Energy consumption during cooking in the residential sector of developed nations: a review, Food Policy, Vol. 40, pp. 54-63. DOI: 10.1016/j.foodpol.2013.02.003
[13] DOE. (2012). Energy conservation program: test procedures for conventional cooking products, from https://energy.gov/sites/prod/files/2015/06/f23/conventional_ovens_tp_finalrule.pdf
[14] AEEG. (2016). Condizioni economiche di fornitura del gas naturale per il servizio di tutela, from http://www.autorita.energia.it/it/dati/condec_gas.htm
[15] AEEG. (2016). Imposte sul gas, from http://www.autorita.energia.it/it/dati/gp30.htm
[16] Statistiche demografiche delle Regioni, from http://www.tuttitalia.it/statistiche/
[17] Fracastoro G.V., Serraino M. (2009). Valutazione delle prestazioni energetiche degli edifici alla scala provinciale, from http://www.provincia.torino.gov.it/ambiente/file-storage/download/energia/pdf/relazione_polito_eff_finale.pdf
[18] Conti P., et al. (2011). Definizione di una metodologia per l'audit energetico negli edifici ad uso residenziale e terziario, Report RdS/2011/143, 2011, from http://www.enea.it/it/Ricerca_sviluppo/documenti/ricerca-di-sistema-elettrico/risparmio-energia-settore-civile/rds-143.pdf
[19] Spoladore A., Borelli D., Devia F., Mora F., Schenone C. (2016). Model for forecasting residential heat demand based on natural gas consumption and energy performance indicators, Appl. Energy, Vol. 182, pp. 488-499.