OPEN ACCESS
Gasification of biomass has the potential to become a relevant technology for a sustainable future. However, the content of tar in the gas produced through gasification needs to be managed properly in order to increase the reliability of the technology. Accurate measurement of tar gas concentrations enables management and technology improvement. Standardized offline measurement methods require a long time to produce a numerical result from a test. This work presents a novel colorimetric method to assess the tar concentration contained in syngas. The method uses an apparatus that includes a heated thimble filter (to remove particulate), gas quenching with isopropyl alcohol (IPA), a vapor knockout and cooling system including a final stage fritted glass bubbler/impinger, IPA removal via a peristaltic pump controlled by a capacitive level sensor, IPA flow metering, colorimeter for IPA/tar solution light absorbance measurement, and gas pumping/metering circuit. The method is robust and fast because it is based on a continuous light absorbance measurement. The system was compared against the tar protocol standard showing good correlation between average absorbance and tar concentration. Results demonstrate the capability of the proposed method to give continuous real-time measurement of the tar concentration in the gas.
biomass, gasification, syngas, tars, light absorbance
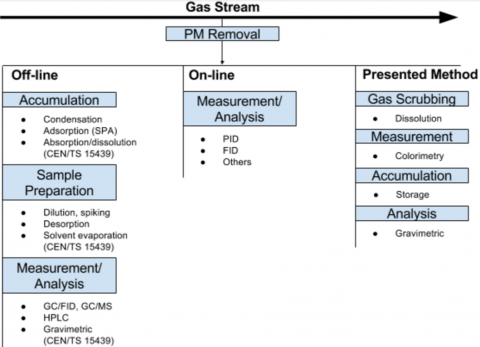
Tar concentration in the gases (syngas) produced by gasification systems is a significant issue that impacts system reliability and cost [1]. Tars are organic compounds with a molecular weight higher than benzene [2]. Tars are commonly divided into two groups: light tars and heavy tars. Light tars are organic compounds that can be analysed with gas chromatography (GC) as well as High Performance Liquid Chromatography (HPLC) (molecular weight = 79-300 g/mol). They are volatile, semivolatile, aromatics and phenolics [3]. Heavy tars are organic compounds which boil at high temperatures. As a result, heavy tars must be analysed by HPLC as opposed to GC-MS [3]. They are mixtures of high molecular weight “non-volatile” polar compounds (molecular weight >300 g/mol) [3]. The total tar amount is the sum of light and heavy tars. Tars are commonly carried in the syngas generated by the gasification reaction. Depending on the gasifier architecture, the tar concentration, defined as the mass of tar contained in one normal meter cubed of syngas, ranges from 0.5-50 g/Nm3. This value is too high for use the syngas as fuel for internal combustion engines and turbines to produce power. To support these systems, an effective filtration system is needed to reduce the concentration of tar in syngas to levels ranging from 0.05-0.1 g/Nm3 [1-3]. An assessment of the total amount of tar and an evaluation of the tar species in syngas is vital to design and testing of a gasifier and/or a filter system. In addition, a proper evaluation of the tar concentration contained in syngas prior an engine air fuel mixing system is critical to reduce engine maintenance [3]. Several tar testing methods are described in literature [4-9]. The methods can be classified in two groups: online and offline. Online methods provide real time results about syngas tar concentration, offline methods are complex but more precise and they need hours to obtain results. For an analysis method, tars are generally collected from a slipstream of syngas at a desired location with the desired sampling method (i.e. offline, online). Figure 1 compares offline and online methods. Offline tar analysis methods generally use the following procedure:
1) Gas conditioning: primarily particulate removal
2) Accumulation: the collected tars are extracted to or dissolved in an appropriate solvent and optionally stored for further chemical analysis
3) Sample Preparation: may involve dilution, desorption, or solvent evaporation.
4) Measurement/Analysis: most common analytical techniques are based on gas chromatography (GC), high pressure liquid chromatography (HPLC) and gravimetric analysis
Online tar analysis methods generally use the following procedure:
1) Gas conditioning: primarily particulate removal, other conditioning such as drying of gas etc. may be required depending on the analytical technique
2) Measurement/analysis: a variety of measurement methods have been explored and used, including photo-ionization detection (PID) and flame ionization detection (FID).
A common off-line tar sampling method used in industry and research was developed and supported by several research institutions and government agencies: IEA Bioenergy Task 33, US DOE and European Commission 1998-2005 [4]. The tar sampling method is referred to as the standard or CEN/TS 15439 method in the present work. The tar sampling method developed is considered a European standard in monitoring performance of gasification systems. The procedure for the standard sampling method begins by extracting a slipstream of syngas from a gasification system at a desired location. The syngas is mixed with a solvent, which is usually IPA, in order to extract all of the tars from the syngas into the solvent. After the tar has been collected, the solvent is evaporated. Mass measurements are taken to obtain gravimetric tar amounts. Finally, tar composition is evaluated by GC-MS. GC-MS evaluates both light and heavy tars. However, there are caveats when using GC-MS methods to evaluate tars: the method is time consuming, large amounts of solvent are needed, and the method is not suitable for low tar concentrations [4].
Solid Phase Adsorption (SPA) is an offline method developed by KHT in the 1990’s [5]. This method uses an amino phase adsorbent in order to trap aromatic hydrocarbons and phenols that are called GC-available (GA) compounds. At 900 °C and above the GA-compounds roughly correspond to the total tar amount [5]. These compounds are subsequently desorbed and analysed in GC-FID gas chromatographer with FID. SPA method advantages are: ease of use, quick response, low cost, high accuracy, and reproducibility. In addition, sampling and analysis can be done separately. However, this method is not suitable for heavy tars. Light compounds like benzene, toulene and xilene (BTX) must be analysed within a few hours in order to avoid their dispersion from the amino phase adsorbent. To overcome this issue, Brage et al. applied a further adsorbent for BTX in line with the amino phase [6].
Solid Phase Micro Extraction (SPME) developed by BRISK is another offline method used to analyse tars [7]. It is based on the extraction of analytes from a sample matrix onto a stationary phase (non polar) - silica fibre with 50 μm polydimethylsiloxane (PDMS) and on a desorption of the analytes in an analytical instrument (GC). The method was developed for low tar content analysis, furthermore analysis at trace levels (e.g., below 0.1 mg/Nm3) will be possible at 60 °C for all compounds heavier than naphthalene [7].
Standard online tar methods are the Flame Ionization Detector (FID) or Photo-ionization Detector (PID). FID methods can determine: total hydrocarbon concentration, non-condensable hydrocarbon concentration, and tar concentration [8]. The method is based on the difference of two measurements of the organically bound carbon in the sample gas. The sample gas is divided into two sample loops with equal flow rate and cross sectional area. One loop serves as a calibration where the gas is cooled and all tar is removed by a filter. The second loop is unfiltered gas which is measured. The difference between the measurements of the two sample loops gives the amount of tar.
A prototype of an online FID analyzer was developed by Gredinger et al. [8]. The method is easy to use and it provides accurate results in comparison with tar sampling standard [4]. The choice of a suitable tar filter material for the calibration measurement was identified as one of the major challenges to gain realistic results [8].
The PID method is under development by KHT [9]. It is based on the ionization of specific tar compounds that require little energy, in particular aromatic compounds with ionization potential lower than 8.4 eV can be detected, e.g. naphthalene, acenaphthene, fluorene, anthracene and pyrene [9,10].
The current work presents an innovative on-line tar testing method for analysis of tars created by gasification systems. The method is resumed and compared to literature methods in Figure 1. Syngas that uses IPA to dissolve and trap tars in a sample stream. The transmissivity and absorbance of the sample is continuously detected by a colorimeter that gives a signal proportional to the tar content into the sample. The accumulated tar sample can be evaporated and measured gravimetrically to correct absorbance measurements to the gas concentration. Results from this method were evaluated by comparing results using the standard method [4] for gravimetric tar concentration.
Figure 1. Comparison of off-line, on-line, and the presented method stages (modified from [11])
2.1 Facility
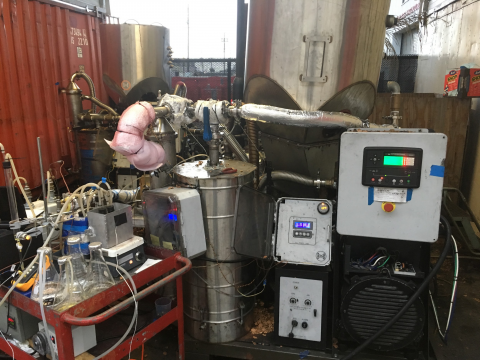
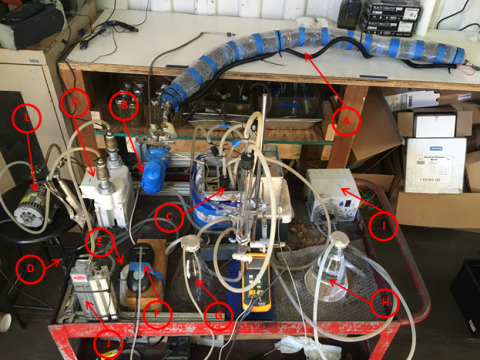
Testing was conducted at ALL Power Labs, Berkeley, CA. Gas was sampled from an 18 kW ALL Power Labs Power Pallet with a version 5 gasifier running on walnut shells. Gas was sampled after the gasifier but before any filtration. The Power Pallet with the on-line tar tester is shown in Figure 2. The on-line tar testing apparatus is a continuous tar testing system. The system scrubs tar from a slipstream of syngas and dissolves the tar into IPA, the tar/IPA solution concentration is then measured with a colorimeter in real time. The physical system is shown in Figure 3.
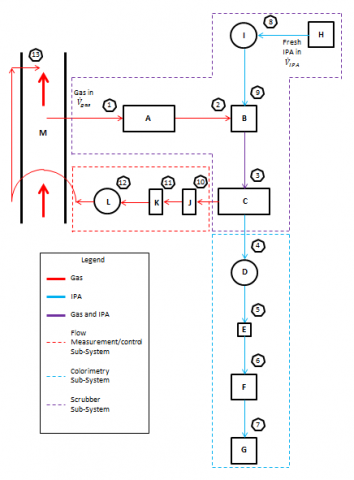
The system is divided into three physical sub-systems: gas scrubbing, colorimetery, and flow measurements/control (Figure 4).
Figure 2. ALL power labs power pallet with on-line tar tester
Figure 3. Photograph of on-line tar tester
The system illustrated in Figure 4 is comprised of the following in detail:
• Heated extraction tube and heated thimble filter (A) which are both maintained at 300°C to avoid condensation of tar from the sampled gas stream.
• A mixing chamber (B) where the IPA and the syngas begin mixing.
• A main scrubber/separator (C) where the syngas is scrubbed of all tar and separated from the IPA/tar mixture.
• A capacitive level sensing peristaltic pump (D) where the IPA/tar mixture volume in the scrubbing system is held constant and pumped to the colorimeter.
• A syringe filter (E) where fine particulate with sizes of 0.2 m and larger are removed.
• A LED colorimeter (F) which is the instrument used to detect absorbance or tar concentration.
• An IPA/tar mixture catch (G) where the IPA/tar mixture is stored for further analysis.
• IPA storage (H) where fresh 99.5% IPA is stored.
• A metering peristaltic pump (I) where IPA from the IPA storage is pumped into the mixing chamber.
• Rotameter (J) which is the instrument to measure syngas flow rate through the on-line tar testing system in real time.
• A dry gas meter (K) which measures the total volume of syngas to passing through the on-line tar testing system.
• A gas pump (L) which pumps syngas from the gasification system, through the on-line tar tester, and back into the gasification system.
• The extraction port/sampling location (M) is placed in line with the gas stream for non-isokinetic sampling from the center of the gas stream provides the site were scrubbed syngas is returned to the gasification system for safety.
Figure 4. OLTT system flow diagram
The gas scrubber subsystem has two main purposes. First, it provides particulate matter filtration of the gas stream. Secondly, it dissolves (scrubs) tars in the gas stream into a constant stream of tar/IPA solution for downstream analysis.
The particulate filtration is accomplished with a thimble filter (Advantec item number 86R, 30 mm ID, 34 mm OD, 100 mm long). The thimble filter has a 99.9% collection efficiency for particulate of size 0.3 μm or larger. The thimble filter is heated to 300 °C to avoid condensation of tars on the filter and filter holder walls. Immediately after the particulate filtration IPA is injected into the mixing chamber to begin the scrubbing process. The IPA is injected into the mixing chamber by a metering peristaltic pump. At this point both the IPA and syngas are transported through the scrubber as an intermittent sputter. The scrubbing process continues into the main scrubbing unit which is comprised of a knockout tube and four fritted glass columns which enhance gas scrubbing by inducing fine bubbles in the syngas/solution as it passes through the columns. The fritted glass columns are divided into hot and cold stages. All of the components in the scrubber are connected in series. Two columns are submerged into a hot bath at 40° C and two columns are submerged in an ice bath at 0° C along with the knockout tube. The syngas/solution is alternated between the hot and cold columns to further enhance gas scrubbing. A separator is used to separate the solution from the scrubbed syngas. The separator is a long column with the solution injected midway through, gas extracted from the top, and IPA extracted from the bottom of the column.
The purpose of the colorimetry sub-system is to extract the solution from the scrubber sub-system and collect absorbance data by passing the solution through the colorimeter instrument. The colorimetry sub-system is comprised of a peristaltic pump/capacitive level sensor, a secondary particulate filter, a colorimeter, and a solution storage vessel. The solution is extracted from the bottom of the separator by a peristaltic pump. The pump is activated by a capacitive level sensor attached to the separator and maintains the solution at a fixed level in the separator. The solution passes through a secondary particulate filter (0.2 µm polycarbonate syringe filter) which ensures that any remaining fine particulate is removed. Following the syringe filter is the colorimeter.
The LED colorimeter (Vernier, 1 cm pathlength) measures the transmittance and/or absorbance of radiation passing through a sample (e.g. the solution). Absorbance is measured at around 435 nm (violet). The colorimeter and a polycarbonate cuvette were modified to allow a continuous stream of solution to pass through the colorimeter and cuvette. Lastly, after passing through the colorimeter, the mixture flows to the storage vessel (1000 mL erlenmeyer flask) for gravimetric analysis.
The flow measurements/control sub-system maintains, controls, and measures the flow of syngas through the system. It is comprised of a rotameter, a dry gas meter, and a rotary vane gas pump. The rotameter (Dwyer RMB-52D, 2-24 L/min air) is used to set and maintain the gas flow rate through the system. A vacuum gauge is attached just upstream of the rotameter to measure the pressure of the syngas entering the flow measuring devices. The dry gas meter (CleanAir 9822) is used to measure the total gas volume (liters) that passes through the system, a reading is taken at the start and end of the test, the difference in the readings is the total volume of syngas that passed through the system. The rotary vane gas pump (Graseby model number 10-709) provides a constant flow rate of syngas through the system.
Gravimetric analysis is used to determine the overall mass of tar contained in a quantity of solution. Gravimetric analysis is conducted by evaporating the IPA in a boil down and oven stage, leaving a mass of tar in a weighing dish that can be measured with a scale. The process starts by transferring the solution from the storage vessel to a boiling flask (1.0 l). The mixture is heated to the boiling point of IPA (82.6°C) and the vaporized IPA is condensed for reuse. Boiling is stopped by a capacitive sensor when approximately 100 mL of the concentrated solution remains. The solution is then transferred to a weighing dish and placed into an oven heated to 105°C to evaporate any IPA and/or water remaining. After 24 to 48 hours, mass measurements are obtained by an analytical balance scale (0.1 mg precision). The gravimetric measurements obtained are very similar to the standard method. The only difference between the two methods are a fixed volume of IPA is analysed for the standard method whereas a variable volume of IPA is used for the online tar test.
2.2 Calculations
The calculated tar concentration (\rho_{G}) [mg/Nm3] in the syngas:
\rho_{G}=\frac{m_{f}-m_{t a r e}}{C_{D}\left(V_{f}-V_{i}\right)} (1)
where m_{f} is the final mass of the tar and weighing dish, m_{t a r e} is the tare mass of the weighing dish, V_{f} \text { and } V_{i} are the final and initial volume measurements from the dry gas meter and C_{D} is a correction factor for the total volume passed through the dry gas meter from operating to normal conditions. The correction factor (C_{D}) is derived from the ideal gas law:
C_{D}=\frac{T_{n c} P_{o c}}{P_{n c} T_{o c}} (2)
where, T_{n c} \text { and } P_{n c} are temperature and pressure at normal conditions (1 atm, 25 °C) respectively. T_{o c} \text { and } P_{o c} are temperature and pressure at operating conditions respectively. The syngas is assumed to be a perfect gas.
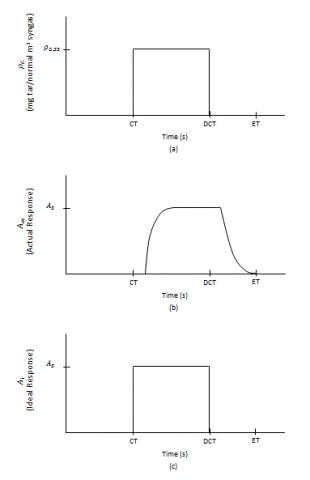
Figure 5. (a) True input of tar in syngas with respect to time, (b) Actual system response as a function of time, (c) Ideal system response as a function of time.
Figure 5(a) illustrates an ideal true tar/syngas input. The syngas that is introduced to the system at time CT contains a constant value of tar at all times. Figure 5(b) illustrates an actual colorimeter reading or response of the system due to the input illustrated in Figure 5(a). The step response behaviour is due to holding volumes within the system. Ideal colorimeter reading from a perfect system due to an input illustrated in Figure 5(c). A perfect system would be a system that responds immediately and completely to any input. Such a system would yield a response similar in shape to the input as shown by comparing Figures 5(a) and 5(c). Therefore, the response of the system must be proportional to the input.
Average tar concentration in syngas during a test (\overline{\rho}_{G}) is found:
\overline{\rho}_{G}=\rho_{G}=\frac{1}{(D C T-C T)} \int_{C T}^{D C T} \rho_{G}(t) d t (3)
where, DCT is the disconnection time of the input, CT is the connection time of the input, \rho_{G}(t) is the tar concentration in syngas as a function of time (Figure 5(a)). The average tar concentration of the input (\overline{\rho}_{G}) is set equal to the gravimetric tar concentration from the test due to conservation of mass. The average absorbance value from actual colorimeter (\overline{A}_{a c}) readings for the period between CT and DCT is found:
\overline{A}_{a c}=A_{s}=\frac{1}{(D C T-C T)} \int_{C T}^{E T} A_{a c}(t) d t (4)
where E T is the time at which the test has ended, A_{a c}(t) is the actual absorbance data from the colorimeter expressed as a function of time, and A_{S} is the steady state absorbance value. The average absorbance value from an ideal system for the connected time period (\overline{A}_{i}) is found:
\overline{A}_{i d}=A_{s}=\frac{1}{(D C T-C T)} \int_{C T}^{D C T} A_{i d}(t) d t (5)
where A_{i}(t) is the absorbance data from an ideal system expressed as a function of time. The total area under the curves shown in Figures 5(b) and 5(c) are equal assuming no losses, and the average can be found by dividing by the same period of time, therefore, the average absorbance value from actual data is equal to the average absorbance value from ideal data:
\overline{A}_{a c}=\overline{A}_{i d} (6)
Figure 6. (a) Absorbance vs tar number in syngas, (b) Absorbance vs tar number in IPA
Eq(4) has limits of integration from CT to ET in order to obtain the tar concentration. Eq(4) has a denominator of DCT-CT. As a result of dividing by DCT-CT, the average obtained by Eq(4) is actually the average of an ideal system response or the steady state value \left(A_{s}\right) for a single input. It is important to note that the steady state value cannot be used if more than one input is introduced, but the integration still holds true.
Figure 6(a) illustrates Beer’s law [12] which states the absorbance in the approximate range 0-1 of a substance is proportional to the concentration. Figure 6 (b) illustrates Beer’s law similar to Figure 6(a) with the exception of the vertical axis. The vertical axis in Figure 6(b) represents tar concentration in IPA.
The average actual (\overline{A}_{a c}) or ideal colorimeter absorbance (\overline{A}_{i d}) will be proportional to the average tar concentration in syngas \left(\overline{\rho}_{G}\right) or to the gravimetric tar concentration in syngas (\left(\rho_{G}\right)):
\left(\overline{A}_{a c}=\overline{A}_{i d} \propto\left(\overline{\rho}_{G}=\rho_{G}\right)\right (7)
Note that Eq(7) is a reformulation of Beer’s law for gas concentration. Eq(8) states the average actual or ideal colorimeter absorbance will be proportional to the average tar concentration in IPA (\rho_{L}):
\overline{A}_{a c}=\overline{A}_{i d} \propto \rho_{L} (8)
Eq(8) also represents Beer’s law for liquid concentration. The concentration of tar in syngas (\rho_{G}) and IPA (\rho_{L}) are found:
\rho_{G}=k_{G} \overline{A}_{a c} (9)
\rho_{L}=k_{L} \overline{A}_{a c} (10)
where k_{G} is the slope of the curve illustrated in Figure 6(a) and k_{L} is the slope of the curve illustrated in Figure 6(b).
Solving Eq(9) and Eq(10) for A_{a c} and setting both equations equal to each other and solving for the concentration of tar in syngas \left(\rho_{G}\right) yields:
\overline{\rho}_{G}=\rho_{G}=\frac{\rho_{L}}{k_{L}} k_{G} (11)
By solving Eq(10) for \overline{A}_{a c} and dividing Eq(11) by \overline{A}_{a c} the slope of the curve illustrated in Figure 6 (a) is found:
k_{G}=\left(\frac{\rho_{L}}{k_{L}} k_{G}\right) / \overline{A}_{a c}=\rho_{G} / \overline{A}_{a c} (12)
The slope \rho_{G} may be used to determine the tar concentration as a function of time given the absorbance as a function of time, or the instantaneous real-time colorimeter measurements shown in Figure 5(b). The instantaneous tar concentration (\rho_{i n s t}) is found:
\rho_{i n s t}=\frac{\rho_{G}}{\overline{A}_{a c}} A_{i n s t} (13)
where, \overline{A}_{a c} is the average absorbance value from the colorimeter data over one test as defined above, A_{i n s t} is the instantaneous absorbance value given by the colorimeter, and \rho_{i n s t} is the instantaneous tar concentration in syngas.
Assuming Beer’s law holds true, the instantaneous tar number is determined by linearly mapping the absorbance reading from the colorimeter to the ratio of the gravimetric tar concentration in syngas to the average absorbance value from the tar test. System response was modeled with a first order differential equation with dead time resulting from a unit step input when the system is connected to the gas stream
\rho(t)=K u\left(t-\tau_{d}\right)\left(1-e^{-\left(t-\tau_{d}\right) / \tau}\right) (14)
where, \rho(t) is the concentration of tar as a function of time, K is the DC gain of the system, \tau is the time constant, \tau_{d} is the dead time, u is the unit step function, and t is the time. The 90% response time (t_{R}) is found by calculating the required time to achieve 90% of the steady state value:
t_{R}=-l n\left(\frac{0.9-1}{-1}\right) \tau+\tau_{d} (15)
A test was conducted, with syngas flow rate of 10 l/min, IPA flow rate of 5 ml/min. Gas sampling was conducted for 60 minutes. Comparisons between the standard method (green), colorimeter absorbance data (Eq(13) (blue)), and modeled first order response (Eq(14) (violet)) are shown in Figure 7.
The standard method measurement was independently conducted in parallel following testing procedures and guidelines similar to the standard method [4] over the interval of time from CT to DCT. The modeled response, calculated through Equation 14, was manually fitted with parameters K, and \tau and \tau_{d}.
Figure 7. Experimental test: System and modeled responses and standard method
Table 1. Fitting parameters of the mode
|
Term |
Value |
|
\tau_{d} |
522 s |
|
\tau |
531 s |
|
t_{R} |
1745 s |
|
K |
787 |
|
\rho_{G, S S} |
765 mg/Nm3 |
The modeled and actual responses shown closely resemble each other. By assuming the theoretical response is a good approximation of the system response, the key parameters in Table 1 can be applied to the system responses.
The actual response curve follows what is a typical first order response due to an impulse from syngas injected into the system between time DCT and CT. Dead time is present between time CT and the point at which an increase in tar concentration is first visible. The time to reach 90% of steady state (t_{R}) is approximately 30 minutes and ignoring deadtime the 90% response occurs within roughly 20 minutes (t_{R}-\tau_{d}).
Small dips in measured tar concentration approximately every minute correspond to the capacitive level sensing peristaltic pump cycling on and off. The quasi-steady state value in both figures is not truly at steady state and can be explained by fluctuations of tar concentration from the input gas stream. Measured values before 1000 sec come from startup of the test where residual tar in the scrubbing subsystem is eluted by the flow of pure IPA.
The measured concentration drops to zero once the tar concentration approaches a value of approximately 50 mg/Nm3 due to the colorimeter and the limit of detection for the colorimeter. Theoretically, the limit of detection for the system can be adjusted by altering the ratio of syngas to IPA flows. A 4.49% percentage difference between the steady state system response and the standard method was found for the test. The small percentage difference shows good agreement between the online test results and the standard method. Good agreement between the online tar test and the standard method shows the online tar test is accurately measuring tar concentration in the gasification system. The system and model developed in this work provide several avenues for further research:
1)More testing is need to determine consistency across system parameters.
2)Develop methods to detect tar concentration below 50 mg tar/Nm3.
3)Modify apparatus to decrease system response time and dead time.
4)Reduce possible sources of error associated with the online tar test: IPA vapor loss, system air leaks, inadequate scrubber efficiency.
5)Develop a physical system model and investigate possible 2nd order system responses.
6)Determine error bounds and uncertainty associated with the online tar test.
The following conclusions can be drawn from the system and model developed in this work:
1)Low system cost.
2)Relatively fast response time compared with other methods.
3)The accumulated tar sample can be quantified with the commonly used gravimetric method, yielding a similar mass measurement vs. other tar detection techniques. The accumulated sample may also be used for further tar species identification.
4)The online tar test accurately describes tar concentration in gasification systems and compares well with standard tar sampling methods.
5)A first order response approximates the system response and can be used to fit system parameters.
|
C |
correction factor |
|
m |
mass |
|
k |
slope of the curve |
|
K |
DC gain |
|
P |
pressure |
|
t |
time |
|
T |
temperature |
|
V |
volume |
|
Greek symbols |
|
|
ρ |
tar concentration [mg/Nm3] |
|
τ |
time constant |
|
Subscripts |
|
|
ac |
actual |
|
CT |
connection time |
|
d |
dead time |
|
D |
dry |
|
DCT |
disconnection time |
|
f |
final |
|
G |
gravimetric |
|
i |
initial |
|
id |
ideal |
|
L |
referred to IPA solution |
|
nc |
normal conditions |
|
oc |
operating conditions |
|
R |
response |
|
s |
steady state |
|
tar |
tare |
[1] Handbook of Biomass Gasification (2005). 2ed, BTG, Enschede, The Netherlands.
[2] Basu P. (2013). Biomass gasification, pyrolysis and torrefaction, Elsevier.
[3] Milne T.A., Evans R.J., Abatzoglou N. (1998). Biomass gasifier tars: Their nature, formation, and conversion, National Renawable Energy Laboratory, Cole Boulevard Golden, Colorado, NREL/TP-570-25357
[4] Biomass gasification - Tar and particles in product gases (2006). CSN P CEN/TS 15439.
[5] Brage C., Yu Q., Chen G., Sjöström K. (1997). Use of amino phase adsorbent for biomass tar sampling and separation, Fuel, Vol. 76, No. 2, pp. 137-142. DOI: 10.1016/S0016-2361(96)00199-8
[6] Brage C., Yu Q., Sjöström K. (2007). A new method for the analysis of heavy tar in raw producer gases from biomass gasifiers, Proc. of 15th European Biomass Conference & Exhibition, Berlin, Germany.
[7] De Jong W., Engvall K., Retschitzegger S., Brink A., Biollaz S., Martin A. (2015). Brisk: Devolpment of advanced measurement methods and operational procedures in thermochemical biomass conversion, Proc. of 18th IFRF Membres Conference, Germany.
[8] Gredinger A., Schweitzer D., Dieter H., Scheffknecht G. (2016). A measurement device for online monitoring of total tar in gasification systems, Journal of Energy Resource Technology, Vol. 138, No. 4. DOI: 10.1115/1.4032730
[9] Ahmadi M., Knoef H., Van de Beld B., Liliedahl T., Engvall K. (2013). Development of a PID based on-line tar measurement method – proof of concept, Fuel, Vol. 113, pp. 113-121. DOI: 10.1016/j.fuel.2013.05.075
[10] Petersen F. Monitoring of tar contents in gases Final report, Lyngaa, Denmark, from http://energinet.dk/SiteCollectionDocuments/Danske%20dokumenter/Forskning%20-%20PSO-projekter/10479%20Monitoring%20of%20tar%20contents%20in%20gases.pdf, accessed in August. 2012.
[11] De Jong W. Tar measurements - developments towards further standardization. Delft, The Netherland, from http://briskeu.com/resources/documents/TOTeM%202%20Presentations/3_DeJong_Tar_measurements_developments_towards_further_standardization_GAW_June2013.pdf, accessed in June. 2013.
[12] Miller F.P., Vandome A. F., McBrewster J. (2009). Beer-Lambert law, VDM Publishing. P. 154.