OPEN ACCESS
The authors present a dynamic simulation of the thermal behavior of a multilayer plane wall, integrated with Phase Change Materials (PCMs), exposed to solar radiation in summer conditions, in a Mediterranean site. PCMs are a promising kind of heat storage materials that are particularly good in some climatic conditions: if properly placed, they can decrease heat flux through the walls, thus reducing cooling loads in buildings. Due to their strong non-linearity in thermal behavior, PCMs must be carefully modeled, possibly in transient conditions. The dynamic model consists of two main distinct parts. First, a solar radiation model is implemented, based on the daily evolution of the solar angles. This solution uses the results of a novel simple model for splitting the diffuse and the direct solar radiation starting from data on total radiation on a horizontal surface only. Then, solar radiation is used as a boundary condition for the dynamic modeling of a typical multilayer lightweight wall provided with one insulation layer integrated by PCMs. The calculated of solar effect and cooling loads are studied for three different melting temperatures of the PCMs.
PCM, solar, dynamic modeling, horizontal, sun declination angle
In recent years, serious efforts are carried out to reduce energy consumption in the building sector. Particularly, the importance of reduction in energy consuming is so essential that the European Commission established to reduce 20% of energy consumption by 2020 and 30% reduction in energy consumption by 2030 [1-3].
The reduction of energy consumption in light-wall buildings can be obtained from a proper analysis of the transient thermal behavior aimed at two tasks. The first objective is the peakshaving of the thermal loads and the second one is the exploitation of the occurrence of the daily reversals of heat flow rate, which take place in some climatic conditions [4-8]. On this purpose, any model that is aimed to describe the transient behavior of a building, especially in summer and intermediate seasons, must adopt a precise model for hourly solar radiation as well as an hourly variation of environmental temperature, because it represents the major heat load and it is subject to the higher fluctuations.
The effect of smoothing and delaying heat waves depends on the capability of the building structure to act as a thermal storage and this attribute is particularly low in light-weight buildings [9]. In addition, the application of light insulation with high apparent thermal capacity could be very useful for this kind of constructions.
Climatic data are usually available as total solar radiation, but for this kind of studies, the separate contributions of direct and diffuse solar radiation are needed. For this reason, it is important to use a reliable model, which infers the fraction of the direct component of the solar radiation and the diffuse one, separately, starting from data about the total radiation on a horizontal plane. Several papers describe the calculation of the sun angle that is needed for the successive calculation of the detailed solar radiation. Bivona et al. obtained a common expression for evaluating the global and diffuse radiations on horizontal surfaces. They found that a Gaussian distribution with two parameters, which takes into account the asymmetries between morning and afternoon hours, properly fits experimental data of six actinometrical stations with different geographical location and climatic conditions. This method is accurate for both the diffuse and global radiation [10].
Boland et al. developed a model in order to determine the influence that the smoothing due to the use of hourly data (instead of 15-minute data) has on the results. The model was carried out utilizing data from Australian locations, to explain some of the substantial scatter by adding apparent solar time as a predictor, which showed to be significantly better than solar altitude [11].
Erbs et al. performed TRNSYS simulations to calculate the yearly performance of solar energy systems, using several different correlations for diffuse solar radiation. They developed a correlation for seasonally dependent periodic diffuse radiation. Their work showed that the results, obtained thanks to their approximated correlation for diffuse radiation, resulted in a negligible error, in comparison with the ones related to the random distribution of the hourly diffuse fraction [12].
Skartveit et al. developed an analytical system for assessing the hourly diffuse fraction of global irradiance, which has been validated in a snow-free area close to sea level, in Norway [13].
Jin et al. made a research to figure out the effects of PCM location on the thermal performance of building walls, the effects of the state (notmelted, the partiallymelted and the fullymelted) of a particular kind of salt hydrate PCM on its phase change performance by differential scanning calorimeter tests, and also made cooling experiments. The experimental results showed that PCM state had great effects on the degree of supercooling and on the phase change performance of PCM. When the PCM was in the partiallymelted state before cooling, it was able to release the latent heat quickly, while when the PCM was in the fullymelted state before cooling, its degree of supercooling was large. Because the temperature ranges of the PCM during the thermal cycles were different when the PCM was placed in different locations on the wall, the PCM location had significant effects on its state, and as a result, on the phase change performance of PCM and the thermal performance improvement of building walls [14].
The application of PCMs, embedded in an insulation layer of a wall, is particularly effective in those periods of the year in which the oscillation of the external temperature is near to their melting/solidification temperature.
As the solar radiation plays an important role on the energy in the building envelope, therefore, finding the impact of solar radiation helps to increase the efficiency of walls throughout the building [15-17]. This paper deals with the effect of solar radiation on south-exposed walls including a layer of PCMs in the wallboard. In addition, in order to evaluate the impact of the melting temperature, the result obtained by the different melting temperature of PCMs.
Finally, the numerical model is used to evaluate a set of different wall configurations, with PCMs placed in different positions, with daily oscillation temperatures, to find the most convenient position.
According to ASHRAE [18, 19], the total solar irradiation (It) on a surface is the sum of the direct (ID), diffuse (Id) and ground-reflected (Ir) irradiance of the surface, as in Eq. (1):
$I_{t}=I_{D}+I_{d}+I_{r}$ (1)
The amount of solar irradiance is determined based on some solar angles and solar time. The Solar Time is calculated using Eq. (2):
$S T=s$ tandard time$+\frac{1}{15}\left(L_{s t}-L_{l o c}\right)+E$ (2)
where Lst and Lloc are standard meridian for the local time zone and longitude of the location, respectively.
The equation of time is defined by Duffie and Beckman [20]:
$\begin{aligned} E=229.2\{0.000075&+0.001868 \cos \left[(n-1) \frac{360}{365}\right] \\ &-0.032077 \sin \left[(n-1) \frac{360}{365}\right] \\ &-0.014615 \cos 2\left[\frac{(n-1) 360}{365}\right] \\ &-0.04089 \sin 2\left[(n-1) \frac{360}{365}\right] \} \end{aligned}$ (3)
The solar altitude (β) is calculated as:
$\sin \beta=\cos L \cos \delta \cos H+\sin L \sin \delta$ (4)
where, L and $\delta$ are latitude angle and solar declination angle, respectively.
$\delta=23.45 \sin \left\{\frac{[360(284+n)]}{365}\right\}$ (5)
Also, H is solar hour angle:
$\mathrm{H}=15(S T-12)$ (6)
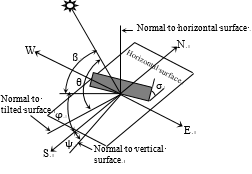
The solar incidence angle θ, Eq. (7), is the angle between the sun and the normal to the surface also the incidence angle is zero for the horizontal surfaces. The angles displayed in Figure 1 are related to the earth-sun angles with the following general expression for the angle of incidence [12, 13]:
Figure 1. Solar angles [10]
$\begin{aligned} \cos \theta=\sin L \sin \delta \cos \sigma-\cos L \sin \delta \sin \sigma \cos \psi \\ &+\cos L \cos \delta \cos H \cos \sigma \\ &+\sin L \cos \delta \cos H \sin \sigma \cos \psi \\ &+\cos \delta \sin H \sin \sigma \sin \psi \end{aligned}$ (7)
where L is latitude angle, the north or south angular location of the equator, north positive $-90^{\circ} \leq L \leq 90^{\circ}$.
Eventually:
$\cos \theta=\cos \beta \cos \gamma \sin \sigma+\sin \beta \cos \sigma$
$\gamma=\varphi-\psi$ (8)
$\cos \varphi=(\sin \beta \sin L-\sin \delta) /(\cos \beta \cos L)$ (9)
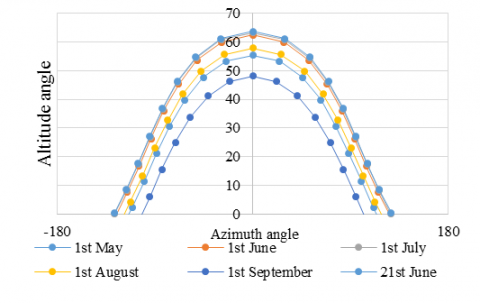
In order to investigate the position and angles of sun a numerical model of solar radiation on the building is developed. Figure 2 shows the position of the sun, including altitude and azimuth angles, on the first day of each summer month. It can be seen that in Wurzburg the maximum altitude of the sun is obtained on July 1st, while the minimum amount of altitude is estimated on September 1st, notwithstanding that highest sun point occurs on the summer solstice, the 21st of June.
Figure 2. Wurzburg sun position
The solar irradiance is calculated taking into account all the solar angles, with the method described hereafter.
For the direct irradiance on a surface, according to [16]:
$i f$$\cos \theta>0 \rightarrow I_{D}=\frac{A}{\exp \left(\frac{B}{\sin \beta}\right)} \cos \theta$
if $\cos \theta$ or $\sin \beta \leq 0 \rightarrow I_{D}=0$ (10)
The diffuse irradiance Id for the tilt surfaces by the Isotropic algorithm is:
$I_{d}=\frac{1}{2} I_{d}(0)(1+\cos \sigma)$ (11)
where Id(0) diffuse on horizontal surfaces.
Finally, the ground-reflected irradiance Ir is calculated by the isotropic algorithm as:
$I_{r}=I_{t}(0) \rho_{g}\left(\frac{1-\cos \sigma}{2}\right)$ (12)
where It(0) is global horizontal irradiance and ρg is ground reflectivity, often taken to be 0.2 for a typical mixture of ground surfaces.
The total solar radiation on different tilted and vertical surfaces of the building is the total sum of solar radiation coming on different surfaces (each wall and roof) of the building. Total solar radiation on the tilted surface of the building is estimated for all the segments of the building, using the previous equations, as the sum of the different contributions. Thus, the total solar radiation available on the building envelope is given by:
$S_{t}=\sum_{i=1}^{n} A_{i} I_{i}$ (13)
where Ai and Ii are the surface area of the ith wall and the total solar radiation (W/m2) available on the ith wall. In the simple case in which the building is aligned with cardinal points the hourly total solar radiation is given by [16]:
$S_{t}=A_{N} I_{N}+A_{E} I_{E}+A_{S} I_{S}+A_{W} I_{W}$ (14)
where N, E, S and W indicates the walls oriented to the North, East, South and West.
Analyzing the existing literature on the dynamic simulation of PCMs insulation layers was found that it is not easy to get accurate results with conventional models for specific heat that do not consider the different behavior during cooling and during heating processes, linked to daily fluctuations of temperature. It has been found [21-23] that there is a sort of hysteresis in the enthalpy-temperature characteristic curve. This complex thermodynamic behavior is related to a metastable state of super cooling of PCMs and 3D distribution of the thermal field through the layer. In unsteady conditions, the embedded capsules of PCMs produce a perturbation of the one-dimensional thermal field and this determination is not a univocal link between the average temperature of the material and its physical state. In order to describe the sort of hysteresis in the transient thermal behavior, it is possible to represent this phenomenon using two distinct temperature-enthalpy curves, for melting and solidification.
The heat storage capacity of the PCMs is implemented by a temperature dependent heat capacity. The following values of cp(T) are applied instead of a constant specific heat, in the case of a PCMs layer:
$\begin{array}{ll}{T<T_{l o w}} & {c_{p}(T)=c_{p}^{S o l i d}} \\ {T_{l o w} \leq T \leq T_{u p}} & {c_{p}(T)=f(T)} \\ {T>T_{u p}} & {c_{p}(T)=c_{p}^{l i q u i d}}\end{array}$ (15)
where Tlow and Tup are the starting and ending temperature of the phase change respectively. cpsolid and cpliquid are constant values, while f(T) can be an arbitrary function for the enthalpy in the melting range.
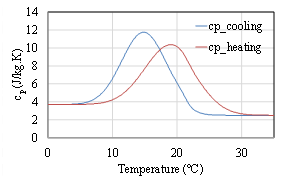
Figure 3. cp of PCM Energain® board
The following form of cp curve is utilized to develop the cp of PCMs, for cooling and heating:
$c_{p}=a_{1}-a_{2} \tanh \left(\frac{T-a_{3}}{a_{4}}\right)+a_{5} e^{-\left(\frac{T-a_{6}}{a_{7}}\right)^{2}}$ (16)
The curve of cp function is developed from the fitting curves to the experimental curves of enthalpy-temperature [24, 25]. It is worth noting some features of this kind of cp curves. The coefficient a1 is the mean value between the cp of the solid and liquid phases and the coefficient a2 is half- difference between the cp of the solid and liquid phases.
$a_{1}=\frac{c_{p}^{c o o l i n g}+c_{p}^{h e a t i n g}}{2} ; a_{2}=\frac{c_{p}^{c o o l i n g}-c_{p}^{h e a t i n g}}{2}$ (17)
cp curves must fulfill to some further constraints, which are related to “congruity” reason, that are described in the following paragraph. There must not be any hysteresis in the ranges far from the phase changes, sub cooling, and superheating. In addition, it should be a single bijective relation between temperature and enthalpy. These constraints lead to a further cross-link between the coefficients of the two distinct cp curves used for heating and cooling.
It must be:
$a_{5 \text { Cooling }} \cdot a_{7 \text { Cooling }}$$=a_{5 \text {Heating}} \cdot a_{7 \text {Heating}}$ (18)
The two different curves of cp for heating and cooling, which are applied in the developed model in order to simulate two different enthalpy curves for the PCM for melting and solidification, are plotted in figure 7.
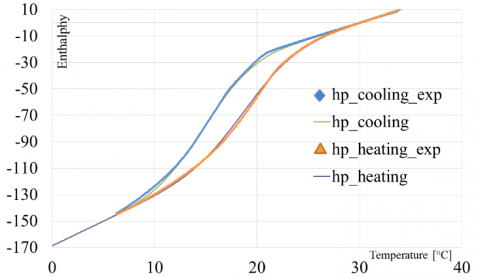
The experimental and fitted curves of enthalpy as a function of temperature are reported in figure 8, with reference state of h=0 at t= 30°C.
The experimental tests were carried out in a facility located at ZAE Bayern. The tests are part of a large experimental campaign devoted to evaluate the performances of insulation layers: a series of preliminary tests, with a specific profile of temperature in time, was planned, for each material, to detect the enthalpy curves, as a function of temperature, in the different operating conditions [13].
Figure 4. Enthalpy of PCMs Energain® board
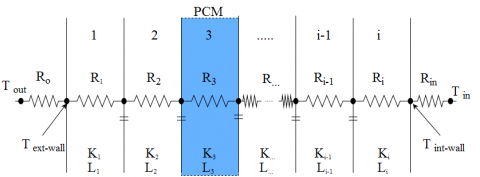
Figure 5. Thermal model of the wall with PCMs
This model has been enhanced to include PCMs, at different positions, as a layer within the wall construction. The thermal properties of PCMs materials are strongly dependent on temperature and, in particular, they are different in heating and cooling conditions.
A lumped parameter approach is used to the developed model for each layer of the wall, which is sketched in figure 9. It corresponds to a differential equation system and the system is solved using Matlab Simulink® [26, 27].
In addition, solar radiation and radiation heat transfer, back and forth the surroundings, are computed only for the nodes that represent the temperature of the internal and of the external surfaces, Text-wall, and Tin [13].
In order to evaluate the performance of PCMs in peripheral walls, five walls with different PCMs positions are considered. The main hypotheses, which has been utilized to solve the mathematical model, are reported hereafter. The inside air is supposed to be maintained at a constant temperature of 22°C. The outside temperatures are varied in accordance with external weather temperature and the solar radiation is imposed as a boundary condition.
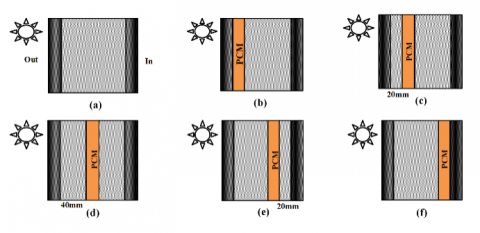
The external light wall, without PCMs, is a sandwich made of three layers: the first and the third one consists of 20mm of wood, while the intermediate one is a 100mm thick insulating layer. An Energain® PCMs board, 5mm thick, is added as a further intermediate layer at different positions. Figure 10 presents the layout of five different configurations of the modeled wall.
Figure 6. Layout of walls: reference wall (a), with PCMs in position 1 (b), position 2 (c), position 3 (d), position 4 (e), position 5 (f)
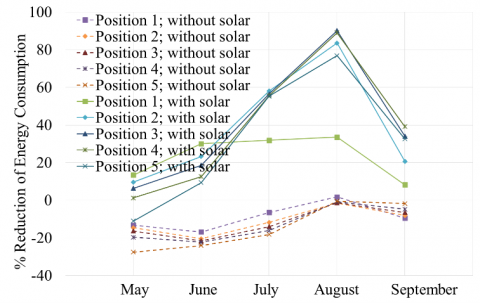
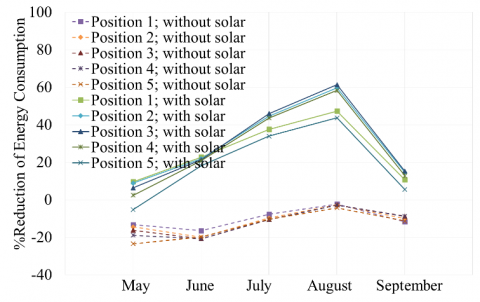
The developed model calculated the energy consumption of a multilayer wall with a layer of thermal storage panel, DuPontTM Energain®, and the results were compared with the wall without Energain®, considering solar radiation. In addition, some other considerations are drawn about the impact of solar radiation in the model. Figures 11 shows the percentage of energy reduction for different positions of PCMs in summer. The calculation was accomplished for distinct PCMs, characterized by different melting point temperatures of 22, 23 and 24°C.
$\%$Reduction$=\frac{\text {without } P C M-P C M}{\text {without } P C M}$ (19)
The maximum effect takes place in the hotter months of summer, especially in August, and the most effective location for PCMs is position 3, because the variation of the external temperature induces variations of the temperature of the layer with PCMs that are close to their phase change temperature, and consequently PCMs act more efficiently. Furthermore, using PCMs through the first position does not cause a significant reduction of energy consumption. On the other hand, it is possible to see that the effect of energy saving is strictly linked to the capability of storing and shaving the peaks of solar thermal load. In fact the results of the simulations without solar radiation show that PCMs often lead to increasing the energy consumption instead of decreasing it.
(a)
(b)
(c)
Figure 7. % Reduction of energy consumption, Tm=22°C (a), Tm=23°C (b), Tm=24°C (c)
Figure 11 (b) illustrates the percent reduction of energy consumption with the melting temperature of 23°C, for five different positions of PCMs insulation layer in summer. This graph clearly shows that the position 3 is the best selection between July to September.
The maximum effect of reduction of energy consumption is about 60% and it takes places in August with PCMs located in position three regarding figure 10 (d). In addition, chart (c) shows that good results can be obtained with the PCMs layer located in the position 2 or 4.
Looking at figure 11, in August, one can observe that a proper selection of the melting temperature has a significant impact in reducing energy consumption.
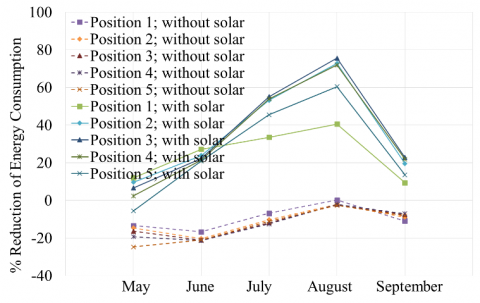
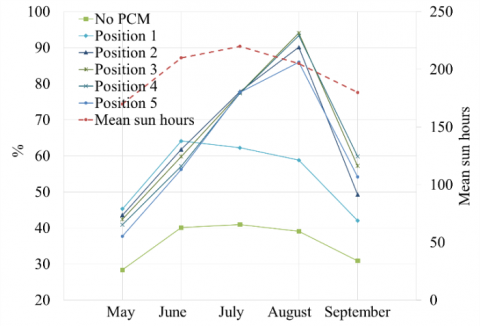
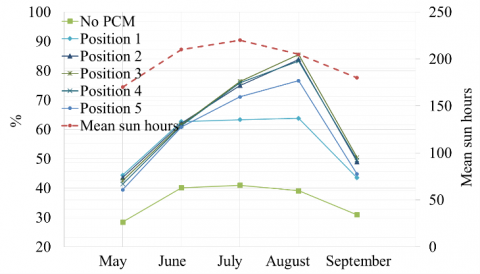
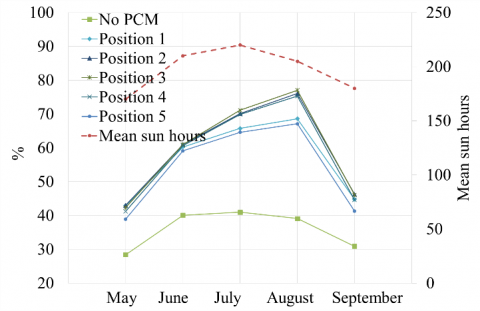
The percent effect of solar radiation on the energy consumption is defined in eq. 20 and it is reported in figure 12.
(a)
(b)
(c)
Figure 8. % Effect of solar radiation on energy consumption, Tm=22°C (a), Tm=23°C (b), Tm=24°C (c)
$\%$ Solar ef $f$ ect $=\frac{\text { No solar-Solar }}{\text { No solar }}$ (20)
It shows the effect of solar radiation on energy consumption using PCMs with melting temperature of 22, 23 and 24°C.
It is easy to appreciate the large impact that the use of PCMs has on energy savings.
There is a clear evidence of the effect that PCMs insulation layers exploit to generate a reduction of the energy consumption: it is possible noticing that the presence of the PCMs results in a growth of energy saving, which is large in presence of solar radiation and small or absent when the wall is not exposed to solar radiation. The benefits of PCMs are linked to the possibility of storing and smoothing the peaks of solar heat loads and make them available, later. This effect is even more marked when PCMs are properly located inside of the wall. The lower effect on energy savings has been found with PCMs located in position 1 or 5, located afar from the middle part of the wall, and this is due to the oscillations of the mean daily temperature, which keeps the PCMs out of their phase change temperature range.
Figure 12(b) displays the effect of solar radiation on the energy consumption using PCMs with the melting temperature of 23°C. In this case, it is possible to see that even though the maximum duration of monthly insolation is in July, the maximum of energy saving occurs in August, as shown in figure 12(b), because the mean monthly temperature in August is higher and the PCMs layer works in better conditions. Finally, the maximum effect of solar radiation on energy consumption, in case of PCMs with melting temperature 24°C, is obtained with the insulation layer located in position 3 (Figure 12(c)).
In addition, in July and August, locating PCMs at one of the exterior positions of the wall, from 3 to 5, generates a reduction about 12% of the consumption with respect to placing it at position 1 or 2, while there is not any appreciable difference during May and June.
This paper deals with the evaluation of heat consumption, due to heat transfer through a South oriented plane wall, in unsteady condition. The effect of a DuPontTM Energain® insulation layer, located in five different positions, exposed to solar radiation, in a European site, was studied.
Solar radiation is the most mutable environmental condition, among the ones that determine the daily variations of heat transfer in buildings. For this reason, a procedure devoted to the calculation of solar radiation, based on the apparent solar angles, has been included in the model used in this work: the effect of the solar radiation has been considered as a time-dependent thermal source at the boundary. Furthermore, this model includes an algorithm that split the total radiation on the horizontal surface into the direct and the diffuse ones, in order to correctly calculate the solar radiation on arbitrarily oriented surfaces. Thus, it has been possible to use the climatic data, such as temperature, humidity and solar radiation, which have been gathered from one of the several free-access databases that do not report detailed data about the two distinct contributions of the solar radiation.
In this way, it has been possible to point out the effects of the fluctuation of the solar radiation from the effects of the daily oscillation of temperature and to estimate, as a reference, the heat consumption with no solar gain.
The results confirm that the utilization of an insulation layer with PCMs could provide the major reduction of the heat loads when their intensity is more fluctuating and variable. This condition occurs in summer and particularly in August because of the combined effects of the solar radiation intensity and the ones that are caused by the amplitude of the external temperature variations. This paper shows that layers with PCMs are more effective when their temperature variations are close to the phase change temperature, which, for this case, it was obtained with PCMs with the melting temperature of 22°C located in position three (middle of the wall). Results showed that insulation layer with PCMs could lead to energy savings up to 75% of the heat load through opaque walls and that these savings are higher when the duration of solar radiation is longer, whereas lower effects, if any, were found in absence of solar radiation.
Finally, the comprehensive analysis of the energy savings led the authors to conclude that the effectiveness of the insulation layer with embedded PCMs depends on the complex combination of coupled effects, that are the amplitude of external temperature oscillations combined with the layer location, in the wall, and the coupling between the mean external temperature to the phase change temperature of PCMs.
The test campaign was carried out at the Bavarian Center for Applied Energy Research (ZAE Bayern) in Germany.
|
Roman letters |
|
|
ai |
Coefficients of the cp equation |
|
A |
Surface area |
|
As |
apparent solar radiation |
|
B |
atmospheric extinction coefficient |
|
C |
sky diffuse factor |
|
Cn |
clearness number |
|
E |
equation of time |
|
H |
Solar hour angle |
|
I |
Irradiance |
|
L |
Latitude angle |
|
n |
number of day |
|
ST |
solar time |
|
T |
Temperature |
|
V |
vertical |
|
Greek letters |
|
|
β |
solar altitude |
|
Φ |
Latitude angle |
|
γ |
surface-solar azimuth angle |
|
δ |
Sun declination angle |
|
ϴ |
incidence angle |
|
σ |
surface tilt angle from the horizontal |
|
φ |
solar azimuth angle |
|
Ψ |
surface azimuth angle |
|
ρg |
ground reflectivity |
|
Subscripts |
|
|
D |
Direct |
|
d |
diffuse |
|
ext-wall |
external wall |
|
i |
i-th section |
|
in |
inside |
|
loc |
local |
|
m |
melting |
|
r |
reflected |
|
st |
standard |
|
t |
total |
[1] Streimikiene D. (2012). The impact of international GHG trading regimes on the penetration of new energy technologies and feasibility to implement EU Energy and Climate Package targets, Renewable and Sustainable Energy Reviews, Vol. 16, No. 4 pp. 2172-2177. DOI: 10.1016/j.rser.2012.01.042
[2] Rezaeia S.D., Shannigrahib S., Ramakrishna S. (2017). A review of conventional, advanced, and smart glazing technologies and materials for improving indoor environment, Solar Energy Materials and Solar Cells, Vol. 159, pp. 26-51. DOI: 10.1016/j.solmat.2016.08.026
[3] Deba C., Zhang F., Yang J., Lee S.E., Shah K.W. (2017). A review on time series forecasting techniques for building energy consumption, Renewable and Sustainable Energy Reviews, Vol. 74, pp. 902-924. DOI: 10.1016/j.rser.2017.02.085
[4] Real S., Gomes M.G., Rodrigues A.M., Bogas J.A. (2016). Contribution of structural lightweight aggregate concrete to the reduction of thermal bridging effect in buildings, Construction and Building Materials, Vol. 121, pp. 460-470. DOI: 10.1016/j.conbuildmat.2016.06.018
[5] Hudobivnik B., Pajek L., Kunič R., Košir M. (2016). FEM thermal performance analysis of multi-layer external walls during typical summer conditions considering high intensity passive cooling, Applied Energy, Vol. 178, pp. 363-375. DOI: 10.1016/j.apenergy.2016.06.036
[6] Lo Cascio E., Ma Z., Borelli D., Schenone C. (2017). Residential building retrofit through numerical simulation: A case study, Energ Proc., Vol. 111, pp. 91-100. DOI: 10.1016/j.egypro.2017.03.011
[7] Di Bella A., Granzotto N., Elarga H., Semprini G., Barbaresi L., Marinosci C. (2015). Balancing of thermal and acoustic insulation performances in building envelope design, Proceedings of INTER-NOISE 2015, pp. 1209-1219.
[8] Tagliafico L.A., Cavalletti P., Fabbri C., Scarpa F. (2016). Dynamic Behaviour and Control Strategy Optimization for Conventional Heating Plants in Buildings, Int. J. Heat. Tech., Vol. 34, No. Sp. 2, pp. S505-S511. DOI: 10.18280/ijht.34Sp0244
[9] Aditya L., Mahlia T.M.I., Rismanchi B., Nge H.M., Hasan M.H., Metselaar H.S.C., Muraza O., Aditiya H.B. (2017). A review on insulation materials for energy conservation in buildings, Renewable and Sustainable Energy Reviews, Vol. 73, pp. 1352-1365. DOI: 10.1016/j.rser.2017.02.034
[10] Bivona S., Burlon R., Leone C. (1991). Instantaneous distribution of global and diffuse radiation on horizontal surfaces, Solar Energy, Vol. 46, No. 4, pp. 249-254. DOI: 10.1016/0038-092X(91)90070-D
[11] Boland J., Scott L., Luther M. (2001). Modelling the diffuse fraction of global solar radiation on a horizontal surface, Environmetrics, Vol. 12, No. 2, pp. 103-116. DOI: 10.1002/1099-095X(200103)12:2%3C103::AID-ENV447%3E3.0.CO;2-2
[12] Erbs D.G., Klein S.A., Duffie J.A. (1982). Estimation of the diffuse radiation fraction for hourly, daily and monthly-average global radiation, Solar Energy, Vol. 28, No. 4, pp. 293-302. DOI: 10.1016/0038-092X(82)90302-4
[13] Skartveit A., Olseth J.A. (1987). A model for the diffuse fraction of hourly global radiation, Solar Energy, Vol. 38, No. 4, pp. 271-274. DOI: 10.1016/0038-092X(87)90049-1
[14] Jin X., Zhang S., Xu X., Zhang X. (2014). Effects of PCM state on its phase change performance and the thermal performance of building walls, Building and Environment, Vol. 81, pp. 334-339. DOI: 10.1016/j.buildenv.2014.07.012
[15] Kreith F., Kreider J.F. (1987). Principles of Solar Engineering, McGraw-Hill, New York.
[16] Fateh A. (2017). Development and Validation of a Dynamic Model of Buildings, Including PCMs-based Insulation, for Energy Efficient Solutions, Ph.D., Thesis.
[17] Cirillo L., Di Ronza D., Fardella V., Manca O., Nardini S. (2015). Numerical and experimental investigations on a solar chimney integrated in a building façade, International Journal of Heat and Technology, Vol. 33, No. 4, pp. 246-254.
[18] ASHRAE. (2013). American Society of Heating, Refrigerating, and Air Conditioning Engineers, ASHRE Handbooks, Fundamentals, Ch.14
[19] Hottel H.C., Woertz B.B. (1942). The performance of flat plate solar-heat collectors, Transactions of the ASME, Vol. 64, pp. 64-91.
[20] Duffie J.A., Beckman W.A. (1991). Solar Engineering of Thermal Processes, 2nd ed., John Wiley and Sons, New York, USA.
[21] Kuznik F., Virgone J. (2009). Experimental investigation of wallboard containing phase change material: Data for validation of numerical modeling, Energy and Buildings, Vol. 41, No. 5, pp. 561-570. DOI: 10.1016/j.enbuild.2008.11.022
[22] Jin X., Medina M.A., Zhang X. (2016). Numerical analysis for the optimal location of a thin PCM layer in frame walls, Applied Thermal Engineering, Vol. 103, pp. 1057-1063. DOI: 10.1016/j.applthermaleng.2016.04.056
[23] Chwieduk D.A. (2013). Dynamics of external wall structures with a PCM, Energy, Vol. 59, pp. 301-313.
[24] Borderon J., Virgone J., Cantin R. (2015). Modeling and simulation of a phase change material system for improving summer comfort in domestic residence, Applied Energy, Vol. 140, pp. 288-296.
[25] Gracia A., Fernández C., Castell A., Mateu C., Cabeza L. (2015). Control of a PCM ventilated facade using reinforcement learning techniques, Energy and Buildings, Vol. 106, pp. 234-242. DOI: 10.1016/j.enbuild.2015.06.045
[26] Fateh A., Devia F., Spoladore A. (2016). Steady state thermal dynamic analysis of a typical house in Genova using state space model, International Journal of Engineering Technology and Scientific Innovation, Vol. 1, pp. 142-150.
[27] Fateh A., Weileader H., Klinker F., Devia F. (2017). Numerical and experimental investigation of a typical wallboard integrated by phase change material (PCM), Journal of Energy and Buildings, Vol. 153, pp. 231-240. DOI: 10.1016/j.enbuild.2017.08.007