OPEN ACCESS
The temperature is one of the important structural design parameters in the construction control of bridges. The structural stress and deformation are significantly influenced by the temperature. As a complex random variable, the temperature parameter has a close relationship with the structural location, orientation, materials, and the natural conditions, as well as the time variable, and is very difficult to be determined in the construction. In this study, in order to compute the temperature stress from the bridge structures effectively and accurately, the factors affecting the temperature stress are analyzed. The calculation method of the temperature field of the concrete structures is investigated. According to the basic assumption, the calculation formulas of the temperature self-restrained stress and the temperature inferior stress are thoroughly analyzed, and the corresponding calculation formulas are proposed, respectively. Furthermore, based on the proposed calculation models, adopting the fine element numerical simulation method, the influence of the temperature on the bridge structure stress is analyzed and investigated. The research results provide an import theoretical and experimental basis for the construction control of bridges.
Bridge structure, Temperature effect, Construction control, Temperature field, Temperature stress, Finite element analysis (FEA).
The object of the construction control of a bridge includes the deformation and stress of the structure. The purpose of construction control is to ensure that the theoretical value is basically consistent with the measured value at all stages of construction, and ultimately to achieve the ideal finished state of the bridge. But in the actual construction process, the theoretical value is not consistent with the measured value; the main reason for this is the improper selection of structural design parameters in the theoretical calculation [1-11]. Structural design parameters mainly include structural geometry parameters, section parameters, temperature design parameters, load parameters, material parameters, and so on. The temperature design parameter has a close relationship with the geographical position, direction, natural condition, material, and so on of a bridge and is difficult to determine. The temperature parameter is a complex random variable; it plays an important role in determining the stress and deformation of the structure [12-23]. This paper analyzes the causes of temperature stress. According to the basic assumption, the practical calculation method of temperature stress is put forward under the condition of given temperature distribution, and the influence of temperature stress on the construction control of the bridge is analyzed with an engineering example [24-27].
2.1 Causes of temperature stress
Temperature has an influence on a bridge structure, including the annual temperature difference and partial temperature difference. The influence of annual temperature difference is the effect of temperature changes with the seasons. It is usually assumed that the temperature changes uniformly along the section height of the structure. For the concrete box girder with no horizontal constraint, the influence of annual temperature difference only causes a uniform deformation of the structure and does not induce temperature stress in the structure. The influence of partial temperature difference is the influence of the temperature difference of sunlight, as it will produce temperature stress in the structure. Temperature stress includes two aspects, one is the temperature stress itself, and the other is temperature secondary stress.
2.2 Analysis of temperature field of concrete structure
Due to the impact of the intensity of solar radiation, the position of a bridge, sunshine time, geographical location and other factors, a non-uniform distribution of the temperature difference between the surface of the bridge and bridge interior occurs during the construction process. Since the thermal conductivity of concrete is small, in the case of rapid temperature changes, there is a significant change in the internal temperature hysteresis, leading to heat in each layer of concrete, thereby forming a non-linear temperature field distribution. In fact, the thermal conductivity of the bridge structure is a function of the spatial coordinates and time, and the temperature field is usually represented by$T=f(x, y, z, t)$. An analysis of the temperature field method can be mainly conducted in the following ways: first, by using the thermal conduction differential equation; second, by using the approximate numerical solution; third, by using the semi-theoretical and semi-empirical formula [28]. In this paper, the third method was used to study the temperature field of a box girder: the temperature of a concrete structure was measured at various points under different climatic conditions. Based on the above research, an applicable formula has been established during the project.
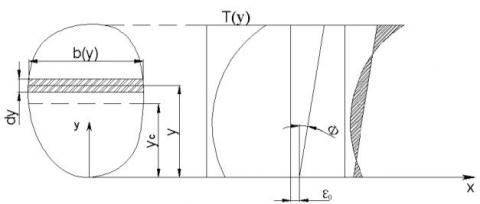
Figure 1. Temperature difference model
The configuration of the bridge members causes a significant influence on the distribution of the temperature. According to the previous conclusions, the distribution of the temperature is generally uniform along the bridge span. Therefore, the temperature difference along the bridge span can be ignored. The thermal conduction along the bridge cross section is much greater than that along the bridge span. In this study, for simplicity, an analysis of one-dimensional thermal conduction along the bridge cross section has been carried out. The temperature distribution is determined according to the one-dimensional temperature field expressed as$T=f(y, t)$.
Based on the theory of the temperature field and the in-situ actual measurement, the model of temperature difference ($T(y)$) is proposed with an exponential function form expressed as follows:
$T(y)=T_{0 y} e^{-c_{y} y}$(1)
where, $T_{0 y}$ stands for the temperature difference of the top slab of the box girder bridge, which is determined experimentally; $\mathcal{C}_{y}$ denotes the model parameter, which is derived from regression analysis; $\mathcal{y}$ means the distance between the measurement point and the top slab.
The distribution of the temperature difference model is illustrated in Figure 1.
2.3 Calculation of thermal stress
After the temperature distribution is determined, based on the thermal physical properties of concrete, the temperature load can be obtained. Temperature load is generally divided into three types: sunshine temperature load, a sudden drop in temperature load, and annual temperature load. For a statically indeterminate continuous rigid frame bridge, under the nonlinear temperature mode, temperature load not only causes structure deflection, but will also produce self-phase equilibrium temperature self-restrained stress in the cross section and temperature secondary stress by redundant constraint. The calculation theory of the temperature stress of the box girder is mainly based on the following basic assumptions:
①The temperature distribution along the longitudinal direction of the bridge is uniform.
②The concrete is a homogeneous elastic material, which obeys Hooke's law.
③The deformation of the beam is assumed to obey the plane section assumption, and the thin-walled effect of the box girder is not considered.
④If we consider the temperature stress caused by the multi-direction temperature load, temperature stress will be calculated according to the one-way temperature load, then the temperature difference stress superposition.
(1) Calculation of the temperature self-restrained stress
Provided the temperature difference distribution curve is an arbitrary curve$T(y)$, and a unit beam section is taken, when the longitudinal fiber is not restrained and can freely stretch, the free deformation of each point along the beam height is:
$\varepsilon_{T}(y)=\alpha T(y)$(2)
where $\alpha$ represents the material linear expansive coefficient.
According to the plane section assumption, the line position of the section after the actual deformation is:
$\varepsilon_{\alpha}(y)=\varepsilon_{0}+\phi_{y}$(3)
where $\mathcal{E}_{0}$ the deformation is value for $y=0$ of the section, and $\phi$ represents the curvature after deflection of the beam segment.
The strain shadow part in Figure 2 is thermal strain, its value is:
$\varepsilon_{\sigma}(y)=\varepsilon_{T}(y)-\varepsilon_{\alpha}(y)=\alpha T(y)-\left(\varepsilon_{0}+\phi y\right)$(4)
So the temperature self-restrained stress for $\mathcal{E}_{\sigma}(y)$ is as follows:
$\sigma_{s}(y)=E \varepsilon_{\sigma}(y)=E\left\{\alpha T(y)-\left(\varepsilon_{0}+\phi y\right)\right\}$(5)
No external load acts on the beam segment unit, since there is self-restrained stress on the cross section in a state of equilibrium, from the equilibrium condition:
$\sum X=0$, the following equation can be obtained:
$\int_{h} E \varepsilon_{\sigma}(y) b(y) d y=0$(6)
$\sum M=0$ , the following equation can be obtained:
$\int_{h} E \varepsilon_{\sigma}(y) b(y)\left(y-y_{c}\right) d y=0$(7)
By the above formula (6) and formula (7) can be solved:
$\varepsilon_{0}=\frac{\alpha}{A} \int_{h} T(y) b(y) d y-y_{c} \phi$(8)
$\phi=\frac{\alpha}{I} \int_{h} T(y) b(y)\left(y-y_{c}\right) d y$(9)
In the formula: $A=\int_{h} b(y) d y, I=\int_{h} b(y) y\left(y-y_{c}\right) d y$
Put formula (8) and formula (9) into formula (5), and the thermal stress $\sigma_{s}(y)$ can be obtained.
(2) Calculation of temperature secondary stress
In a concrete continuous rigid frame bridge, the temperature deformation $\mathcal{E}_{0}$ and the curvature $\phi$ will be restricted by a redundant constraint, and then temperature secondary stress will be induced. The temperature secondary stress can be obtained by the method of structural mechanics. Take the bar element with both ends fixed, the load vector $\{F\}^{e}$ of the element node which is caused by the temperature change can be expressed as $\varepsilon_{0}, \phi$.
$\{F\}^{e}=\left\{\begin{array}{l}{N_{i}} \\ {Q_{i}} \\ {M_{i}} \\ {N_{i}} \\ {Q_{i}} \\ {M_{i}}\end{array}\right\}=\left\{\begin{array}{c}{E A\left(\varepsilon_{0}+\phi y_{c}\right)} \\ {0} \\ {E I \phi} \\ {-E A\left(\varepsilon_{0}+\phi y_{c}\right)} \\ {0} \\ {-E I \phi}\end{array}\right\}$(10)
The node force vector$\{F\}$ of the whole structure can be obtained by the node load of each bar element. The matrix displacement equation is expressed as follows:
$[k][\Delta\}+\{F\}=0$(11)
In the formula, $[k]$ represents the total stiffness matrix of the structure, and $\{\Delta\}$ represents the nodal displacement vector of the unit.
Equation (11) can be derived from the structure caused by temperature variation of node displacement, the nodal displacement caused by structure temperature variation can be obtained by formula (11). The formula $\{f\}^{e}=[K] \Delta \}^{e}$ can calculate the structural temperature internal force $N_{T}, \quad Q_{T}, \quad M_{T}$ and the temperature secondary stress, $\sigma_{s x}(y)$. For prestressed concrete continuous rigid frame bridges, the total temperature stress of the structure can be obtained through the above analysis.
The total temperature stress at the cantilever construction stage is:
$\sigma_{T}(y)=\sigma_{s}(y)$(12)
The total temperature stress at the completion of the middle span closure is:
$\sigma_{T}(y)=\sigma_{s}(y)+\sigma_{s x}(y)$(13)
Figure 2. Calculation sketch map of the temperature self`-restrained stress
3.1 Bridge construction description
The Yili River Bridge is a key part of Highway 313 of Xinjiang Uygur Autonomous Region. It has a full length of 1580.52m. The main bridge is a continuous rigid-frame bridge with a span arrangement of 66+5![]() 120+66m. The main bridge made of prestressed concrete is a twin box and single cell box girder. The bridge approach adopts a prestressed concrete T-girder with a single span of over 40m. The bridge approaches at both ends have 14 spans and 7 spans. The longitude slope is less than 2% and the horizontal slope is 1.5%. The bridge is 25.5m in width with four lanes. As for the load, vehicles are designed at level 20 or above and handcars, 120. The driving speed is designed at 100 km/h.
120+66m. The main bridge made of prestressed concrete is a twin box and single cell box girder. The bridge approach adopts a prestressed concrete T-girder with a single span of over 40m. The bridge approaches at both ends have 14 spans and 7 spans. The longitude slope is less than 2% and the horizontal slope is 1.5%. The bridge is 25.5m in width with four lanes. As for the load, vehicles are designed at level 20 or above and handcars, 120. The driving speed is designed at 100 km/h.
3.2 Finite element analysis
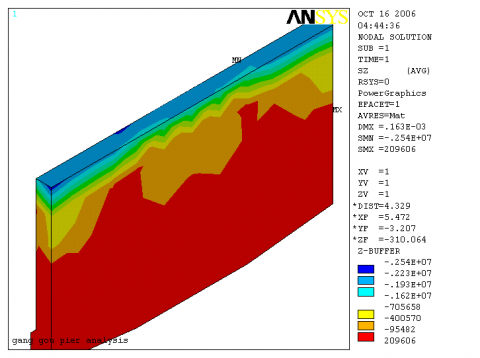
In this paper, the finite element method is used to analyze the internal force of the structure. The whole structure can be divided into a number of units by using the finite element method; by analyzing each unit, one can obtain very good accuracy. According to the design information, the bridge is separated into 211 deck units (in the form of variable cross-sections), 6 base units with infinite stiffness, and 24 rigid pier units (in the form of uniform cross-sections). The size of the girder segment of the bridge span structure is strictly designed and constructed according to drawings. There are 46 types of prestressed steel beams, 215 of which address the influences of concrete shrinkage, creep, prestress, temperature variation, and bearing displacement. The calculation process consists of 70 construction stages. The main bridge of the Yili River Bridge adopts the construction sequence as follows: cast-in-situ of the cantilever for basket→ closure of the side span→ closure of the secondary span→ closure of the midspan. In the treatment of the box girder diaphragm, the diaphragm is regarded as a concentrated load with weight and volume, which is applied to the beam. The ANSYS calculation model is shown in Figure 3.
Figure 3. ANSYS computing model
3.3 Effect of temperature variation on bridge structures
Temperature variation along the length direction of the bridge is small. Due to the poor thermal conductivity of concrete structures, changes in ambient temperature and sunlight, there is a large temperature gradient in the vertical direction of the bridge surface and interior. The arrangement of temperature measuring points should reflect the changes in the gradient. The upper surface and the lower surface of the top plate of the cross section are respectively arranged measuring points; the measuring points are arranged on the web plate, and are respectively arranged on the upper surface and the lower surface of the bottom plate.
The temperature field is measured when the strain is tested. To test it, choose a time of day when the temperature changes dramatically, and test once every two hours, analyzing the rule of the temperature field with the temperature change.
In addition, in order to study the force of the beam body, the temperature field needs to be tested all day long when the beam is closed.
3.3.1 before closure
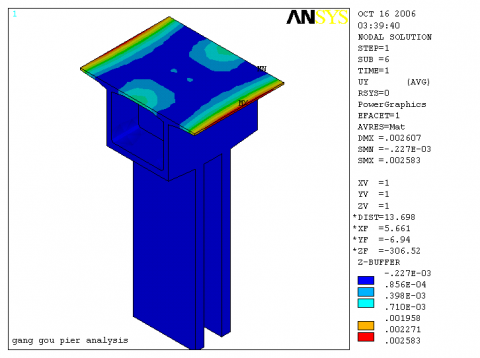
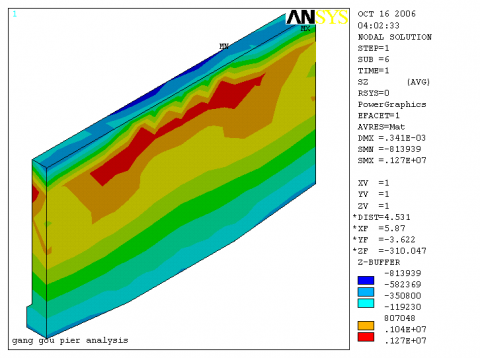
Taking into account the long-term temperature difference is relatively simple, just assume that the entire section of the beam uniform rises or falls. In the segmental construction analysis it is relatively easy to achieve. The local temperature difference mainly refers to the sunshine temperature difference and sudden drop in temperature. Due to the poor thermal conductivity of concrete, the temperature difference of the structure distribution is not linear; the key to studying the temperature effect on a concrete bridge is to determine the most unfavorable temperature distribution. The sunshine temperature difference's effect on a continuous rigid frame bridge not only leads to the deformation of the structure, but also to temperature secondary stress and temperature self-restrained stress. The effect of the sunshine temperature difference's load on the structure is often no less than the effect of the vehicle load, so we have to analyze the effect of the partial temperature difference on the bridge construction control. According to local conditions, the partial temperature difference is set to 5 degrees. The change in internal force and the deflection of the rigid frame pier are analyzed with ANSYS software when the roof temperature rises 5 degrees. Figure 4 is a diagram showing the deflection of each node of 0# block, Figure 5 the stress for each node at the roof of 0# block, Figure 6 the stress for each node at the web of 0# block.
Under the influence of temperature differences, the maximum compressive stress at the roof of 0#block rigid frame pier is 0.34MPa, and the maximum tensile stress is 0.39Mpa according to the ANSYS software analysis.
Figure 4. Deflection caused by temperature difference of 0#block
Figure 5. Roof stress caused by temperature difference of 0#block
Figure 6. Web stress caused by temperature difference of 0#block
3.3.2 after closure
After the bridge closure is completed, the structure of the bridge changes from a statically determinate structure to a statically indeterminate structure. At this time the stress generated by the temperature difference is composed of two parts: the temperature secondary stress and the temperature self-restrained stress.
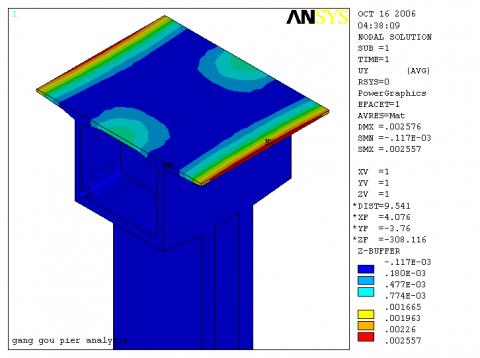
We analyze rigid frame piers in order to carry out a comparison with before closure as shown in the node deflection diagram, while the stress diagram of the roof and web are obtained after closure as shown in Figures 7-9.
Figure 7. Deflection caused by temperature difference of 0#block after closure
Figure 8. Roof stress caused by temperature difference of 0#block after closure
Figure 9. Web stress caused by temperature difference of 0#block after closure
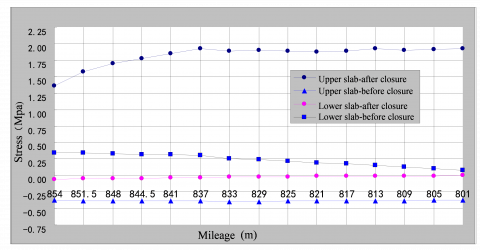
The stress changes in the beam segment's upper and lower flange under the temperature difference's influence before and after the beam section closure are listed in Table 1. Before the beam section closure, the cross sections of the upper edge plate are all affected by tensile stress, the maximum tensile stress value is 0.39MPa; the cross sections of the lower edge plate are all affected by compressive stress, the maximum compressive stress value is 0.34MPa. After the bridge closure is completed, the structure of the bridge changes from a statically determinate structure to a statically indeterminate structure, and the structure system tends to be perfect. The cross sections of the upper edge plate are all affected by compressive stress, the maximum compressive stress value is 1.92MPa; the cross sections of the lower edge plate are all affected by tensile stress, and the maximum tensile stress value is 0.06MPa. After closure, because of the change in structure, the system leads to an increase in temperature secondary stress. The influence of the temperature secondary stress in turn leads to an increase in compressive stress in the roof section. However, the temperature stress in the bottom slab of the box girder bridge slightly decreases after closure, compared with that before closure. The distribution of the temperature stress along the bridge span is presented in Figure 10. It is indicated that the temperature stress is uniformly distributed. The influence of the temperature on the stress of the top slab is significant, whereas the influence is smaller on the stress of the bottom slab. In addition, the temperature stress on the bottom slab is close to zero and can be ignored.
Table 1. Comparison of stress variation in each section before and after closure
|
Beam segment |
Upper slab stress(MPa) |
Lower slab stress(MPa) |
||
|
Before closure |
After closure |
Before closure |
After closure |
|
|
0 |
-0.38 |
1.36 |
0.34 |
-0.06 |
|
1 |
-0.38 |
1.57 |
0.34 |
-0.05 |
|
2 |
-0.38 |
1.70 |
0.33 |
-0.05 |
|
3 |
-0.39 |
1.77 |
0.32 |
-0.04 |
|
4 |
-0.39 |
1.85 |
0.31 |
-0.04 |
|
5 |
-0.39 |
1.92 |
0.30 |
-0.03 |
|
6 |
-0.39 |
1.88 |
0.25 |
-0.02 |
|
7 |
-0.39 |
1.90 |
0.24 |
-0.02 |
|
8 |
-0.39 |
1.89 |
0.22 |
-0.02 |
|
9 |
-0.39 |
1.87 |
0.20 |
-0.01 |
|
10 |
-0.39 |
1.89 |
0.17 |
-0.01 |
|
11 |
-0.38 |
1.92 |
0.15 |
-0.01 |
|
12 |
-0.38 |
1.90 |
0.13 |
-0.01 |
|
13 |
-0.38 |
1.91 |
0.10 |
0.00 |
|
14 |
-0.37 |
1.92 |
0.07 |
0.00 |
Figure 10. Stress comparison between before and after closure
(1) The temperature design parameter has a close relationship with the geographical position, direction, natural condition, material, and so on of a bridge and is difficult to determine. The temperature parameter is a complex random variable; it plays an important role in determining the stress and deformation of the structure. Particular attention should be paid to the influence of temperature on the construction control of long span bridges.
(2) The temperature load of sunlight, a sudden drop in temperature, and annual temperature variation will produce a temperature effect on a concrete bridge. Because the annual temperature variation is simple and the distribution is uniform, this factor is taken into account in engineering designs. Therefore, this paper mainly focuses on the calculation method for the temperature load effect of the sunlight and the sudden drop in temperature.
(3) On the basis of analyzing the reason for the temperature stress, a practical calculation method for the temperature stress is put forward, which is based on the basic assumption and the temperature distribution.
(4) The temperature difference load effect on a bridge is composed of two parts: the partial temperature difference stress and the integral stress of the structure.
The authors are grateful to the anonymous referees for their valuable remarks and helpful suggestions, which have significantly improved the paper. This research is supported by the national natural science foundation of China (Grant No. 41402267); The Key Projects of Science & Technology Pillar Program of Henan Province (152102310027); Natural Science Basic Research projects of the Education Department of Henan Province (Grant No. 15B560008); and the Young Backbone Teacher Support Program of Henan Province Colleges and Universities (Grant No: 2015GGJS-120) .
[1] Wang C.Q., “Research on temperature influence and design parameter adjustment of continuous rigid frame bridge,” Master’s Thesis, WuHan University of Technology, 2006.
[2] Meng L.X., “Research on the construction and control of large-span continuous rigid frame bridge,” Shandong University Master’s Thesis, 2008.
[3] Liu L.J., He S.H., Song Y.F., “Analysis of temperature stress in control of bridge construction,” China Journal of Highway and Transport, vol. 17, no. 1, pp. 53-56.2004. DOI: 1001-7372(2004)01-0053-04.
[4] Wang Y., “Finite element analysis of continuous girder bridge in cantilever construction,” Master’s Thesis, HeFei University of Technology, 2009.
[5] Wang M, Xun D.L, Liu Y., “Research on thermal gradient effect of Su-Tong Bridge Tower,” Journal of China Three Gorges University(Natural Sciences), vol. 29, no. 4 , pp. 321-324, 2007. DOI: 10.3969/j.issn.1672-948X.2007.04.010.
[6] Gao B.B., “The study on temperature field and mode of temperature gradient of continuous rigid frame bridge with high piers and long spans,” Master’s Thesis, Tongji University, 2008.
[7] Cheng Y.Y., “The static simulation and design parameters impact analysis of long-span continuous rigid frame bridge,” Master’s Thesis, Changsha University of Science Technology, 2009.
[8] Wu Fang-Wen, Zhao Lei, “Construction control of prestressed concrete continuous rigid frame bridge with tall pier and thin wall,” Building Science Research of Sichuan, vol. 32, no. 1, pp. 134-137, 2006. DOI: 10.3969/j.issn.1008-1933.2006.01.039.
[9] Ou Z.K., “Control technology for long-span prestressed concrete continuous beam bridge construction,” Science Technology and Engineering, vol. 9, no. 18, pp. 5596-5599, 2009. DOI: 1671-1819(2009)18-5596-04.
[10] Wu F.W, Fang H., Zhao L., “Ansys of stress supervision monitoring during construction of large-span continuous rigid frame bridge,” Railway Engineering, no. 9, pp. 6-8, 2005. DOI: 10.3969/j.issn.1003-1995.2005.09.003.
[11] Wang Z.Q., “Construction monitoring and simulation analysis of Wenfu Passenger Dedicated Railway 64 meters simply-supported girder bridge for Baima River,” Master’s Thesis, BeiJing Jiaotong, 2008.
[12] Zhang Z.L., “Construction control of super-span continuous rigid frame structure bridge,” Science Technology and Engineering, vol. 22, no. 10, pp. 5588-5591, 2010. DOI: 10.3969/j.issn.1671-1815 2010.22.056.
[13] Di J., “Simulation of construction control for one inclined to wer cable 2 stayed bridge of steel2concrete composite box girder without back stay,” Journal of Chang’an University (Natural Science Edition), vol. 24, no. 3, pp. 43-47, 2004. DOI: 10.3321/j.issn:1671-8879.2004.03.011.
[14] Wu F.W., “The alignment control analysis of cantilever construction for continuous rigid frame bridge,” Journal of Railway Engineering Society, vol. 94, no. 4, pp. 29-31, 2006. DOI: 10.3969/j.issn.1006-2106.2006.04.008.
[15] Liang Q.X., Tang X.B., “Construction monitoring and control of the main bridge of Liuzhou Long Tun Interchange,” Western China Communications Science & Technology, no. 2, pp. 44-47, 2006. DOI: 10.3969/j.issn. 16 73-4874.2006.02.014.
[16] Liu B., “Study on the theory and its methods of prestressed concrete bridge dynamic load test,” Master’s Thesis, WuHan University of Technology, 2008.
[17] Hui li Wang, H. Wang, S.F. Qin et al., “Seismic analysis of prestressed bridge pier based on fiber section,” Procedia Engineering, vol. 21, no. 1 pp.354-362, 2011. DOI: 10.1016/j.proeng.2011.11.2026.
[18] Marta Slowik, Tomasz Nowicki, “The analysis of diagonal crack propagation in concrete beams,” Computational Materials Science, vol. 52, no. 1, pp. 261-267, 2011. DOI: 10.1016/j.commatsci.2011.02.012.
[19] Shingo Asamoto, Ayumu Ohtsuka, Yuta Kuwahara et al., “Study on effects of solar radiation and rain on shrinkage, shrinkage cracking and creep of concrete,” Cement and Concrete Research, vol. 41, no. 6, pp. 590-601, 2011. DOI: 10.1016/j.cemconres.2011.03.003.
[20] F. BenboudJema, F. Meftah, J.M. Torrenti., “The interaction between drying, shrinkage, creep and cracking phenomena in concrete,” Engineering Structures, vol. 27, no. 2, pp. 239-250, 2005. DOI: 10.1016/j.engstruct. 2004. 09. 012
[21] P.G. Papadopoulos, J. Arethas, P. Lazaridis, et al., “A simple method using a truss model for in-plane nonlinear static analysis of a cable-stayed bridge with a plate deck section,” Engineering Structures, vol. 30, no. 1, pp. 52-53, 2008. DOI: 10.1016/j.engstruct.2007.03.001.
[22] N. Ogawa, Y. Kamiya, T. Yoshikawa, et al., “Nozomi Bridge-A hybrid structure of stress-ribbon deck and truss,” Structural Concrete, vol. 7, no. 4, pp. 145-147, 2006. DOI: 10.1680/stco.2006.7.4.145.
[23] Jang S., Jo H., Cho S., et al., “Structural health monitoring of a cable-stayed bridge using smart sensor technology: Deployment and evaluation,” Smart Structures and Systems, no. 6, pp. 439-459, 2010. DOI: 10.12989/sss. 2010. 6.5_6. 461.
[24] Chae M.J., Yoo H. S., Kim J.Y., et al., “Development of a wireless sensor network system for suspension bridge health monitoring,” Automation in Construction, pp. 21, 237-252, 2012. DOI: 10.1016/j.autcon.2011.06.008.
[25] Mingyue Zhao, Dongxue Zhao, Zhixia Jiang, Diaomei Cui, Jie Li and Xingyi Shi., “The gray prediction GM(1,1) Model in traffic forecast application,” Mathematical Modelling of Engineering Problems, vol. 2, no. 1, pp. 17-22, 2015. DOI: 10.18280/mmep.020105.
[26] Jun Song, Fuyan Chen., “Calculation Model for Thermo-mechanical Coupling and 3D Numerical Simulation for Concrete Tower of Cable-stayed,” Environmental and Earth Sciences Research Journal, vol. 2, no. 1, pp. 13-16, 2015. DOI: 10.18280/eesrj.020103.
[27] Wang Xin-hua, Jiao Yu-lin., “Study on the heat transfer characteristic of heat pipe containing magnetic nano-fluids strengthened by magnetic field,” Mathematical Modelling of Engineering Problems, vol. 2, no. 1, pp. 5-8, 2015. DOI: 10.18280/mmep.020102.
[28] Li Yu, Wei Dongdong, Mu Zhu, Xiong Zhihao, Wang Yinghua, Yin Weishi, “Study of the time-collocation of signal lamp at intersection,” Mathematical Modelling of Engineering Problems, vol. 2, no. 1, pp. 13-16, 2015. DOI: 10.18280/mmep.020104.