OPEN ACCESS
Shading represents one of the main aspects influencing PV generators energy production. The presence of close shading elements, such as adjacent buildings, or shading originated by panels themselves, can strongly limit their energy production. Shading impact is not only evident on energetic aspects, but also on the economic and environmental ones: in the most unfavourable cases, in fact, the investment payback period tends to increase to a large extent and also CO2 avoided emissions are consequently reduced. In this aim, in the study two different shading effects on energy production of a PV generator, installed on a building roof have been analysed: that originated by its tilted strings, in order to determine their optimum tilt angle in relation to both energy production and total surface, and that projected by an adjacent tower building, in order to evaluate production trend vs. obstacle distance and height. For the latter case, the shading influence on the economic and environmental items have been analysed, respectively assessing the Net Present Cost and avoided CO2 emissions.
Photovoltaic systems, PV panels tilt, PV panels shading, Energy production optimization.
In order to face the pressing necessity to reduce fossil fuels dependence and contain dangerous climate changes, worldwide community [1]–[3] and particularly UE have actively put effort into energy saving and diffusion of renewable energy sources, above all in the building sector, presently responsible of more than 40% of the total energy consumption. Consequently such themes have today a preeminent role, especially with a view to UE objectives to be accomplished by 2020, aimed at 20% reduction of energy consumption and greenhouse gas emissions and 20% increase in RES energy production share.
As concerns building sector, among RES energy production technologies, presently the photovoltaic one shows to be the most emergent, thanks to its versatility and modularity that make it one of the most suitable for distributed energy production [4]–[7].
Anyway an important factor to be considered in PV plants designing is the presence of shadowing elements, which might affect overall system efficiency, markedly reducing yielded production. Due to the series connections of cells within modules and of panels in strings, in fact, partial shading of modules might affect the whole string output, reducing or, in the worst cases, stopping energy production (recently bypass diodes and per panel microinverters are giving help to the situation).
Particular attention must consequently be addressed to site orography next to installation area, as well as to presence of grass and built environment morphology (buildings overlooking PV field) and also to shadows generated by rows themselves.
As concerns the problem, in the study two different shadowing situations on a PV generator installed on a building roof have been analysed. They respectively consist in shadows originating from row inclination itself and from an adjacent building; in both cases yielded production has been evaluated.
Particularly referring to the former case, energy production has been analysed as a function of panels tilt angle, optimizing it not only referring to yielded energy, but also with reference to the total occupied surface. This in order to optimize energy output per capacity installed for fixed area, as frequently posed by space limitations in island and urban settings.
Presently, in fact, the low energy intensity of renewables per unit area compared to high energy consumption per unit area in settings of high population densities is attracting increasing attention from technicians and researchers [8], given worldwide people’ dramatic moving towards urban areas.
Subsequently, adopting the optimized tilt angle, an external shadowing element has been added, consisting in a tower building, the distance and height of which have been varied with fixed step in order to determine corresponding energy production.
Finally, the influence of generated shadows has been evaluated also with reference to economic items and avoided emissions.
In different cases panels are tilted: in order to increase direct beam captation (such as in ground based PV farms) or for installations on tilted surfaces (such as falde, vertical surfaces, supports on stacks, etc.); inclination has, in any cases, the advantage to reduce dirt accumulation on panel surface, favouring its natural cleaning through rain.
A typical shading situation is that present between rows when panels are tilted on an horizontal plane: in such case suitable row-spacing is required in order to minimize shadowing between adjacent rows. The exigency to avoid shadows anyway conflicts with that of limiting available surface.
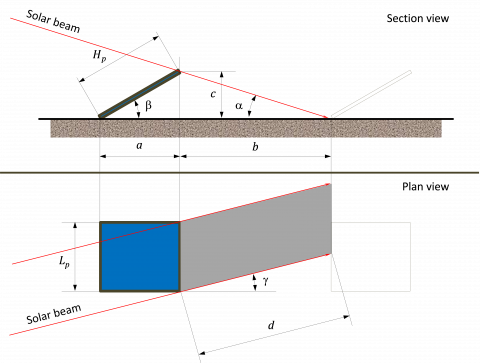
Figure 1 shows the extension of a tilted panel shadowing in dependence on elevation and azimuth angles in the site.
Figure 1. Space to be left between rows to avoid cross-shading
With reference to the figure, it is possible to write the trigonometric relation providing the required occupation (panel occupation + space between rows), Dmin, to avoid cross-shading, as a function of solar azimuth (γ) and altitude (α) angles. It is:
$a=H_{p} \cos \beta \quad c=H_{p} \sin \beta$(1)
$d=\frac{c}{\tan \alpha}=\frac{H_{p} \sin \beta}{\tan \alpha}$(2)
$b=d \cos \gamma=\frac{H_{p} \sin \beta}{\tan \alpha} \cos \gamma$(3)
where:
Hp = panel height;
β = panel tilt angle;
γ = solar azimuth angle;
α = solar altitude angle at 8:30 AM on 21st December.
Consequently:
$D_{\min }=a+b=$$H_{p} \cos \beta+\frac{H_{p} \sin \beta}{\tan \alpha} \cos \gamma=H_{p} \cos \beta\left(1+\frac{\tan \beta}{\tan \alpha} \cos \gamma\right)$(4)
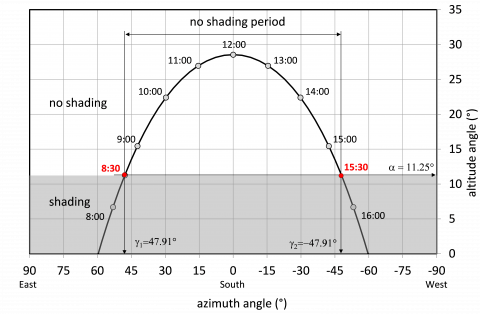
The space to be left between rows to avoid cross-shading can be determined through sun path diagrams.
If panels (in this case south oriented) are to deliver electricity even on the shortest days of the year, around winter solstice, in the northern hemisphere, one must evaluate how far a panel shadow will extend on the ground in correspondence to the worst case, on 21st December at 8:30 AM, that is 1 hour after sunrise (Figure 2).
Figure 2. Sun path referring to 21st December, with panel shading hours indication
PV panels optimal inclination has long been defined in terms of maximizing yearly electricity yield per panel area in relation to the site latitude: in this aim the search of optimum tilt angle has produced a vast body of literature [9]–[17]. Anyway, in view of space limitation, very frequent in urban settings, such notion needs to be redefined, paying more attention to space left vacant between rows in order to avoid cross-shading. Nevertheless the two approaches might be conflicting, as panel inclination necessarily reduce available space, so that maximum energy output per generation capacity is different from maximum energy yield per given area.
Within this frame, the analysed case study has concerned the determination of optimum tilt angle, not only referring to yielded energy, but also with reference to total occupied surface (optimizing energy output per capacity installed for fixed area) for a PV plant installed on the roof of a residential building located in Reggio Calabria (latitude 38° 10’; longitude 15° 63’). The city is characterized by monthly average temperature and irradiation values reported in Figure 3. The yearly total irradiation is equal to about 1700 kWh/m2.
Figure 3. Solar radiation on horizontal plane and average temperature in Reggio Calabria
The adopted PV plant is composed by polycrystalline sylicon panels (η = 13.4%; NOCT =47°C; β = -0.45%/°C), with a peak power of 220 W and dimensions 1.66 x 0.99 m2. It is installed on a rectangular coverage having a surface of about 180 m2 (17 m x 10.60 m).
In absence of obstructions, the selected panel orientation is the most favourable (South); as far as its set up is concerned, both portrait and landscape ones have been considered.
Row-shading has been analysed for tilt angles from 0° to 90°, with 10° step, determining through (4), the required distance to avoid cross-shadow for each step. As above said, the analysis aimed to determine optimum distance b within rows avoiding cross-shading in the worst condition, winter solstice, that is 21st December, at 8:30 AM (1 hour after sunrise), corresponding to a sun elevation angle of 47.91° and azimuth of 11.25°.
For each panel set up and tilt angle the number of panels and strings have been determined. A comparison has shown that, due to its lower height, the landscape configuration generates smaller shadows, allowing a greater number of panels to be used, even if only of a few units: for such reason the analysis has been referred to such configuration.
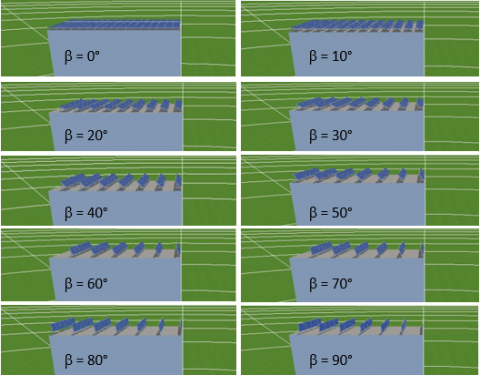
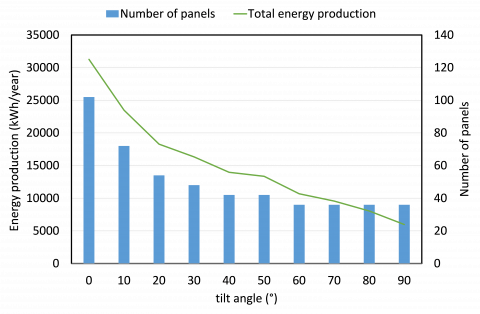
In Figure 4, a representation of the number of strings (each including 10 panels) for increasing tilt angles is reported, pointing out increasing row spacing for increasing inclination and consequently decrease of panel number.
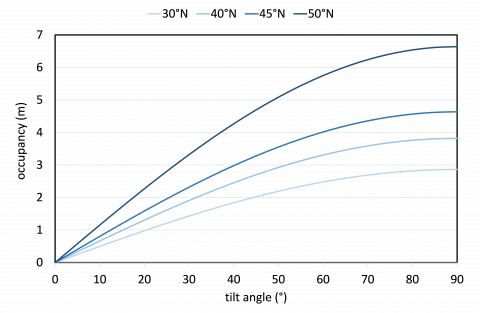
Row spacing has been reported vs. tilt angle (for 30°, 40°, 50° latitudes, Figure 5), pointing out little increase vs. latitude.
Energy production has been assessed using PVSOL software; its values for each tilt angle are reported in Table 1, together with row spacing and the string number.
Figure 6 depicts the number of panels and produced energy as a function of inclination, whereas Figure 7 reports both panel and total energy production. Finally, Figure 8 reports, for each tilt angle, total and specific (referred to occupied surface) panel productions.
Table 1 and Figures 6-7 show that, for limited installation surfaces, maximum production is associated to maximum panel occupancy, corresponding to flat installation. In such case energy production is almost double (about 31,000 kWh) than that obtained (about 17,000 kWh) by optimally tilted panels (30° at considered latitude).
As a matter of fact, production adjustment factors for non-optimum tilt angles point out very little reductions for zero tilted panels; moreover, Beringer [18] demonstrates that panel tilt angle is almost irrelevant with respect to production.
In addition, Figure 8 further confirms above results. For tilt angles smaller than the optimum one (30°), in fact, little increase of total energy, but marked decrease of the specific one (referred to occupied surface) can be noted starting from flat panel occupancy (0°); for such angle the maximum difference between total and specific energy is observed. On the contrary, for tilt angles greater than optimum one, a reduction of both total and specific production is obtained.
This would suggest modifying the current paradigm optimum inclination, commonly referred to maximum production per installed capacity, rather referring it to unitary available surface.
Figure 4. Number of rows vs. tilt angle
Figure 5. Row spacing vs. tilt angle as a function of latitude
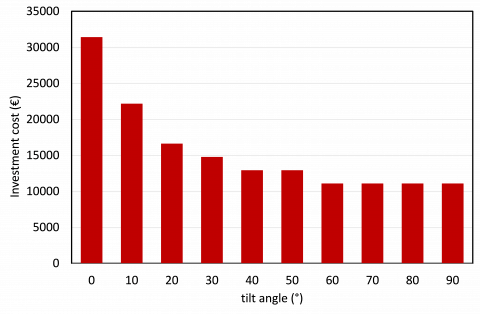
Moreover, referring to an investment cost of 1.4 €/W, the total investment cost and its ratio to energy production are reported as a function of tilt angle both in Table 2 and Figures 8-9. Differently from the energetic results, the cheapest production (€/kWh) corresponds to 30° tilt angle.
Table 1. Row spacing, number of strings and energy production (total and specific) vs. tilt angle
|
Tilt angle β (°) |
Required spacing b (m) |
Number of strings |
Total energy production (kWh) |
Density of energy (kWh/m2) |
|
0 |
0.00 |
17 |
31 263 |
186.5 |
|
10 |
0.58 |
12 |
23 486 |
140.1 |
|
20 |
1.14 |
9 |
18 281 |
109.1 |
|
30 |
1.67 |
8 |
16 329 |
97.4 |
|
40 |
2.14 |
7 |
13 971 |
83.3 |
|
50 |
2.56 |
7 |
13 350 |
79.6 |
|
60 |
2.89 |
6 |
10 682 |
63.7 |
|
70 |
3.14 |
6 |
9 566 |
57.1 |
|
80 |
3.29 |
6 |
8 037 |
47.9 |
|
90 |
3.34 |
6 |
5 975 |
35.6 |
Table 2. Investment cost and its ratio to production vs. tilt angle
|
Tilt angle β (°) |
Number of strings |
Investment cost (€) |
Investment cost/Production (€/kWh) |
|
0 |
17 |
31 416 |
1.00 |
|
10 |
12 |
22 176 |
0.94 |
|
20 |
9 |
16 632 |
0.91 |
|
30 |
8 |
14 784 |
0.91 |
|
40 |
7 |
12 936 |
0.93 |
|
50 |
7 |
12 936 |
0.97 |
|
60 |
6 |
11 088 |
1.04 |
|
70 |
6 |
11 088 |
1.16 |
|
80 |
6 |
11 088 |
1.38 |
|
90 |
6 |
11 088 |
1.86 |
Figure 6. Produced energy and number of panels vs. tilt angle
Figure 7. Energy production vs. tilt angle
Figure 8. Energy production, total and referred to unitary occupied surface, vs tilt angle
Figure 9. Investment cost vs. tilt angle
Figure 10. Investment cost/production vs. tilt angle
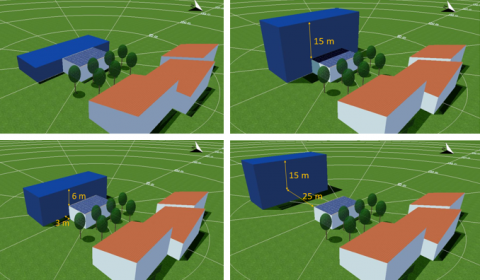
In the next analysis, panels are subject to different shading conditions, generated by an adjacent tower building, 40 m large, set at variable distances and heights from the generator (Figure 11).
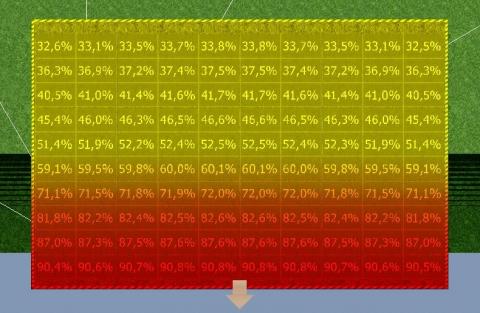
In order to determine shadowing effects on panels, a 3D calculation and visualization has been used: it provides shadow distribution, at fixed time steps, in grid points on panel surfaces, allowing determination of yearly average irradiation reductions. An example of such representation is reported in Figure 12.
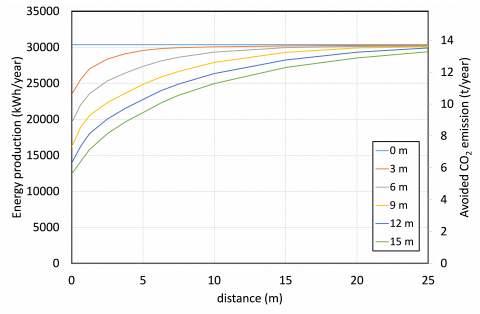
Energy production and its reduction have subsequently been determined, for each panel, as a function of the building distance and height; the analysis is reported in Figures 13, 14, 15 and 16.
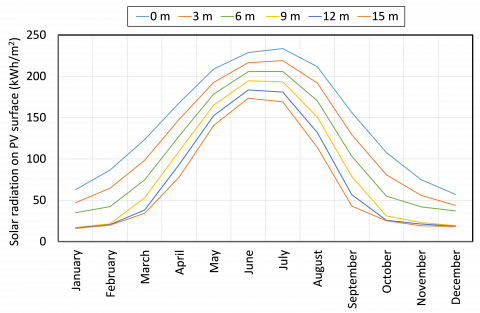
Particularly Figure 13 reports irradiation for different building heights, with reference to its worst distance (equal to 0), whereas Figure 14 shows, for the different cases, both energy production and CO2 avoided emissions.
It can be observed that PV production decreases from about 31,260 kWh/year in the best case (no shadow) to 12,410 kWh/year in the worst one (closest distance and tallest building).
Figure 11. Variation of building distance and height
Consequently, in presence of marked shadowing (close and tall obstacle) avoided emissions are significantly reduced: particularly in the worst case they become less than half (about 5.8 t/year) the amount obtainable in lack of shadow (about 13.8 t/year).
Figure 12. Shadow distribution and irradiation percentage on panels
Figure 13. Yearly irradiation on PV generator for zero distance from the shadowing building
Figure 14. Yearly energy production and avoided CO2 emissions
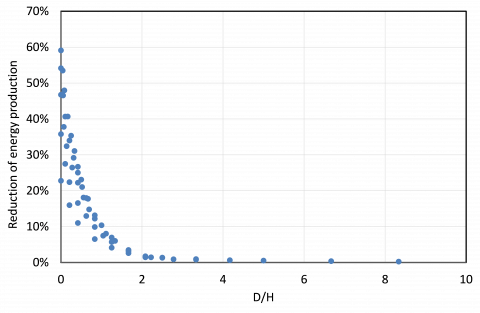
Finally, in Figures 15 and 16 the per cent reduction of yearly energy production, respectively vs. distance and distance/height, are reported.
Figure 15. Reduction of yearly energy production
Figure 16. Reduction of yearly energy production vs. distance/height
4.1 Economic analysis
The economic analysis of the various configurations of the designed system has been carried out assessing the Net Present Cost (NPC), an economic parameter that, as a function of present costs and revenues, allows to evaluate the negative shading influence on the plant at the end of its 25 years lifetime:
$N P C=I_{0}+\sum_{i=0}^{N} \frac{C_{i}-B_{i}}{(1+r)^{i}}$(5)
where I0 is the investment cost, Cj and Bj are the costs and the revenues (respectively due to energy purchases and sells) within the jth year, N is the number of years forming the project lifetime and r is the discount rate.
As far as energy purchase is concerned, in order to esteem the annual cost, the Single National Price (SNP), settled by the Italian Authority [19], has been used (0.10 €/kWh). Consequently:
$C_{j}=0.10 \times E_{p, j}+0.6 \times P_{p}$(6)
where $E_{p, j}$ is the purchased energy during j year and Pp is the peak power of the PV plant (22 kWp).
As concerns the energy sell to the grid, for powers > 20 kWp it is ruled by the dedicated withdrawal regime [19]: in such case the electricity withdrawal price, equal to the hourly zonal price on the power exchange, is 0.048 €/kWh, with an operating cost of 0.6 €/kWp.
In addition, with a view to calculating the annual revenue Bj, possible profits deriving from white certificate schemes, also known as Energy Efficiency Titles (EET), have been considered. In this case the incomes (which, for the Italian law, only regard the first five years) are yielded by EET trades and a price of 110 €/toe has been esteemed [20].
As a consequence, the annual revenues are:
$B_{j}=0.048 \times E_{w, j}+110 \times E_{w P, j} \quad$ if $j \leq 5$(7)
$B_{j}=0.048 \times E_{w, j} \quad_{\text { if }} j>5$(8)
where, $E_{w, j}$ is the withdrawn electricity and EwP,j the primary energy delivered to the grid, during the j year.
The discount rate r is equal to 1%.
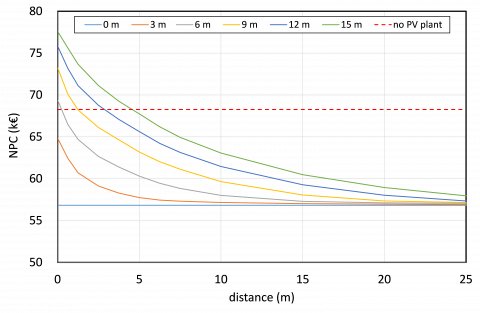
In Figure 17, NPC values as a function of the obstacle distance and height are reported, in comparison with the value obtained when no plant is present (energy provided only from the electric grid).
The figure points out that, for very close distances between the two buildings (< 5 m), starting from a 3m height difference, the plant NPC is higher than present cost of energy withdrawal from the grid; for heights > 5 m, on the contrary, PV installation shows to be cheaper, for any height of the shadowing building.
In the most favourable case (no shadow), the difference between NPCs is greater than 10,000 €.
Figure 17. NPC vs building distance, for different heights
In order to reduce fossil fuel use, UE has actively put effort, aiming at 20% greenhouse gas emissions reduction and 20% increase in RES energy production share by 2020. Such effort is mostly concentrated in the building sector, presently responsible of over 40% total energy consumption.
In such sector, among RES technologies, photovoltaic one shows to be the most rising, thanks to its modularity and simplicity that make it suitable for distributed production.
In the present study, attention has been paid to a fundamental aspect of such technology, shadowing, that may dramatically affect system efficiency, reducing yielded production. In this concern, in the study two different shadowing situations have been analysed: both cross-shading on a PV generator installed on a roof, having origin from its rows inclination, and shadows projected on its panels by an adjacent building.
Particularly for installations suffering from limited surface it is important to determine optimum tilt angle avoiding cross-shading. In this aim, yielded production has been evaluated as a function of panel tilt, optimizing it not only referring to produced energy, but also to total occupied surface (optimization per capacity installed for fixed area), as frequently posed by space limitations in urban settings.
The analysis has provided that maximum production is associated to maximum occupancy, which is for flat installation: in such case energy production is almost double than that provided by optimally tilted panels (30° at considered latitude).
Moreover, flat inclination points out the greatest difference between specific (referred to occupied surface) and total panel production.
This evidence would suggest modifying the current paradigm optimum inclination, commonly referred to maximum production per installed capacity, rather referring it to unitary available surface.
As concerns shadowing generated by external factors, such as an adjacent tower building facing the described generator, in order to analyse its effect, building distance and height have been varied with fixed step, determining corresponding production.
It can be observed that energy production decreases from about 31,263 kWh/year in the best case (no shadow) to 12,414 kWh/year in the worst one (closest distance and tallest building).
In addition, the influence of generated shadows has been evaluated also with reference to CO2 avoided emissions: it can be observed that in presence of marked shadowing (close and tall obstacle) they are significantly reduced, in the worst case becoming less than half (about 5.8 t/year) of those avoidable for lack of shadow (about 13.8 t/year).
Finally, the economic items have been carried out assessing the Net Present Cost (NPC), in order to evaluate the shading influence on energy production at the end of the 25 years lifetime of PV plant.
The analysis has shown that, for very close distances between buildings (< 5 m), starting from a 3m height difference, NPC is higher than that referring to energy withdrawal from the grid; for heights > 5 m, on the contrary, PV installation shows to be cheaper, for any height of the shadowing building.
In the most favourable case (no shadow), the difference between plant and grid NPCs is greater than 10,000 €.
|
Bj |
revenues within the jth year |
||
|
Cj |
cost within the jth year |
||
|
$E_{p, j}$ |
purchased energy during the jth year, kWh |
||
|
Hp |
pannel height, m |
||
|
I0 |
investment cost |
||
|
Pp |
peak power of the PV plant, kWp |
||
|
Greek symbols |
|
||
|
α |
solar altitude angle at 8:30 AM on 21st December, ° |
||
|
β |
panel tilt angle, ° |
||
|
γ |
solar azimuth angle, ° |
||
[1] R. Khorshidi, F. Shabaninia and T. Niknam, “A new smart approach for state estimation of distribution grids considering renewable energy sources,” Energy, vol. 94, pp. 29-37, 2016. DOI: 10.1016/j.energy.2015.10.096.
[2] P. Mesaric and S. Krajcar, “Home demand side management integrated with electric vehicles and renewable energy sources,” Energy and Buildings, vol. 108, pp. 1-9, 2015. DOI: 10.1016/j.enbuild.2015.09.001.
[3] D. Gattuso, A. Greco, C. Marino, A. Nucara, M. Pietrafesa and F. Scopelliti, “Sustainable Mobility: Environmental and Economic Analysis of a Cable Railway, Powered by Photovoltaic System,” International Journal of Heat and Technology, vol. 34, pp. 7-14, 2016. DOI: 10.18280/ijht.340102.
[4] J. D. Bergesen and S. Suh, “A framework for technological learning in the supply chain: A case study on CdTe photovoltaics,” Applied Energy, vol. 169, pp. 721-728, 2016. DOI: 10.1016/j.apenergy.2016.02.013.
[5] J. Paska and T. Surma, “Electricity generation from renewable energy sources in Poland,” Renewable Energy, vol. 71, pp. 286-294, 2014. DOI: 10.1016/j.renene.2014.05.011.
[6] C. Marino, A. Nucara, M. Pietrafesa and A. Pudano, “An energy self-sufficient public building using integrated renewable sources and hydrogen storage,” Energy, vol. 57, pp. 95-105, 2013. DOI: 10.1016/j.energy.2013.01.053.
[7] C. Marino, A. Nucara, M. Pietrafesa and A. Pudano, “Economical comparison between a stand-alone configuration of a PV system with energy storage and a grid-connected one,” in SDEWES 2013, vol., pp. 7–14, 2013.
[8] M. Weissenbacher, “Towards New Renewable Energy Policies in Urban Areas : The Re-definition of Optimum Inclination of Photovoltaic Panels,” Journal of Sustainable Development of Energy, Water and Environment Systems, vol. 3, pp. 372-388, 2015. DOI: 10.13044/j.sdewes.2015.03.0028.
[9] K. Bakirci, “General models for optimum tilt angles of solar panels: Turkey case study,” Renewable and Sustainable Energy Reviews, vol. 16, pp. 6149-6159, 2012. DOI: 10.1016/j.rser.2012.07.009.
[10] M. Benghanem, “Optimization of tilt angle for solar panel: Case study for Madinah, Saudi Arabia,” Applied Energy, vol. 88, pp. 1427-1433, 2011. DOI: 10.1016/j.apenergy.2010.10.001.
[11] Y. P. Chang, “Optimal the tilt angles for photovoltaic modules in Taiwan,” International Journal of Electrical Power and Energy Systems, vol. 32, pp. 956-964, 2010. DOI: 10.1016/j.ijepes.2010.02.010.
[12] A. Gharakhani Siraki, P. Pillay, “Study of optimum tilt angles for solar panels in different latitudes for urban applications,” Solar Energy, vol. 86, pp. 1920-1928, 2012. DOI: 10.1016/j.solener.2012.02.030.
[13] F. Jafarkazemi and S. A. Saadabadi, “Optimum tilt angle and orientation of solar surfaces in Abu Dhabi, UAE,” Renewable Energy, vol. 56, pp. 44-49, 2013. DOI: 10.1016/j.renene.2012.10.036.
[14] M. Kacira, M. Simsek, Y. Babur and S. Demirkol, “Determining optimum tilt angles and orientations of photovoltaic panels in Sanliurfa, Turkey,” Renewable Energy, vol. 29, pp. 1267-1275, 2004. DOI: 10.1016/j.renene.2003.12.014.
[15] E. D. Mehleri, P. L. Zervas, H. Sarimveis, J. A. Palyvos and N. C. Markatos, “Determination of the optimal tilt angle and orientation for solar photovoltaic arrays,” Renewable Energy, vol. 35, pp. 2468-2475, 2010. DOI: 10.1016/j.renene.2010.03.006.
[16] I. H. Rowlands, B. P. Kemery and I. Beausoleil-Morrison, “Optimal solar-PV tilt angle and azimuth: An Ontario (Canada) case-study,” Energy Policy, vol. 39, pp. 1397-1409, 2011. DOI: 10.1016/j.enpol.2010.12.012.
[17] H. Wada, F. Yamamoto, K. Ueta and T. Yamaguchi, “Generation characteristics of 100 kW PV system with various tilt angle and direction arrays,” Solar Energy Materials and Solar Cells, vol. 95, pp. 382-385, 2011. DOI: 10.1016/j.solmat.2010.04.016.
[18] S. Beringer, H. Schilke, I. Lohse and G. Seckmeyer, “Case study showing that the tilt angle of photovoltaic plants is nearly irrelevant,” Solar Energy, vol. 85, pp. 470-476, 2011. DOI: 10.1016/j.solener.2010.12.014.
[19] GSE. (2016, Jan.). Gestore dei Servizi Energetici GSE S.p.A, [Online]. Available: http://www.gse.it/en
[20] GME. (2016, Jan.). Gestore dei Mercati Energetici S.p.A. [Online]. Available: http://www.mercatoelettrico.org/en