OPEN ACCESS
In this paper, the vortex throttle model and the conventional throttle model were established and compared. Both the throttles’ air flow within the model were simulated. Air flow velocity and flow were compared. The results show that, through the forming of a swirling motion of the air, the vortex throttle’s air flow velocity and flow rate were increased at each same degree of valve opening. The vortex throttle’s turbulent kinetic energy also helps the entry of air, thereby increasing the amount of air entering the engine. On this basis, engine performance tests were carried out on two engines installed with each type of throttle. Performance test results show that, under the same power and torque output, the economy of the engine was enhanced by the vortex throttle. The results of simulation analysis and performance tests show that the vortex throttle created a swirling motion, which increases the amount of intake air to improve engine performance.
Vortex throttle, Conventional throttle, Flow velocity, Performance test.
In recent years, global energy crises and environmental concerns have prompted automotive engine manufacturers to provide high energy efficiency of the internal combustion engine [1]. Changing the design of the internal combustion engine components to improve combustion efficiency is considered to be an effectual measure [2-4].
The throttle is an integral device in the internal combustion engine, which controls the amount of air entering the engine [5]. When the engine is running, the throttle will form negative pressure due to the suction effect of the downward motion of the piston, so that air at atmospheric pressure flows through the throttle, and finally into the combustion chamber via the intake manifold [6-8]. Different angles of the throttle will change the flow rate, which will affect the velocity of the engine [9]. In the air inlet and outlet boundary conditions being defined, the pressure difference between the front and rear of the throttle valve is smaller. Thus, the throttling effect of the throttle valve becomes smaller. At the same time, air flowing through the throttle valve, and the more air into the cylinder charge will be larger. In such a case, more fuel may be injected into the cylinder, thereby increasing the engine output power. If the fuel injection quantity remains unchanged, the engine fuel economy can be improved since the air-fuel ratio will increase [10]. Through the establishment of the working principle of the throttle, model analysis and the study of air movement can provide a theoretical basis for the design and shape matching engine calibration [11].
By optimizing the design and control of the throttle, the air-fuel ratio can be accurately controlled to improve engine power, economy, and lower emissions [12-14]. The Electronic Throttle Control Strategy has been utilized to carry out extensive research on various types of engines. Also it attained a higher engine performance [15, 16]. In fact, it is possible to enhance engine performance by improving the traditional throttle structure. Many of the structural designs of the throttle valve is used, and among them is the vortex throttle design.
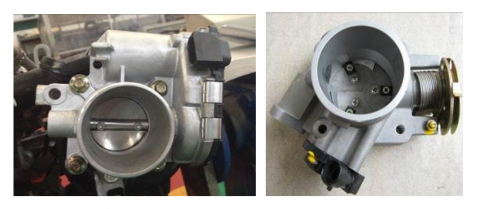
Figure 1. Conventional throttle and vortex throttle
The shape of the conventional throttle and the vortex throttle are shown in Figure 1. In the rear of the throttle valve, a negative pressure zone can be easily formed due to the restriction of the conventional throttle structure design [17]. As shown in Figure 1, the vortex throttle is improved to having three valves, which is unlike the conventional throttle valve. The throttle valve is changed to the shape of a handheld fan. Valves open along the same direction, which reduces the effect of the negative pressure zone. When the air flows through the vortex throttle, three valves organize the flow of air to form a swirling motion, which can increase the amount of intake air. Whith change to the throttle valve , the vortex throttle performance improves. Both of the above throttles’ air flow were researched in this article, and an engine performance test was carried out in order to compare the effect of the structure on the engine throttle.
The air flow is governed by the conservation of mass and momentum equations for an incompressible steady flow with constant properties and a single phase in a two-dimensional domain. When air flows through the throttle valve, it satisfies the mass conservation equation and momentum conservation movement, which is expressed by the following formulas (1) and (2).
$\frac{\partial \rho}{\partial t}+\frac{\partial(\rho \mu)}{\partial \chi}+\frac{\partial(\rho v)}{\partial y}+\frac{\partial(\rho \omega)}{\partial z}=0$(1)
In which, $\rho$ represents the density of the fluid; $t$ represents the time; $\mu, v$ and $\omega$ are the velocity vectors in the $\chi, y$ and $z$ directions component respectively.
In the non-accelerated inertial coordinate system, the equation of momentum conservation for the $\dot{\imath}$ direction, is expressed by the following formula (2).
$\frac{\partial}{\partial t}\left(\rho \mu_{i}\right)+\frac{\partial}{\partial x_{j}}\left(\rho \mu_{i} \mu_{j}\right)=-\frac{\partial p}{\partial x_{i}}+\frac{\partial \tau_{i j}}{\partial x_{j}}+\rho g_{i}+F_{i}$(2)
In which, $p$ is the static pressure; $\tau_{i j}$ is the stress tensor; $u_{i}, g_{i}$ and $F_{i}$ respectively are the speed in the $i$ direction, gravity force and volume of the external body force; $u_{j}$ is the speed in the $j$ direction; $x_{i}$ and $x_{j}$ are the vectors in the $i$ and $j$ directions respectively.
When fluid flow through the inlet and outlet boundaries, it meets the total flow of the Bernoulli equation. Therefore, it follows the Bernoulli equation.
$\frac{p_{1}}{\rho g}+z_{1}+\frac{\alpha_{1} v_{1}^{2}}{2 g}=\frac{p_{2}}{\rho g}+z_{2}+\frac{\alpha_{2} v_{2}^{2}}{2 g}+\sum h_{f}$(3)
In which, $p_{1}$ and $p_{2}$ represent the inlet and outlet sections’ pressure; $\rho$ represents the density of the fluid; $g$ represents the gravitational acceleration; $z_{1}$ and $z_{2}$ represent the position of the inlet and outlet section heads; $v_{1}$ and $v_{2}$ represent the velocity of the inlet and outlet sections. $\sum h_{f}$ is a cross-section from the inlet to the outlet section of the total loss along the way . $\alpha_{1}$ and $\alpha_{2}$ are kinetic energy correction coefficient inlet section and outlet cross-section, taking into account the role of turbulence, which can be a value of 1.
Since air is a compressible fluid, it has a Newtonian viscosity. When flowing through the throttle, air will generate partial losses along the way. Loss along the way is expressed by equation (4).
$h_{f}=\lambda \frac{L}{d} \frac{v^{\prime 2}}{2 g}$(4)
In which, $L$ represents the flow length of the tube; $d$ represents the flow tube diameter; $v^{\prime}$ represents the flow velocity; $\lambda$ represents the loss coefficient for the process. As to Laminar flow,$\lambda$ is calculated by the following formula (5).
$\lambda=\frac{64}{\operatorname{Re}}$(5)
In which, $\mathbf{R} \mathrm{e}$ represents the flow Reynolds. For smooth tube turbulence, $\lambda$ is determined by the Blasisus Formula, as expressed in formula (6).
$\lambda=\frac{0.3164}{\mathrm{Re}^{0.25}}$(6)
Partial loss is represented by the following formula (7).
$h_{f}=\zeta \frac{v^{\prime 2}}{2 g}$(7)
In which, $\zeta$ is a partial loss coefficient.
Figure 2. Mesh modal
When using numerical methods to solve the equations, the equations need to be spatially discrete regions. So, it is necessary to use a modal grid [18]. Both the throttle models were established, and the spatial grid of the flow field were divided after the STP format introduced in GAMBIT. When meshing, an adaptive mesh approach is adopted and Tet / Hybird is selected as grid cells. TGrid is selected as the type, which makes the division out of the grid to tetrahedral mesh based, with no negative volumes. The mesh models are established in GAMBIT, as shown in Figure 2.
Table 1. Boundary conditions
|
Heading1 |
Inlet |
Outlet |
|
Pressure (Pa) |
101325 |
85000 |
|
Temperature (K) |
300 |
300 |
|
Hydraulic diameter (m) |
0.054 |
0.052 |
|
Turbulence intensity |
5 % |
10 % |
The boundary conditions are fluid physical conditions to be met when the hydrodynamic equations resolve the boundary region. To accurately describe the flow field, an uncoupled pressure-based correction method for resolving steady-state was chosen for the boundary conditions. The standard $K-\mathcal{E}$ model and standard near the wall equation turbulence model were selected, and Simple algorithm was selected. When calculating the speed, conservation-relaxation parameters of 0.2 in speed were set, and pressure Asuncion relaxation factor was set to 0.1. Fluid inlet and outlet boundaries established for the various corresponding conditions shown in Table 1.
The maximum throttle degree angle opening is 90 °, which was defined as 100 %. Suppose the throttle valve opens at a degree of 15 % (13.5 °) or less, and the bypass valve opens when calculation [19]. In this case, the air flows into the rear through the bypass valve. When the opening is greater than 15 %, the throttle’s bypass valve will be closed by an electronic control, and the air flows into the throttle backward through the throttle valve.
The throttle valve will be opened gradually when the engine is running. At the start of the simulation, the calculation was set once to every 5 % (4.5°) open degree once. Relevant results will be analyzed below.
4.1 Flows velocity analysis
From the analysis of design theory, the vortex throttle valve should be able to form a more intense vortex motion and accelerate the flow of air. Thus, the disturbance effects of each of the two throttles’ air flow was analyzed by comparing the conventional throttle airflow velocity field and the vortex throttle.
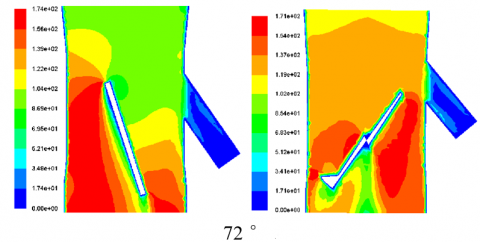
Figure 3 shows a section at the opening of the flow field velocity field in the X-Y coordinates. In Figure 3, the conventional throttle flow field is shown on the left, and the vortex throttle is on the right. When air flows through the throttle valve, a low-speed zone will form at the front and rear positions.
As can be seen from comparing the two throttles at 4.5 °, there is a small area of low variable velocity swirl around the vortex throttle valve is formed than normal throttle. In this case, the bypass valve is opened through which the air now mainly passes. In other words, the speed of the air flowing through the vortex throttle is larger than the average speed of the conventional throttle valve. When the throttle opening exceeds 13.5 °, the air mainly flows through the throttle valve when the bypass valve has been closed by an electronic control.
Of course, the throttle’s low-speed area is not constant, as it will change with the sized of the throttle opening. With the increasing throttle valve opening, both throttle valves low-speed zone areas in front of the valve gradually reduce. But in contrast, the vortex throttle low-speed zone area decreased faster.
When the engine throttle position exceeds 80 %, and the throttle opening exceeds 72 °, it can be considered as a large load opening range. As can be seen from Figure 3, before entering the large throttle opening degree, the vortex throttle’s maximum speed on the section was significantly higher than the conventional throttle.
And after the opening degree exceeds 72 °, the two throttle flow fields maximum speed are gradually approaching each other’s. Further, when the throttle is fully opened, the maximum flow field speed of the conventional throttle will be larger than that of the vortex throttle. After entering the large load opening range, the role of spoiler vortex will become gradually reduced and the throttle’s impediment to the air flow is reduced. Therefore, the maximum speed will be determined by the pressure difference between the inlet and the outlet sections. Since the total structural area of the vortex throttle valve is larger than the conventional throttle, in the overall circumstances, the hindrance of the vortex throttle valve in the flow direction was manifested.
Figure 3. Velocity field under different openings
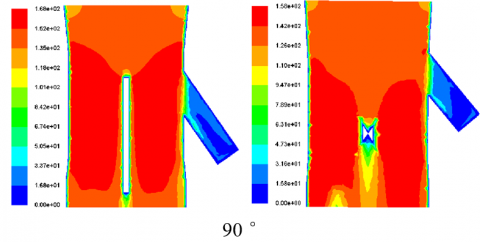
4.2 Outlet section velocity field
The air flow in the outlet section has a direct correlation with the amount of air entering the engine cylinder [8, 16]. Two kinds of the throttles’ velocity flow field in the outlet section are shown in Figure 4, which shows that before the bypass valve is closed, the speed of the bypass valve portion has relatively large perturbations. With the increasing size of the throttle opening, the bypass valve is closed, and the vortex throttle’s flow field characteristics had centrally symmetric distribution.
Figure 4. Outlet section velocity field
As can be seen by comparison, the vortex throttle’s low speed area in most of the opening degrees of the throttle valve is smaller than the conventional throttle, and the maximum speed on the outlet section is larger than the conventional throttle. When the throttle valve is fully opened, the speed of the conventional throttle is greater than that of the vortex throttle on outlet interface.
In the process of the throttle valve going from 0 ° to being fully open, the average speed comparison results in the outlet section are shown in Figure 5. As can be seen, the average velocity of the outlet section increases with the throttle opening. When the range of the opening of the throttle valve exceeds 80 %, this increment becomes smaller, and the two different speeds gradually became equivalent.
Figure 5. Velocity in the outlet section
As smooth swirling motion is created, the average velocity of vortex throttles in the outlet is larger than the conventional throttle. But after entering the wide open range, the hindered movement of the throttle valve for air flow greatly reduced the influence of the vortex motion, with both speeds gradually becoming equivalent. When the throttle is fully open, the conventional variable throttle speed is gradually larger than the vortex throttle.
4.3 Flow in outlet section
Figure 6. Flow in outlet section
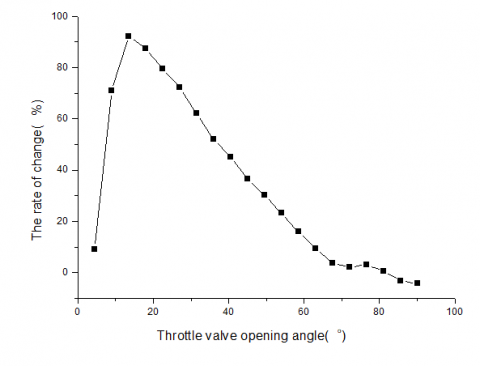
Figure 7. The rate of change
The mass flow is employed in the calculation, and the flow increments are defined by the following equation (8).
$\Delta=\frac{\left(M_{1}-M_{2}\right)}{M_{2}} \times 100 \%$(8)
In which, $M_{1}$ is the flow in the outlet section of the vortex throttle; $M_{2}$ is the flow in the outlet section of the conventional throttle. The two kinds of changes in the outlet flow of the throttle are shown in Figure 7. It can be seen that in the process of the throttle opening from a small degree to being fully opened, up until the middle of the process the incremental flow of the vortex throttle is very obvious. In fact, the engine is running at more moderate speeds. Accordingly, the throttle bringing more air into the engine at medium loads is advantageous overall.
5.1 Test instruments and conditions
To verify the influence of the shape of the throttle valve on engine performance, performance tests were carried out. The Vehicle Engine Performance Test Method (GB/T 18297-2001) and the Vehicle Fuel Consumption Test Method (GB/T 12545.1-2009) were adopted, and the test conditions and methods are in accordance with China national standards as stipulated in reference [20]. A four-cylinder gasoline engine was employed in the performance test because this is the most common type of engine on the Chinese automobile market. The main instruments and environmental conditions used in the engine performance test are shown in Table 2.
Table 2. Test instruments and conditions
|
Name |
Specifications Model |
|
Engine performance tester |
ET2000 |
|
AC power dynamometer |
110 KW |
|
Gasoline engine |
JL465QE-Y |
|
Transient fuel tester |
ET4500 |
|
Dry air temperature |
23 ℃~27 ℃ |
|
Relative humidity |
75 % |
|
Atmospheric pressure |
96 kPa |
5.2 Results analysis
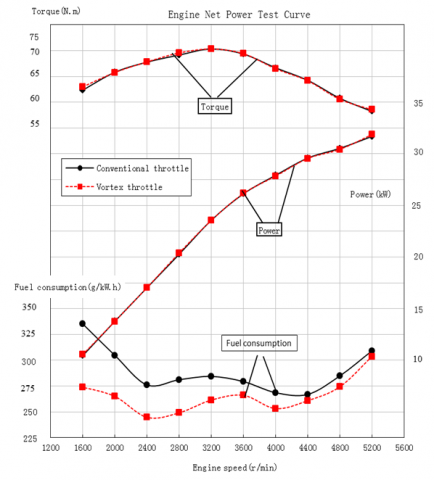
Figure 8. Performance test result
Engine net power test is generally used to examine changes in engine performance [20, 21]. Under the same operating conditions, the engine was mounted with a traditional throttle and a vortex throttle respectively, thereby to test engine performance. Performance test results were analyzed to understand the effects of the different throttles on engine performance. Engine performance test results are shown in Figure 8.
During the engine performance test, considering this engine in the actual running speed, comparative tests were conducted of the engine speed from 1600 to 5200 r / min. As can be seen from the results of the tests with two throttles, the engine output power and torque did not change significantly, but the engine economy was improved when fitted with the vortex throttle. That is, compared with the engine with the conventional throttle engine, the economy of the engine with the vortex throttle was improved.
In fact, the engine also performed very well on emissions when using the vortex throttle. It performed better in emissions than the engine with the conventional throttle, which fully meets the requirements of China’s national standards.
Engine performance is directly affected by intake air, which can be changed by the shape of the throttle. In this paper, the conventional throttle and the vortex throttle’s flow field were simulated with the throttles open at various degrees. The results showed that the vast majority of the vortex throttle opening angles have a reduced low-speed region, which is due to the three vortex throttle valves opening and organizing the movement of air. Compared with the conventional throttle, the air eddy swirling motion formed in the throttle valve increases the air intake, especially for medium and smaller degrees of throttle opening. By changing the design of the throttle valve, a certain vortex motion is created, and the strength of the intake was increased.
In the case of simulation, engine performance tests were also carried out. The results showed that the engine fitted with the vortex throttle performed better than the engine with the traditional throttle. Under the same conditions as the case of the engine control, vortex throttle engine’s fuel consumption has been reduced, and engine torque and power were not decreased. In other words, even while demonstrating fuel savings, the engine power has not declined. Therefore, the economy of the engine was enhanced.
This work was supported by (1) The National Natural Science Foundation of China (51106130); (2) The Chunhui Plan of the Ministry of Education of China (Z2014058); (3) The industry cluster project for electronic engine control systems and after treatment systems of Chengdu, China ([2013]265); (4) New energy vehicle electronic control technology in Sichuan province Youth Science and Technology Innovation Research Team (2015TD0021).
[1] Liu, N., Zheng, Z. and Li, G., “Analysis of diesel engine main bearing lubrication under single-cylinder misfiring situation,” Int J Heat & Tech, vol. 33, no. 4, pp. 85-90, 2015. DOI: 10.18280/ijht.330411.
[2] Verhelst S., Maesschalck P., Rombaut N. and Sierens R., “Efficiency comparison between hydrogen and gasoline, on a Bi-fuel hydrogen/gasoline engine,” Int J Hydrogen Energy, vol. 34, no. 5, pp. 2504-2510, 2009. DOI: 10.1016/j.ijhydene.2009.01.009.
[3] Sarma, P. K., Krishna, D. Radha and Ramanarayanan, C. P., “Analysis of engine oil cooler of an unmanned aeroengine at various altitudes,” Int J Heat & Tech, vol. 30, no. 1, pp. 45-50, 2012.
[4] Aono, Toshihiro and Kowatari, Takehiko, “Throttle-control algorithm for improving engine response based on air-intake model and throttle-response model,” IEEE Trans Ind Electron, vol. 50, no. 3, pp. 915-921, 2006. DOI: 10.1109/TIE.2006.874263.
[5] Ha, J. Y., Park, J. S. and Kang, J. H., “Effects of the throttle opening ratio and the injection timing of CNG on the combustion characteristics of a DI engine,” Int. J. Automot. Technol., vol. 11, no. 1, pp. 11-17, 2010. DOI: 10.1007/s12239-010-0002-8.
[6] Li Shunli, Li Yuxing, Zhao Qing and Pan Hongyu, “Throttle characteristics of pure CO2,” Natur. Gas Ind., vol. 35, no. 8, pp. 93-98, 2015. DOI: 10.3787/j.issn.1000-0976.2015.08.014.
[7] Wang, Juanping, “Throttle valve parts’ process planning,” Appl. Mech. Mater., vol. 159, pp. 395-399, 2012. DOI: 10.4028/www.scientific.net/AMM.159.395.
[8] Yarunichev, V. A., Orlova, E. E., Lemekhov, Yu. V and Shpanskii, V. A., “Numerical simulation of turbulent flow in the throttle of the MBIR reactors low-pressure chamber,” Therm Eng, vol. 62, no. 8, pp. 560-563, 2015. DOI: 10.1134/S0040601515080108.
[9] Park, K., Lee, J., Park, J., “Torque control of a vehicle with electronic throttle control using an input shaping method,” Int. J. Automot. Technol., vol. 14, no. 2, pp. 189-194, 2013. DOI: 10.1007/s12239-013-0021-3.
[10] Pluta, Janusz and Sibielak, Marek, “Testing of throttle valve prototype controlled by Piezoelectric Stack,” Solid State Phenomena, vol. 177, pp. 47-64, 2011. DOI: 10.4028/www.scientific.net/SSP.177.47.
[11] Zhou, Changcheng, Meng, Jie and Cai, Yanhui (2009, October). Optimum design of throttle-valves parameters for shock absorber based on velocity characteristic. Presented at 2nd WCSE, vol. 1, pp. 312-316, 2009. DOI: 10.1109/WCSE.2009.677.
[12] Suresh Kumar, J., Ganesan, V., Mallikarjuna, J.M., Govindarajan, S., “Design and optimization of a throttle body assembly by CFD analysis,” Indian J. Eng. Mater. Sci., vol. 20, no. 5, pp. 350-360, 2013.
[13] Rafiee, Seyed Ehsan and Sadeghiazad, M. M., “Three-dimensional and experimental investigation on the effect of cone length of throttle valve on thermal performance of a vortex tube using k-Ε turbulence model,” Appl Therm Eng, vol. 66, no. 1-2, pp. 65-74, 2014. DOI: 10.1016/j.applthermaleng.2014.01.073.
[14] Szpica, D., “Simplified numerical simulation as the base for throttle flow characteristics designation,” Mechanika, vol. 21, no. 2, pp. 129-133, 2015. DOI: 10.5755/j01.mech.21.2.8850.
[15] Altimira, Mireia and Fuchs, Laszlo, “Numerical investigation of throttle flow under cavitating conditions,” Int. J. Multiph. Flow, vol. 75, pp. 124-136, 2015. DOI: 10.1016/j.ijmultiphaseflow.2015.05.006.
[16] Xia, Xiao-Lang, Liu, Jing-Ping, Tang, Qi-Jun, Zhu, Guo-Hui and Feng, Kang, “Fuel saving potential of gasoline engine without throttle based on testing data,” Zhongnan Daxue Xuebao (Ziran Kexue Ban), vol. 43, no. 12, pp. 4707-4712, 2012.
[17] Zhang Jing, Qi Xueyi, Hou Yihua and Wang Jiansen, “Numerical Simulation of 3-D Turbulent Flow Fields through Double-channel Passage Impeller,” Transactions of the Chinese Society of Agricultural Machinery, vol. 40, no. 1, pp. 64-68, 55, 2009.
[18] Paulwitz, Michael “At full throttle into development: Automated engineering as a competitive advantage,” Mechatronik, vol. 121, no. 12, pp. 48-49, 2013.
[19] Heinzen, Adam, Gillella, Pradeep and Sun, Zongxuan, “Iterative learning control of a fully flexible valve actuation system for non-throttled engine load control,” Control Eng. Pract., vol. 19, no. 12, pp. 1490-1505, 2011. DOI: 10.1016/j.conengprac.2011.08.008.
[20] Ma, Xiao, Zhang, Fan, Xu, Hongming and Shuai, Shijin, “Throttleless and EGR-controlled stoichiometric combustion in a diesel-gasoline dual-fuel compression ignition engine,” Fuel, vol. 115, pp. 765-777, 2014. DOI: 10.1016/j.fuel.2013.07.052.
[21] Arapatsakos, Charalampos, Karkanis, Anastasios and Anastasiadou, Christina. “The load and the gas emissions measurement of outboard engine,” Int J Heat & Tech, vol. 33, no. 4, pp. 221-228, 2015. DOI: 10.18280/ijht.330430.