OPEN ACCESS
An experimental and numerical investigation of natural convection in a square cavity with two vertical baffles located on the bottom wall of the cavity was carried out in this paper. The cavity had top and bottom plexiglass walls and isothermal aluminum walls. Particle Image Velocimetry was the study’s experimental method and Fluent 12.1.4 was the numerical software employed. Two dimensionless baffle heights, Hb=0.2 and Hb=0.4 were examined for Rayleigh numbers ranging from 104 to 105. The velocity maps and streamlines produced both experimentally and numerically were studied and analyzed. As the Rayleigh number increases, the velocity of the fluid inside the cavity increases. The streamlines show that for Hb=0.2 as the Rayleigh number increases, two vortexes form in the upper part of the cavity, while for Hb=0.4 the second vortex forms in the gap between the two baffles. The increase in dimensionless baffle height from 0.2 to 0.4 causes a substantial reduction in Nusselt number.
Particle Image Velocimetry, Natural convection, Vertical obstacles, Square cavity, Fluid flow.
Natural convective heat transfer has numerous industrial and engineering applications such as in solar energy systems, room ventilation or air conditioning and in the cooling of electronic circuits. Natural convective heat transfer is so widely employed because it is cheap and does not rely on the implementation of other equipment. Various numerical studies of square cavities with the application of obstacles, baffles or dividers can be found in literature, while a limited number of these discuss experimental results or data obtained using Particle Image Velocimetry (PIV). Particle image Velocimetry has been employed in the study of natural convective heat transfer in cavities [1]. The experimental data acquired using this method, such as velocity maps and streamlines, are used to characterize the phenomenon. The presence of baffles inside a cavity has a significant effect on heat transfer and fluid flow dynamics of the enclosure. The heat transfer rate in an enclosure can be controlled by the use of partial dividers such as baffles. The length, location, conductivity and thickness of the baffles affect both heat transfer and fluid flow inside the cavity. The objective of this study is to analyze the effects two baffles located on the bottom of a square cavity have on the heat transfer and fluid flow characteristics of the enclosure itself.
Jetli and Acharya [2] numerically studied the effect of inserting two offset vertical baffles in a square cavity in order to investigate the influence of the baffles’ position and conductivity on convective heat transfer. The results of this
study showed that the increase in baffle height caused a significant reduction in flow strength and heat transfer. Bilgen [3] numerically analyzed the effect of a thin fin of different dimensionless lengths attached to the horizontal wall, in different positions. This study found that Nusselt number increases with Rayleigh number and decreases with fin length. Ambarita et al. [4] numerically examined the effect of 2 vertical baffles, one positioned at the top and the other at the bottom of a square cavity on heat transfer and fluid flow. The presence of the two baffles modifies the flow and temperature fields when compared to the corresponding cavity without baffles. Additionally, different baffle lengths give rise to different flow patterns. Ghassemi et al. [5] numerically studied the effect of 2 horizontal baffles of different lengths in a cavity, finding that the flow field pattern is Rayleigh number and baffle position dependant. Abdul Hakeem et al [6] numerically studied both horizontal and vertical baffles placed in various positions in a square enclosure. Costa [7] numerically investigated a cavity where two vertical baffles are placed one on the top and the other on the bottom walls, analyzing the effects of the baffles on heat transfer.
An experimental and numerical examination of a square cavity with two vertical baffles was carried out in this paper. Two plexiglass baffles of dimensionless height, Hb were placed at the bottom of the square cavity of height h=0.05m at a distance d=1/4h from the side walls. Two cases were studied: for dimensionless height, Hb=0.2 two baffles of height hb1=0.01m were placed inside the square cavity. While for dimensionless height, Hb=0.4 two baffles of height hb2=0.02m were placed inside the square cavity. The influence of the baffles’ height on natural convective heat transfer was analyzed using 2D Particle Image Velocimetry through velocity vectors, stream lines and velocity fields. The analysis was carried out both experimentally and numerically for Rayleigh numbers between 104 and 105. The velocity of the fluid increases with Rayleigh number. Convective heat transfer increases with Rayleigh number but decreases with baffle height.
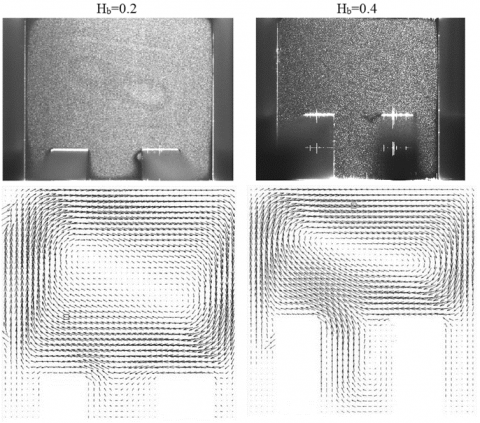
The cavity designs for Hb=0.2 and Hb=0.4 are shown in Figure 1. The baffles’ dimensionless height is calculated as follows:
$H_{b}=\frac{h_{b}}{h}$ (1)
The test cell is a square cavity of height h=0.05m with top and bottom plexiglass walls. The lateral aluminum walls of height, h are kept at constant temperatures Th and Tc during the experiments (hot and cold sources) by their respective thermostatic bath. Each baffle is positioned vertically on the bottom wall of the cavity at a dimensionless distance Db=0.16 from each of the lateral walls (the baffles are centered at a distance D=1/4h from the lateral walls of the cavity). For Hb=0.2 the baffles of height hb1=0.01m, length lb=0.009m and depth l=0.41m (depth of the cavity) are employed while for Hb=0.4 the baffles of height hb2=0.01m, length lb=0.009m and depth l=0.41m are used.
Figure 1. Hb=0.2 cavity on the left, Hb=0.4 cavity on the right
The problem is assumed to be two-dimensional. The cavity’s depth, l is much greater than the cavity’s height and width, h ensuring that the air-motion along the z-direction (perpendicular to the laser beam) is negligible, and thus the end effects may be ignored.
2.1 Experimental Set-up
The components of the experimental set-up include the aforementioned test cell, 2D-PIV system, two thermostatic baths and a data acquisition system.
The hot and could sources of the cavity were kept at constant temperatures during the duration of each individual experiment using Lauda’s PROLINE RP1840 thermostatic baths. The pipes connecting the hot and cold sources to their respective thermostatic bath were covered with a neoprene skin insolating them and preventing heat loss. Water was the thermostatic fluid that circulated from the thermostatic baths trough the pipes heating and maintaining the hot and cold sources at constant temperatures during the duration of the individual trials.
The cavity’s glass front vertical wall allowed optical access for the CCD camera, while the back vertical wall is a square piece of wood. The top and bottom walls were made of plexiglass to reduce the amount of heat loss. The top plexiglass wall had a small opening near the back end for seeding injection.
The temperatures of the hot and cold sources were measured with 10 copper-constantan thermocouples: five of them were evenly distributed on each source. The temperatures of the 10 thermocouples were measured in 30s intervals using an acquisition system constituted by a computer and Hp Aglient 34970A data acquisition/switch unit. The thermocouples were connected to a Kaye K170 ice point reference.
The PIV system was designed to make instantaneous velocity measurements of the cross-sectional flow. The velocity fields were calculated by determining the distance covered by the seeding particles suspended in the air. The particle displacement captured in the images between light pulses was determined though an evaluation of the PIV recordings.
The images were captured using a 12 bit Hi Sense MkII Hamamatsu C8484-05C 1344 × 1024 pixel CCD camera. The camera was equipped with a 60 mm Nikon lens covered by a 532 nm wavelength filter so that only direct or scattered light from the laser was recorded. A double cavity SoloII-15 Nd-YAG laser with 532 nm wavelength was the light source used. The PIV data analysis was carried out using Dantec Dynamics “Dynamic Studio”.
The experimental tests were performed in a climate-controlled laboratory with a room temperature of 295 K. The experimental methodology consisted in turning on the thermal baths that were set to the desired temperatures for the test. After the target temperatures were reached, the valves were opened allowing the fluid to circulate in the hot and cold sources. The temperature acquisition system was also turned on to monitor the temperatures of both sources. After the hot and cold sources reached the desired isothermal states, seeding was introduced in the cavity. Once the seeding was uniformly distributed, images were acquired using the CCD camera and analyzed using Dynamic Studio software. For more detailed information on the methodology applied see Corvaro and Paroncini[8].
Figure 2. Images of the cavity with a corresponding vector analysis map using Dynamic Studio software
2.2 Numerical Set-up
In this study the numerical simulations were completed using the finite volume code Fluent 12.1.4. The simulations were implemented in 2D space using the pressure based solver with implicit formulation. The simulations were executed for 104< Ra <105. The second order upwind implicit scheme was employed for the resolution of the conservation equations and for spatial discretization. The Body Force Weighted scheme was used for pressure interpolation and the SIMPLE algorithm for pressure velocity coupling. The two dimensional model was applied in laminar flow conditions and the diffusion terms were central-differenced with second order accuracy.
The geometry of the cavity was duplicated with real dimensions. The temperatures of the hot and cold sources were assigned so as to obtain the same Rayleigh numbers as in the experimental analysis. The top and bottom walls of the cavity were modeled so as to have conductive heat flux through the plexiglass, accounting for the non-perfect adiabatic nature of the material itself.
The numerical simulation calculates the average Nusselt number on the heat source using the formula:
$\overline{N u}=\frac{q_{t o t} / A_{h}}{k \cdot \Delta T / h}$ (2)
where qtot is the heat transfer rate, Ah is the hot source’s surface area and k is the thermal conductivity of air. The local Nusselt numbers (Nuh) were also calculated at the hot source:
$N u_{h}=\frac{q^{\prime \prime}}{k \cdot \Delta T / h}$ (3)
where q” is the heat flux computed on each mesh cell.
In order to obtain a more precise comparison of the numerical and experimental results, Tecplot 7.5 post processor software was used for data visualization. Dynamic studio and Fluent have their own data visualization components, and thus display the same data in slightly different ways. The data from each test and simulation was imported to Tecplot and elaborated in the same fashion so that the exported velocity map, for example, displayed analogous colorings and number of levels, facilitating the comparison of the experimental and numerical results of each test.
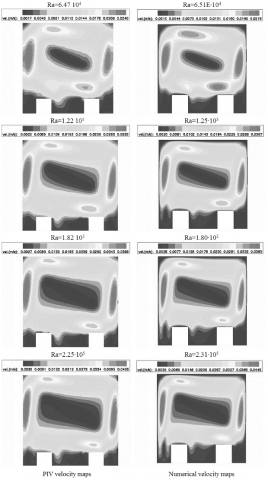
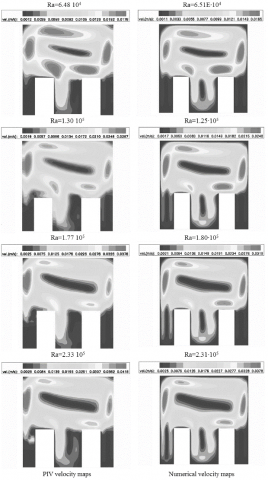
In the figures below (Figures 3 and 4) the PIV experimental results alongside the Fluent numerical simulation results for analogous Rayleigh numbers are shown. In comparing the experimental and numerical simulation velocity maps we can observe that for given Ra numbers, there is good agreement between the two. We can see that the velocity increases with Rayleigh number.
If we examine the velocity maps obtained from the PIV experiments, we notice that there are some discrepancies with the numerical simulations near the sides and bottom of the cavity, especially around the baffles. These effects, particularly visible in Figure 4, are due to the reflection of the laser light on the cavity walls and baffles. In addition, slight imperfections in the baffles themselves or not perfect alignment of the baffles in the cavity caused a shadow area next to them, especially evident in the bottom left corner. Care was taken to minimize these effects: the internal cavity was spray painted matte black except for the top wall which was left transparent to allow laser light to illuminate it, but their complete elimination was impossible.
Figure 3. PIV and Fluent velocity maps for Hb=0.2
For both Hb=0.2 and Hb=0.4, the velocity of the fluid flow increases with Rayleigh number. As seen in Figure 3, the bottom part of the cavity is characterized by slow-moving fluid as is the central portion. If we compare the velocity maps for Ra=6.51∙104 and 2.31∙105, we notice that fluid with higher and higher velocities is entering the central gap between the two baffles.
Analogous observations can be made for Hb=0.4 as seen in Figure 4. The cavity is essentially divided in two: the upper area is characterized by fast-moving flow and the bottom area is characterized by slower-moving air. In this case the gap between the cold wall and baffle closest to it, located on the right side of the cavity is still filled with slow-moving flow, but for Ra=2.31∙105 we can see that slightly faster-moving air is seeping in.
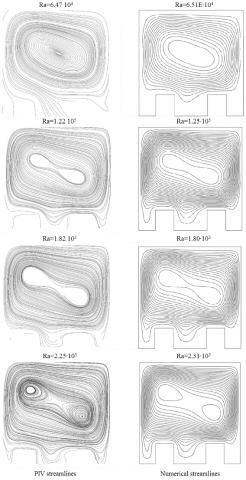
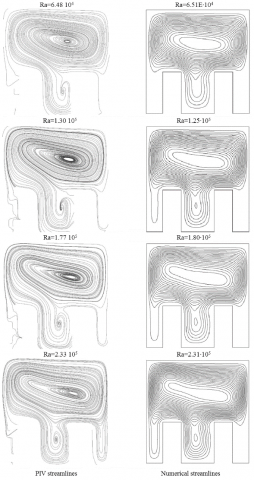
In Figures 5 and 6 we can see the experimental and numerical streamlines for Hb=0.2 and Hb=0.4 respectively. We can observe a good agreement between the numerical and experimental results. Observing the streamlines in Figure 5, for Ra=6.51∙104 these are characterized by moncellular motion inside the cavity, while for Ra=2.31∙105 the streamlines are characterized by the formation of two distinct non-symmetrical vortexes.
In Figure 6 we notice that the upper portion of the cavity is characterized by monocellular motion. In the gap between the two baffles a second vortex is beginning to form for Ra= 6.51∙104. This vortex is fully formed at Ra=1.80∙105.
Figure 4. PIV and Fluent velocity maps for Hb=0.4
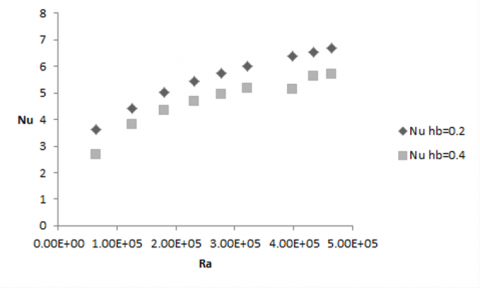
The experimental results validate the numerical results obtained by Fluent. The average Nusselt numbers at the hot source for different Rayleigh numbers is shown in Figure 7. The Nusselt number increases with Rayleigh number in both cases, while it decreases with dimensionless baffle height, Hb. There is a decrease in convective heat transfer as the baffle height increases. In particular, the maximum decrease in heat transfer occurs for Ra=6.51∙104 where there is a 26.65% decrease in Nusselt number when the dimensionless baffle length goes from 0.2 to 0.4, while for the other Rayleigh numbers examined there is an approximate decrease of 14%, with the exception of Ra=3.98∙105 where there is a decrease of 19.87%, as can be seen in Table 1.
Table 1. Numerical Nu numbers for Hb=0.2 and Hb=0.4
|
Ra |
Nu Hb=0.2 |
Nu Hb=0.4 |
∆% |
|
6.51∙104 |
3.64 |
2.67 |
-26.65 |
|
1.25∙105 |
4.4 |
3.8 |
-13.64 |
|
1.80∙105 |
5.03 |
4.34 |
-13.72 |
|
2.31∙105 |
5.45 |
4.69 |
-13.94 |
|
2.78∙105 |
5.76 |
4.96 |
-13.89 |
|
3.22∙105 |
6.01 |
5.17 |
-13.98 |
|
3.98∙105 |
6.39 |
5.12 |
-19.87 |
|
4.33∙105 |
6.54 |
5.61 |
-14.22 |
Figure 5. PIV and Fluent streamlines for Hb=0.2
A relation between the Rayleigh and Nusselt numbers for both configurations were derived:
$N u=a \cdot R a^{b}$ (4)
The respective coefficients and their values along with the R2 can be found in Table 2. R2 indicates how well the correlated function fits the numerical data points, and is defined as follows:
$R^{2}=1-\frac{S S E}{S S T}$ (5)
where:
$S S E=\sum_{j=1}^{n}\left(k_{j}-h_{j}\right)$ (6)
$S S T=\left(\sum_{j=1}^{n} k_{j}^{2}\right)+\frac{1}{n}\left(\sum_{j=1}^{n} k_{j}\right)^{2}$ (7)
kj are the n numerical data values and hj are the corresponding calculated values of the relation.
Table 2. Numerical correlation parameters
|
|
a |
b |
R2 |
|
Hb=0.2 |
0.1147 |
0.3119 |
0.9987 |
|
Hb=0.4 |
0.0528 |
0.3604 |
0.9618 |
Figure 6. PIV and Fluent streamlines for Hb=0.4
Figure 7. Numerical Nu numbers for Hb=0.2 and Hb=0.4
In this paper a study of natural convection in a square cavity with two baffles located on the bottom wall of the cavity is carried out for two different baffle heights, both experimentally using Particle Image Velocimetry and numerically using Fluent software. There is good agreement between the experimental and numerical data obtained. The velocity maps for both Hb=0.2 and Hb=0.4 show that the top, “baffle-free” area of the cavity is characterized by faster moving fluid near the cavity walls and slower-moving fluid in the center of the cavity. While in the lower area of the cavity the presence of the baffles causes the fluid to move very slowly. The velocity of the flow increases with Rayleigh number. For Hb=0.2 the streamlines show that as the Rayleigh number increases, the monocellular motion of the fluid changes with the development of two non-symmetrical vortexes. The streamlines in Hb=0.4 show that the top portion of the cavity is characterized by moncellular motion in the range of Rayleigh numbers investigated, but a second vortex begins to form between the baffles as the Rayleigh number increases. Examining the Nusselt numbers, it is clear that as the dimensionless height of the baffles increases, there is a reduction of convective heat transfer in the order of 14% except for Ra=6.51∙104 where the maximum decrease of 26.65% was obtained and for Ra=3.98∙105 where a decrease of 19.87% was registered.
|
d |
= |
position of the baffles with respect to the cavity’s lateral walls [m] |
|
Db |
= |
dimensionless position of the baffles with respect to the cavity’s lateral walls |
|
g |
= |
modulus of the gravity vector (g = 9.81 m s-2) |
|
h |
= |
cavity side height [m] |
|
hb1, hb2 |
= |
baffle height [m] |
|
Hb |
= |
dimensionless baffle height |
|
k |
= |
thermal conductivity [W m-1K-1] |
|
l |
= |
cavity depth of the experimental test section [m] |
|
lb |
= |
baffle length [m] |
|
Nuh |
= |
local Nusselt number |
|
Pr |
= |
Prantdl number |
|
Ra |
= |
Rayleigh number |
|
∆t |
= |
time between two laser pulses [μs] |
|
T |
= |
temperature [K] |
|
∆T |
= |
(Th -Tc) temperature difference between hot and cold plates [K] |
|
x,y |
= |
Cartesian coordinates |
|
Greek symbols |
||
|
β |
= |
thermal expansion coefficient [K-1] |
|
ν |
= |
kinematic viscosity [m2 s-1] |
|
ρ |
= |
density [kg m-3] |
|
Subscripts |
||
|
c |
= |
cold wall |
|
h |
= |
hot wall |
1. F. Corvaro and M. Paroncini, Experimental analysis of natural convection in square cavities heated from below with 2D-PIV and holographic interferometry techniques, Exp. Therm. and Fluid Sci., vol. 31, pp.721-739, 2007.
2. R. Jetli and S. Acharya, Buoyancy-induced heat transfer in a vertical enclosure with offset partial vertical dividers, Appl. Math. Modelling, vol. 12, pp. 411-422, 1988.
3. E. Bilgen, Natural convection in cavities with a thin fin on the hot wall, Int. J. of Heat and Mass Transf., vol. 48, pp. 3493-3505, 2005.
4. H. Ambarita, K. Kishinami, M. Daimaruya, T. Saitoh, H. Takahashi And J. Suzuki, Laminar natural convection heat transfer in an air filled square cavity with two isolated baffles attached to its horizontal walls, Therm. Sci. & Eng., vol. 14, no. 3, pp. 35-46, 2006.
5. M. Ghassemi, M. Pirmohammadi and GH. A. Sheikhzadeh, A numerical study of natural convection in a cavity with two baffles attached to its vertical walls, Proc. of the 5th IASME/WSEAS conference on Fluid Mechanics and Aerodynamics, Athens, Greece, 2007.
6. A. K. Abdul Hakeem, S. Saravanan and P. Kandaswamy, Buoyancy convection in a square cavity with mutually orthogonal heat generating baffles, Int. J. of Heat and Fluid Flow, pp. 1164-1173, 2008.
7. V. A. F. Costa, Natural convection in partially divided square enclosures: Effects of thermal boundary conditions and thermal conductivity of the partitions, Int. J. of Heat and Mass Transf., vol. 55, pp. 7812-7822, 2012.
8. F. Corvaro and M. Paroncini, An experimental study of natural convection in a differentially heated cavity through a 2D-PIV system, Int. J. of Heat and Mass Transf., vol. 52, pp. 355-365, 2009.
9. M. Raffel, C. Willert and J. Konipenhans, Particle Image Velocimetry, Springer, Heidelberg, Berlin, 1998. 55
10. Dynamic Studio software and Introduction to PIV Instrumentation, Dantec Dynamics GmbH, 2000.
11. Fluent User’s Guide, Release 12.0, ANSYS, Inc., 2009.
12. Tecplot User’s Manual, Version 7.5, Amtec Engineering, Inc., 1998.