Mariam Hamad Abd![]() | Yasir Al-Ani*
| Yasir Al-Ani*![]() | Mohammed Falah Allawi
| Mohammed Falah Allawi![]()
© 2025 The authors. This article is published by IIETA and is licensed under the CC BY 4.0 license (http://creativecommons.org/licenses/by/4.0/).
OPEN ACCESS
Groundwater quality monitoring and prediction for irrigation purposes is of utmost importance for water resources management. Data were collected for groundwater quality parameters from a number of wells in Anbar Governorate, western Iraq, to estimate and predict the groundwater quality index for irrigation purposes (IWQI) using three AI models: (ANN), (SVM), and (DL). The inputs represent ten water quality parameters, including: (EC), (TDS), (SAR), (K+), (Mg2+), (Ca2+), (Cl-), (HCO3-), and (SO42-). AI models were applied after dividing the data into 70% for training and 30% for testing. The performance of the models was evaluated by determining statistical indicators between the actual and expected values of IWQI. The correctness was demonstrated by the outcomes of AI models and their high performance in both the training and testing phases. In addition, the statistical indicators of the SVM model showed that it was the best model that gave appropriate performance with (R2 = 0.99, RMSE = 31.8). We conclude that AI models can be relied upon for integrated and sustainable water management.
artificial neural network, DL, groundwater, support vector machine
Among the main sources of water for industry, drinking, and agriculture is groundwater, especially in dry and semi-arid areas without surface water supplies [1]. Groundwater consists of mineral ions that dissolve slowly as water descends into the aquifer. These are called total dissolved solids, which arise from river water or rain that recharge and store groundwater [2]. Previous experiments and studies have indicated that high concentrations of various dissolved metal ions, exceeding their safe standards, have negative effects on human health and the growth of crops [3]. To overcome the negative effects that weaken agricultural production and affect human health, it is essential to continuously assess and monitor water quality to ensure sustainable and integrated management and planning of groundwater resources. Therefore, this study relied on AI models to calculate and forecast IWQI purposes instead of traditional methods that rely on actual data taken from relatively large samples and need laboratory testing. It is costly, labor-intensive, and time-consuming. In addition, they only deal with linear data [4]. Artificial intelligence models can handle large amounts of linear and non-linear (complex) data and provide accurate results and good performance when making predictions without wasting time, effort, and cost [5].
Over two-thirds of fresh water is used to irrigate crops, making agriculture the largest user of water [6]. It is necessary to monitor IWQI purposes to achieve sustainable development of water resources, especially in areas where crops are widely grown [7].
There are several ways to assess how water affects soil and crops. Several indicators, including the SAR, Kelly index, magnesium absorption ratio, EC, TDS, and SR, have been used by researchers to assess the WQ rather than relying on just one [8, 9].
The WQI is seen to be a superior method for evaluating water quality as it reduces water quality to a single number using a collection of factors and indicators [10].
In recent years, artificial intelligence models, most notably ANN, have found widespread use in various engineering applications [11, 12], WQ analyses [13, 14], and WQI estimation and prediction [15]. Artificial intelligence models are employed in qualitative variable estimation and optimization. Since these models are data-driven, they may solve complicated and non-linear issues by determining the underlying correlations between input and output parameters, which results in a high degree of generalization capacity [16].
The assessment and prediction of the WQI have been the subject of several studies employing ANN, SVM, and DL models. The Bulletin explored recent developments in water quality modeling using AI [17].
Gad et al. [18] relied on the WQI as an output parameter for assessing the groundwater quality of the Nubian sandstone aquifer in El Kharga Oasis using artificial neural networks. To measure the physical and chemical properties as input variables.
(Vasant and Kumar) used ANN model to estimate WQI of Palayar River in Tamil Nadu and found that river water is appropriate for irrigation but not for drinking [19].
Abu El-Magd et al. [20] used the SVM model to evaluate the quality of groundwater in Egypt based on the WQI. The results indicated that groundwater is affected by the interactions of water with rocks and the effect of dissolution and filtration processes on water.
Baek et al. [21] used a deep learning LSTM model to simulate the WQ of the Nakdong River Basin, combined with a CNN model to simulate the water level. The study demonstrated that the models employed in the investigation are very useful for simulating water quality and level with high accuracy, in addition to the high accuracy in performance and prediction during the training and testing process.
Mokhtar et al. [22] applied three Al models (SVM, RF, XGB) to estimate and predict six water quality parameters of the Egyptian seabed for irrigation purposes (SAR, RSC, PS, PI, KR, SSP) based on four water variables (EC, Na+, Ca2+, HCO3-) as inputs to the models. The results revealed that the water needs to be treated because it is not suitable for irrigation due to its high salt content, so only plants that can tolerate high salinity can be grown. The results also revealed the superiority of the SVM model because it gave high values for R2 and low values for RMSE for all irrigation water quality parameters during the training and testing phases.
Tasan collected different groundwater samples from Mersin province within the Bozyazi district in the south of the Central Mediterranean region to evaluate the water quality for irrigation purposes based on irrigation water parameters (SAR, RSC, KI, %Na, MR, PS, PI) and predicted these parameters using (ANN and ANFIS) models. The statistical criteria results indicated the superiority of ANN model because it gave the highest value of R2 and the lowest value of RMSE for all water quality parameters during the training and testing phase. In addition, the results revealed that irrigation water quality parameters were within the permissible standards except for (MR) indicator which gave values higher than the permissible standards [23].
Gaagai et al. [24] relied on six criteria to evaluate the quality of irrigation water for groundwater in the Algerian desert, namely (IWQI, SAR, KI, MH). The results indicated that 67% of the groundwater was of the moderately restricted irrigation type and 33% of the severely restricted irrigation type. Therefore, when planting crops with high salt sensitivity, the soil should be kept soft and the soil layers should not be compacted. In addition, two AI models (ANN, GBR) were developed to predict the IWQI. The results of the statistical indicators indicated the superiority of the ANN model with (R2 = 0.958) and the lowest value of (RMSE = 2.175) during the testing phase.
Derdour et al. [25] took five groundwater parameters (EC, SAR, HCO3-, Na+, Cl-) as inputs to estimate and predict IWQI and determine the suitability of groundwater for irrigation purposes in the Adrar region located in the Algerian desert using two models (SVM, KNN). The IWQI results indicated that 57.23% of the water was unsuitable for irrigation, 33.23% of the water was good for irrigation, and 9.64% of the water was considered restricted irrigation. In addition, the SVM model was considered ideal for predicting IWQI in this study, as it gave an accuracy of 94.2% for the training set and 100% for the test set.
Rising temperatures, climate change, and reduced rainfall lead to increased groundwater salinity, which in turn affects agricultural production. Therefore, it is necessary to continuously monitor groundwater quality to ensure integrated water management and increase agricultural production. The purpose of this study is to estimate and predict the IWQI of several wells in Anbar Governorate based on ten water quality parameters using the weighted method to determine if groundwater is suitable for irrigation and predict the IWQI using three models: (ANN, SVM, and DL). Then, four statistical indicators are used to assess each model's performance: (R2), (MSE), (RMSE), and (MAE). The results will be beneficial as biased models for monitoring water quality and forecasting its indicators, allowing for better management of water resources and making informed decisions about available resources, particularly in areas that are dry and semi-arid.
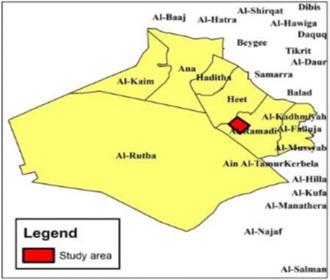
Data was collected for many wells located in Anbar Governorate. When collecting field data, the location and depth of the wells and the extent of their use were taken into consideration. In addition, the data used in this study were measured over different time periods to take into account changes in temperature, rainfall, humidity and other seasonal variations that affect groundwater quality in Anbar Governorate. It is between longitudes 40°28'12''E and 41°25'48''E and latitudes 34°24'54'' and 34°11'6'' in the western portion of Iraq and inside the western plateau from the north as shown in Figure 1, as it constitutes about 55% of the area of Iraq, which is 137,808 km2, and which is considered the largest governorate in Iraq [26]. Although there are water resources in the Anbar Governorate, their distribution is not uniform, which has led to the accessibility of water in certain parts of the region and water scarcity in other parts. Large agricultural areas are also found there, but the majority of these areas experience water shortages as a result of water being directed to a small number of agricultural areas and traditional irrigation techniques which consume a lot of water. As a result, the Western Desert now relies on groundwater for irrigation and drinking. It is projected that 2.4 billion cubic meters of groundwater are used for agricultural irrigation and other purposes, and that 2.5 billion cubic meters of groundwater, both renewable and non-renewable, are present in the Western Desert of Anbar Governorate [27]. The research region's winter climate is categorized as dry with rainfall, and in summer it is classified as very dry and hot with changes in temperature during the day [28].
Figure 1. Map showing the area of wells from which the study data was collected
The IWQI was determined using the weighted technique as it is a good and efficient approach, and through it, the IWQI can be computed using several WQ parameters (EC, TDS, SAR, Na+, Mg2+, Ca2+, K+, Cl-, HCO3-, SO42-) [29-31]. Using this method, the IWQI can compensate for the rest of the water indicators, and through it, we determine the water quality suitable for irrigation purposes [32].
Ten water quality parameters were selected to determine the suitability of groundwater for irrigation purposes and its impact on human health and the environment. The (EC, TDS) variables determine the amount of salts and impurities in the water, SAR determines the amount of sodium and its impact on the health of the soil and crops, the (Ca2+, Mg2+) parameters determine the hardness of the water, bicarbonates (HCO3-) determine the acidity level of the water, and the variables (Na+, K+, Cl-, SO42-) were selected for their impact on human and plant health.
Groundwater must be monitored continuously because high salinity negatively affects soil health and crop growth [33]. The WQI can replace other water parameters for irrigation purposes, as shown in Table 1, which represents the WQI standards according to the Food and Agriculture Organization to determine whether the WQ is good or poor. Eq. (1) was applied to estimate the WQI for irrigation purposes [34, 35].
$W A I W Q I=\frac{\sum Q_i W_i}{\sum W_i}$ (1)
Qi represents the quality rating scale and can be found according to Eq. (2):
$Q_i=100\left[\frac{V_i-V_0}{s_i-V_0}\right]$ (2)
where,
Vi represents the concentration of the measured water parameters.
Vo represents the ideal concentrations of water parameters, where all parameters have Vo equal to zero except DO = 14.6 mg/l and pH = 7.
Si represents the standard concentrations of water parameters as shown in Table 2 according to the standards of the Food and Agriculture Organization.
Wi represents the unit weight of each parameter and can be computed from Eq. (3):
$W_i=k / S_i$ (3)
k represents the constant of proportionality and can be computed from Eq. (4).
$k=\frac{1}{\Sigma \frac{1}{S_1}}$ (4)
Table 1. Irrigation water quality index criteria according to the Food and Agriculture Organization [24]
|
IWQI |
Rating of Water Quality |
|
100 – 85 |
Excellent Water Quality |
|
85 – 70 |
Very good Water Quality |
|
70 – 55 |
Good Water Quality |
|
55 – 40 |
Satisfactory Water Quality |
|
40 – 0 |
Unsuitable Water Quality |
Table 2. Water quality parameters standards according to the Food and Agriculture Organization [36]
|
Parameters |
Si (mg/l) |
|
EC |
3000 (s/cmμ) |
|
TDS |
2000 |
|
K+ |
2 |
|
Na+ |
919 |
|
Cl- |
1036 |
|
SO42- |
960 |
|
SAR |
9 |
|
Mg2+ |
60 |
|
Ca2+ |
400 |
|
HCO3- |
610 |
High sodium concentration affects soil health, increases its alkalinity, deteriorates its structure and texture, and thus affects plant growth [37]. The concentration of Na, Mg, and Ca ions may be used to calculate the SAR [38]. SAR is used to calculate the hazard limits of sodium in groundwater used for irrigation purposes [39]. Increased sodium levels and water pollution resulting from population growth affect crop growth and weaken their production [40]. In addition, SAR is considered one of the water quality standards used for irrigation purposes [41]. From Eq. (5), the sodium absorption rate (SAR) can be calculated [42]:
$S A R=\frac{N a^{+}}{\sqrt{\left(\mathrm{Mg}^{2+}+\mathrm{Ca}^{2+}\right) / 2}}$ (5)
Four statistical indicators were calculated between the actual and expected IWQI to assess the effectiveness of the used AI models and to calculate the best model for the study. These indicators include:
5.1 Determination coefficient (R2)
A criterion for calculating the percentage of variation in dependent parameters that can be explained when predicting using the prediction models adopted in the study [43]. It can be calculated according to Eq. (6) [44]:
$\begin{aligned} & R^2 =\left[\frac{\sum_{i=1}^n\left(I W Q I_{a c t u}-I W Q I_{a c t u}\right)\left(I W Q I_{p r e}-\overline{I W Q I_{p r e}}\right)}{\sum_{i=1}^n\left(I W Q I_{a c t u}-\overline{I W Q I_{a c t u}}\right)^2 \sum_{i=1}^n\left(I W Q I_{p r e}-\overline{I W Q I_{p r e}}\right)^2}\right]^2\end{aligned}$ (6)
5.2 Mean square error (MSE)
A standard for measuring the execution of models in a distinctive way [45], and it can be calculated through Eq. (7) [46]:
$M S E=\frac{\sum_{i=1}^n\left(I W Q I_{\text {actu }}-I W Q I_{\text {pre }}\right)^2}{n}$ (7)
5.3 Root mean square error (RMSE)
A criterion for measuring the performance of each model through which predictions are made [47], and it can be calculated using Eq. (8) [48]:
$R M S E=\sqrt{\frac{\sum_{i=1}^n\left(I W Q I_{a c t u}-I W Q I_{p r e}\right)^2}{n}}$ (8)
5.4 Mean absolute error (MAE)
A criterion that describes the percentage of error in the performance of each model used for prediction [49], and it can be calculated according to Eq. (9) [50]:
$M A E=\frac{\sum_{i=1}^n\left(\left|I W Q I_{a c t u}-I W Q I_{p r e}\right|\right)}{n}$ (9)
where,
$I W Q I_{\text {actu }} \& I W Q I \quad$ pre: value of the actual and predicted (IWQI), respectively.
$\overline{I W Q I_{\text {actu }}} \& \overline{I W Q I_{\text {pre }}}$: Mean values of actual and predicted (IWQI), respectively.
n = number of actual data.
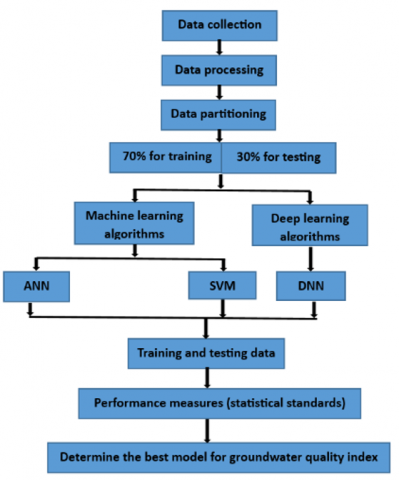
In this research, three AI models were applied to estimate the IWQI: (ANN), (SVM), and (DL). The optimal model was determined by calculating statistical indices between the measured IWQI values and the expected values. Figure 2 illustrates the basic steps followed in this study to calculate and forecast the IWQI using AI models.
ANN, SVM and DL models were used because they are suitable for the nature of the groundwater data used in this study. The performance of each model was evaluated using statistical indicators and it was found that these models provide high accuracy and good performance when estimating and predicting the groundwater quality index. In addition, the models used in this study can deal with complex data and have the ability to learn from the data set used and provide good and accurate predictions.
70% of the data was chosen for training and 30% of the data for testing, as this is the best split that gave reliable and accurate estimates of the IWQI. Also, having 70% of the data for training allows the model to be trained properly and appropriately, and the model to clearly identify patterns and relationships between variables. Having 30% of the data for testing allows for the performance of each model used to be known in the most accurate way.
Figure 2. Flowchart of the designed, constructed, and developed methodology
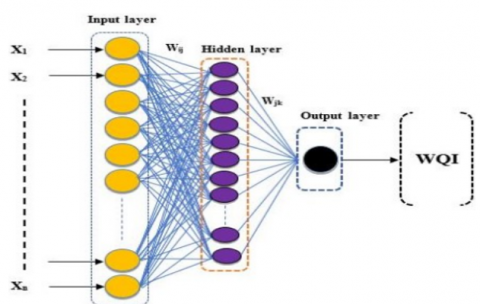
In this study, we relied on a feed-forward back-propagation ANN to estimate the groundwater IWQI for this purpose. The FFBP model is commonly used in estimation studies [51] and consists of three layers [52]: The input layer is represented by the first, and the concealed layer by the second (it might have a hidden layer or layers), and the third represents the output layer, as shown in Figure 3, which illustrates the construction of the ANN [53].
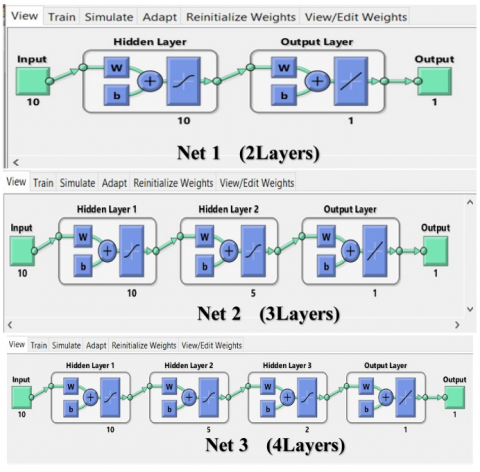
Three networks were chosen. The first network contains two layers, meaning that the number of hidden layers is only one [54]. The second network contains three layers, meaning that the number of hidden layers is two [55]. The third network contains four layers, meaning that the number of hidden layers is three [56], as shown in Figure 4.
Each layer has nodes and a chain of neurons arranged in it. Networks are created by connecting the neurons in each layer [57]. Each network has a specific weight [58].
Figure 3. Structure of ANN
The algorithm in the training phase contains a mathematical formula whose function is to change the weights of each network by improving the error functions [59].
The training algorithm contains several types. The appropriate algorithm that gives more accurate results is chosen according to the type of problem and data [60].
In this research, the FFBP algorithm was chosen because it gave the best results. For every network that was employed, the input layer and hidden layers were chosen to use the TANSIG function, while the output layer was chosen to use the PURELINE function.
70% of the data was selected to train the model, and 30% of the data was used to test the model's performance in prediction using MATLAB. The appropriate network for the study was selected according to the statistical indicators.
Figure 4. Neural network structure for the three models
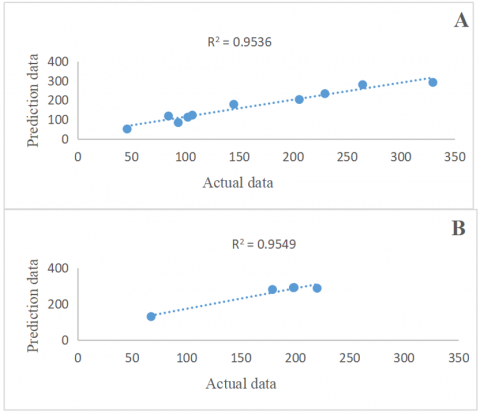
The outcomes of the statistical indicators shown in Table 3 showed that the best network that gave good performance in the training phase shown in Figure 5 is the second network consisting of three layers with the highest value of R2 as shown in Figure 6 and the lowest value of RMSE in the training and testing phase.
Table 3. Statistical Indicators of ANN
|
No. of Net |
No. of Layers |
Train |
Testing |
||||||
|
R2 |
MSE |
RMSE |
MAE |
R2 |
MSE |
RMSE |
MAE |
||
|
1 |
2 |
0.7989 |
565.404 |
23.778 |
6.477 |
0.1209 |
2463.27 |
49.631 |
17.968 |
|
2 |
3 |
0.9549 |
64.179 |
8.011 |
2.42 |
0.9536 |
1203.7 |
34.694 |
13.931 |
|
3 |
4 |
0.8582 |
260.2 |
16.131 |
5.397 |
0.9275 |
1550.03 |
39.37 |
15.538 |
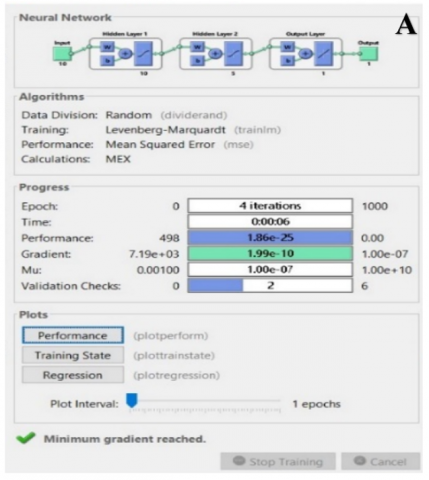
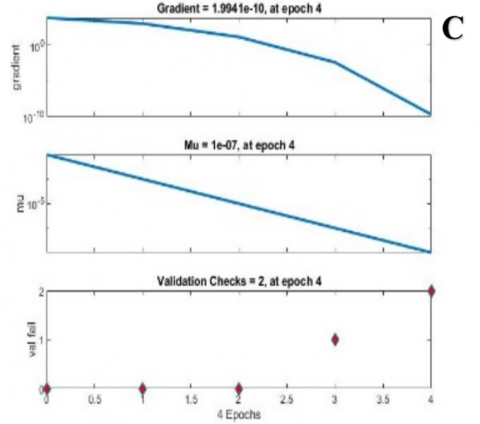
Figure 5. Three-layer neural network (A) training structure; (B) performance; (C) training state; (D) regression
Figure 6. R2 of a three-layer ANN, (A) for the train and (B) for the test
One of the machine learning models works on classifying data into two groups, where the data is separated by a straight line called the hyperplane [61], as shown in Figure 7. The best straight line is chosen when the distance between the straight line and the nearest data points is equivalent [62, 63], and the margin is the name given to this distance [64].
Figure 7. (a) Potential overload level; (b) Optimum overload level, and (c) Support vectors
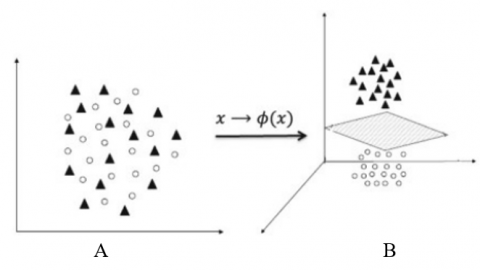
Kernel functions are employed when the data is complicated and cannot be divided by a straight line [65]. This makes the data set three-dimensional by transforming it from the input space to a high-dimensional space [66], as shown in Figure 8.
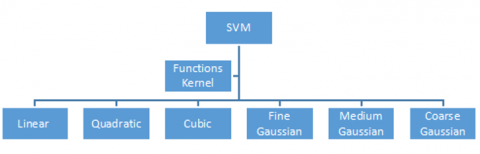
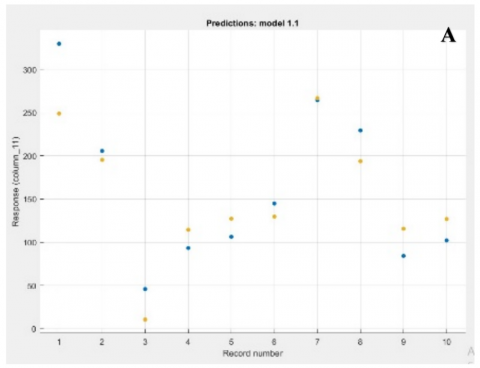
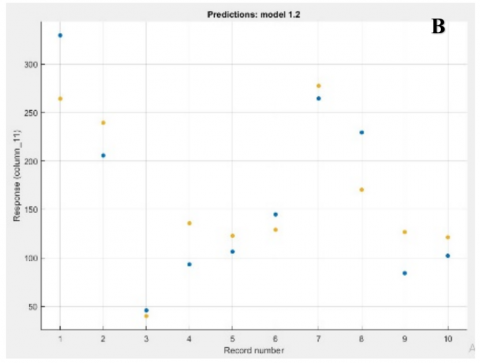
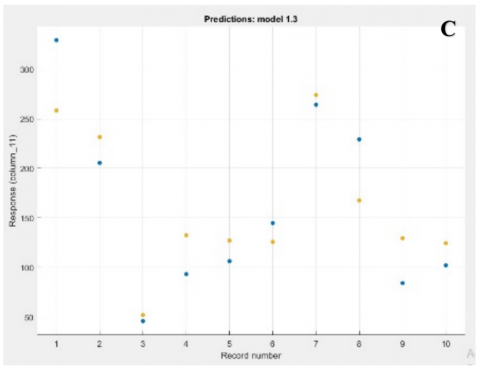
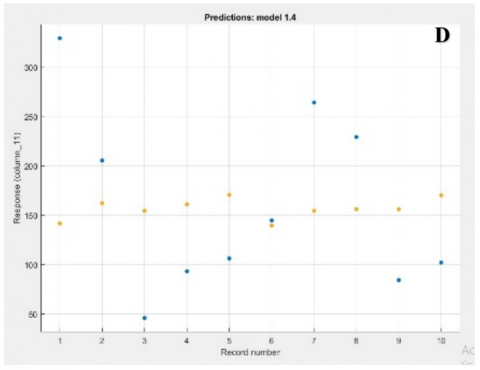
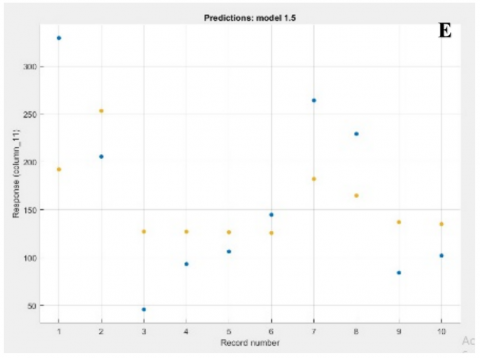
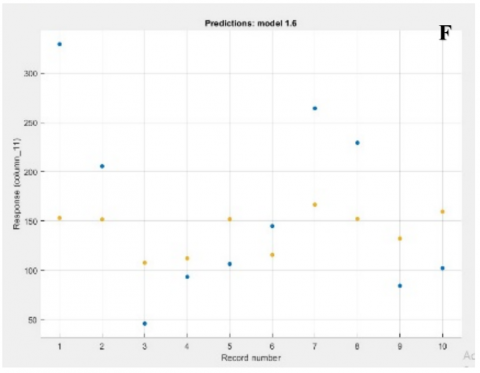
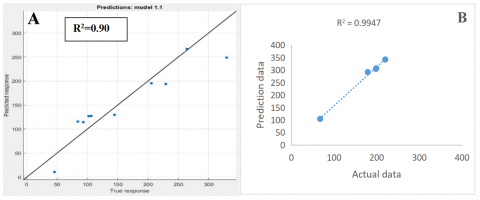
The SVM model contains six types of kernel functions [67] as shown in Figure 9. All of them were applied using MATLAB to estimate the groundwater quality index as shown in Figure 10. After calculating the statistical indicators shown in Table 4. The best model that produced good results and high prediction performance was determined to be Linear SVM, which had the lowest RMSE throughout the stages of training and testing and the greatest R2 value, as shown in Figure 11.
Figure 8. (A) Represents data in the input space; (B) Represents data in the feature space
Figure 9. Flowchart for design and construction (SVM) models
Figure 10. Training state by (A) Linear SVM; (B) Quadratic SVM; (C) Cubic SVM; (D) Fine Gaussian SVM; (E) Medium Gaussian SVM; (F) Coarse Gaussian SVM
Table 4. Statistical Indicators of SVM
|
SVM |
Training |
Testing |
||||||
|
R2 |
MSE |
RMSE |
MAE |
R2 |
MSE |
RMSE |
MAE |
|
|
Linear SVM |
0.90 |
1185.3 |
34.429 |
27.746 |
0.9947 |
1015.558 |
31.868 |
16.211 |
|
Quadratic SVM |
0.84 |
1359.6 |
36.873 |
31.343 |
0.9825 |
4164.909 |
64.536 |
24.628 |
|
Cubic SVM |
0.83 |
1456 |
38.158 |
32.148 |
0.9749 |
6296.84 |
79.353 |
29.951 |
|
Fine Gaussian SVM |
0.02 |
8498.6 |
92.188 |
80.046 |
0.9426 |
3036.484 |
55.104 |
50.859 |
|
Medium Gaussian SVM |
0.49 |
4448.7 |
66.699 |
57.22 |
0.9112 |
1332.845 |
36.508 |
32.988 |
|
Coarse Gaussian SVM |
0.28 |
6226.8 |
78.91 |
66.607 |
0.9538 |
1731.691 |
41.614 |
25.726 |
Figure 11. R2 of Linear SVM, (A) for the train and (B) for the test
One of the AI techniques, its operation is modeled after the composition and capabilities of the human brain [68, 69]. The difference between it and ANN is that DL contains several hidden layers, as shown in Figure 12. Hence, it is called deep learning, as it deals with huge amounts of complex data because of its capacity to discover features and relationships between variables [70].
Deep learning has been widely used in engineering applications [71], where it has been utilized to estimate and predict WQI based on WQ parameters such as salinity, acidity, anions, and cations [72].
The DL model was used to calculate and predict the WQI according to the (ReLU Layer) activation function. However, according to the statistical indicators shown in Table 3, this model was found to be unsuitable for this study because it gave the highest value for RMSE in the testing, in contrast to the other models that were utilized. Figure 12 shows the RMSE in the training phase, and Figure 13 shows the R2 in the training and testing phases.
Figure 12. RMSE of training
Figure 13. R2 for Anbar Governorate (A) for training; (B) for testing
The study results show that the AI models are effective and provide accurate and reliable results for estimating the IWQI, with R2 values between (0.95 to 0.99). Furthermore, a 70/30 data split, which includes subsets for training and testing, has proven to be a successful division for calculating the groundwater WQ. The three-layer ANN model performed better than other ANNs used, so a second network consisting of three layers and two hidden neurons was chosen. The Linear SVM model performed better than other SVM kernel functions, so it was relied upon in this research. Furthermore, the high RMSE value of the DL model during the testing phase indicated that the model does not perform well on the data used.
According to the statistical indicators, in this study, the SVM model excelled the ANN and DL models. In the testing phase, the SVM model had the greatest value (R2 = 0.99) and the lowest value (RMSE = 31.8), as indicated in Table 5. The ANN model came in second (R2 = 0.95, RMSE = 34.6). The DL model's results demonstrated that it is not a suitable model for this investigation (RMSE = 188.6), because the DL model is more responsive to massive data as it contains several hidden layers [21, 73]. The data obtained for this research are considered to be of the average type. For this reason, the SVM model outperforms the remaining models utilized in this investigation, as it interacts with the average and small data [74], while the ANN model responds to big data [75, 76].
Table 5. Comparison of model performance for all data for testing
|
ANN |
SVM |
DL |
|||||||||
|
R2 |
MSE |
RMSE |
MAE |
R2 |
MSE |
RMSE |
MAE |
R2 |
MSE |
RMSE |
MAE |
|
0.9536 |
1203.7 |
34.694 |
13.931 |
0.9947 |
1015.55 |
31.868 |
16.211 |
0.9889 |
35592.95 |
188.661 |
30.009 |
The efficiency of the model was explained in this analysis using the R2, MSE, RMSE, and MAE, as those variables have been considered in the majority of publications [23, 77, 78]. In predicting the groundwater WQI, the SVM model has proven to be incredibly reliable and effective [20, 25].
Determining the (IWQI) for irrigation reasons is the main goal of this research. The IWQI results show that 80% of the groundwater samples that demonstrated excellent quality for irrigation, while 6.67% exhibited very good quality, 6.67% exhibited good quality, and 6.67% exhibited satisfactory quality. Therefore, the groundwater quality can be generally classified as suitable for irrigation.
As a secondary objective of this research, comparisons were made between AI models used to identify the accuracy of the groundwater quality index (GWI) in predicting future water quality index. ANN, SVM, and DL were used to verify IWQI estimate. To estimate and forecast the IWQI of groundwater from many wells in the Anbar Governorate, the ANN and DL models have been beaten by the SVM model. AI models can be used to estimate the parameters used to calculate the (IWQI). This method eliminates errors resulting from several factors, such as expert opinions on groundwater quality indicators, thus achieving purer results.
The results of this research will contribute to the integrated management of groundwater resources and help water managers, policy makers, and water researchers provide important information for making informed decisions about water use and directing water to areas that need attention.
Water managers and policy makers can rely on the results of this study to improve irrigation practices by developing plans to improve water efficiency for irrigation purposes, estimating climate impacts on groundwater quality, and identifying agricultural areas that need development. In addition, the SVM model can be integrated with water management systems to provide accurate predictions of groundwater quality, select suitable agricultural lands and water in the region, and develop early warning systems for farmers when changes in water quality occur.
AI models are characterized by high accuracy, performance, and fast data processing, but their performance depends on the quality of the data, as if the data is insufficient or inaccurate, it affects the accuracy of the results. In addition, the results obtained from AI methods vary from one region to another. Therefore, the methodology of the model used depends on the type of data in each region. The model used may not be scalable or widely applicable. To overcome these drawbacks or limitations, it is necessary to improve and process the data quality or update more advanced models that have the ability to deal with unprocessed data to improve the performance of the model used for the study.
It is recommended to apply hybrid models to future water quality work to improve water control and improve the accuracy of water quality indicator predictions. The study methodology can be applied to different regions to understand the impact of climate change on water quality. The data can also be integrated with water and meteorological data to manage water, environmental and agricultural resources, predict drought or flooding, and improve water resource management decisions to improve agricultural crop production and reduce risks.
[1] Al-Sudani, H.I.Z. (2019). A review on groundwater pollution. International Journal of Recent Engineering Science (IJRES), 6(5): 14-22. https://doi.org/10.14445/23497157/ijres-v6i5p103
[2] Harter, T. (2003). Groundwater quality and groundwater pollution. https://doi.org/10.3733/ucanr.8084
[3] Subba Rao, N. (2008). Factors controlling the salinity in groundwater in parts of Guntur district, Andhra Pradesh, India. Environmental Monitoring and Assessment, 138: 327-341. https://doi.org/10.1007/s10661-007-9801-4
[4] Allawi, M.F., Al-Ani, Y., Jalal, A.D., Ismael, Z.M., Sherif, M., El-Shafie, A. (2024). Groundwater quality parameters prediction based on data-driven models. Engineering Applications of Computational Fluid Mechanics, 18(1): 2364749. https://doi.org/10.1080/19942060.2024.2364749
[5] Abd, M.H., Al-Ani, Y., Allawi, M.F. (2025). Applications of artificial intelligence methods for irrigation water quality index: Review. International Journal of Design & Nature and Ecodynamics, 20(1): 187-196. https://doi.org/https://doi.org/10.18280/ijdne.200120
[6] Purkayastha, D., Sarkar, S., Roy, P., Kazmi, A.A. (2017). Isolation and morphological study of ecologically-important insect ‘Hermetia illucens’ collected from Roorkee compost plant. Pollution, 3(3): 453-459.
[7] Yıldız, S., Karakuş, C.B. (2020). Estimation of irrigation water quality index with development of an optimum model: A case study. Environment, Development and Sustainability, 22: 4771-4786. https://doi.org/10.1007/s10668-019-00405-5
[8] Li, P., Wu, J. Qian, H. (2013). Assessment of groundwater quality for irrigation purposes and identification of hydrogeochemical evolution mechanisms in Pengyang County, China. Environmental Earth Sciences, 69: 2211-2225. https://doi.org/10.1007/s12665-012-2049-5
[9] Cieszynska, M., Wesolowski, M., Bartoszewicz, M., Michalska, M., Nowacki, J. (2012). Application of physicochemical data for water-quality assessment of watercourses in the Gdansk Municipality (South Baltic coast). Environmental Monitoring and Assessment, 184: 2017-2029. https://doi.org/10.1007/s10661-011-2096-5
[10] Saeedi, M., Abessi, O., Sharifi, F., Meraji, H. (2010). Development of groundwater quality index. Environmental Monitoring and Assessment, 163: 327-335. https://doi.org/10.1007/s10661-009-0837-5
[11] Abba, S.I., Abdulkadir, R.A., Sammen, S.S., Pham, Q.B., Lawan, A.A., Esmaili, P., Malik, A., Al-Ansari, N. (2022). Integrating feature extraction approaches with hybrid emotional neural networks for water quality index modeling. Applied Soft Computing, 114: 108036. https://doi.org/10.1016/j.asoc.2021.108036
[12] Yildiz, S., Degirmenci, M. (2015). Estimation of oxygen exchange during treatment sludge composting through multiple regression and artificial neural networks (estimation of oxygen exchange during composting). International Journal Environmental Research, 9(4): 1173-1182. https://doi.org/10.22059/ijer.2015.1007
[13] Ranković, V., Radulović, J., Radojević, I., Ostojić, A., Čomić, L. (2012). Prediction of dissolved oxygen in reservoirs using adaptive network-based fuzzy inference system. Journal of Hydroinformatics, 14(1): 167-179/ https://doi.org/10.2166/hydro.2011.084
[14] Baghapour, M.A., Fadaei Nobandegani, A., Talebbeydokhti, N., Bagherzadeh, S., Nadiri, A.A., Gharekhani, M., Chitsazan, N. (2016). Optimization of DRASTIC method by artificial neural network, nitrate vulnerability index, and composite DRASTIC models to assess groundwater vulnerability for unconfined aquifer of Shiraz Plain, Iran. Journal of Environmental Health Science and Engineering, 14: 13. https://doi.org/10.1186/s40201-016-0254-y
[15] Gazzaz, N.M., Yusoff, M.K., Aris, A.Z., Juahir, H., Ramli, M.F. (2012). Artificial neural network modeling of the water quality index for Kinta River (Malaysia) using water quality variables as predictors. Marine Pollution Bulletin, 64(11): 2409-2420. https://doi.org/10.1016/j.marpolbul.2012.08.005
[16] Maier, H.R., Dandy, G.C. (2000). Neural networks for the prediction and forecasting of water resources variables: A review of modelling issues and applications. Environmental Modelling & Software, 15(1): 101-124. https://doi.org/10.1016/S1364-8152(99)00007-9
[17] Masood, A., Niazkar, M., Zakwan, M., Piraei, R. (2023). A machine learning-based framework for water quality index estimation in the Southern Bug River. Water, 15(20), 3543. https://doi.org/10.3390/w15203543
[18] Gad, M., Gaagai, A., Eid, M.H., Szűcs, P., Hussein, H., Elsherbiny, O., Elsayed, S., Khalifa, M.M., Moghanm, F. S., Moustapha, M.E., Tolan, D.A., Ibrahim, H. (2023). Groundwater quality and health risk assessment using indexing approaches, multivariate statistical analysis, artificial neural networks, and GIS techniques in El Kharga Oasis, Egypt. Water, 15(6): 1216. https://doi.org/10.3390/w15061216
[19] Sahaya Vasant, S., Adish Kum, S. (2019). Application of artificial neural network techniques for predicting the water quality index in the Parakai Lake, Tamil Nadu, India. Applied Ecology Environmental Research, 17(2): 1947-1958. https://doi.org/10.15666/aeer/1702_19471958
[20] Abu El-Magd, S.A., Ismael, I.S., El-Sabri, M.A.S. El-Sabri, M.S.S., Abdo, M.A., Farhat, H.I. (2023). Integrated machine learning–based model and WQI for groundwater quality assessment: ML, geospatial, and hydro-index approaches. Environmental Science and Pollution Research, 30: 53862-53875. https://doi.org/10.1007/s11356-023-25938-1
[21] Baek, S.S., Pyo, J., Chun, J.A. (2020). Prediction of water level and water quality using a CNN-LSTM combined deep learning approach. Water, 12(12): 3399. https://doi.org/10.3390/w12123399
[22] Mokhtar, A., Elbeltagi, A., Gyasi-Agyei, Y. Al-Ansari, N., Abdel-Fattah, M.K. (2022). Prediction of irrigation water quality indices based on machine learning and regression models. Applied Water Science, 12: 76. https://doi.org/10.1007/s13201-022-01590-x
[23] Taşan, S. (2023). Estimation of groundwater quality using an integration of water quality index, artificial intelligence methods and GIS: Case study, Central Mediterranean Region of Turkey. Applied Water Science, 13: 15. https://doi.org/10.1007/s13201-022-01810-4
[24] Gaagai, A., Aouissi, H.A., Bencedira, S., Hinge, G., Athamena, A., Heddam, S., Gad, M., Elsherbiny, O., Elsayed, S., Eid, M.H., Ibrahim, H. (2023). Application of water quality indices, machine learning approaches, and GIS to identify groundwater quality for irrigation purposes: A case study of Sahara Aquifer, Doucen Plain, Algeria. Water, 15(2): 289. https://doi.org/10.3390/w15020289
[25] Derdour, A., Abdo, H.G., Almohamad, H., Alodah, A., Al Dughairi, A.A., Ghoneim, S.S.M., Ali, E. (2023). Prediction of groundwater quality index using classification techniques in arid environments. Sustainability, 15(12): 9687. https://doi.org/10.3390/su15129687
[26] Noon, A.M., Ahmed, H.G., Sulaiman, S.O. (2021). Assessment of water demand in Al-Anbar Province - Iraq. Environment and Ecology Research, 9(2): 64-75. https://doi.org/10.13189/eer.2021.090203
[27] Sulaiman, S.O., Kamel, A.H., Sayl, K.N. Alfadhel, M.Y. (2019). Water resources management and sustainability over the Western desert of Iraq. Environmental Earth Sciences, 78: 495. https://doi.org/10.1007/s12665-019-8510-y
[28] Mustafa, A.S., Sulaiman, S.O., Hussein, O.M. (2016). Application of SWAT model for sediment loads from valleys transmitted to Haditha reservoir. Journal of Engineering, 22(1): 184-197. https://doi.org/10.31026/j.eng.2016.01.12
[29] Brown, R.M., McClelland, N.I., Deininger, R.A., Tozer, R.G. (1970). A water quality index-Do we dare. Water and Sewage works, 117(10).
[30] Yisa, J., Jimoh, T. (2010). Analytical studies on Water Quality Index of River Landzu. American Journal of Applied Sciences, 7(4): 453-458. https://doi.org/10.3844/ajassp.2010.453.458
[31] Akter, T., Jhohura, F.T., Akter, F., Chowdhury, T.R., Mistry, S.K., Dey, D., Barua, M.K., Islam, M.A., Rahman, M. (2016). Water Quality Index for measuring drinking water quality in rural Bangladesh: A crosssectional study. Journal of Health, Population and Nutrition, 35: 4. https://doi.org/10.1186/s41043-016-0041-5
[32] Sahab, M.F., Alani, A.R., Marzoog, A., Fahad, M.M., Fayyadh, A.H. (2025). Utilization of heavy metal pollution indices to appraise surface water quality according to WHO Standards. An-Najah University Journal for Research - A (Natural Sciences), 39(2): 167-174. https://doi.org/ 10.35552/anujr.a.39.2.2351
[33] Hussein, E.E., Derdour, A., Zerouali, B., Almaliki, A., Wong, Y.J., Ballesta-de los Santos, M., Minh Ngoc, P., Hashim, M.A., Elbeltagi, A. (2024). Groundwater quality assessment and irrigation water quality index prediction using machine learning algorithms. Water, 16(2), 264. https://doi.org/10.3390/w16020264
[34] Tyagi, S., Sharma, B., Singh, P., Dobhal, R. (2013). Water quality assessment in terms of water quality index. American Journal of Water Resources, 1(3): 34-38. https://doi.org/10.12691/ajwr-1-3-3
[35] Wu, Z., Wang, X., Chen, Y., Cai, Y., Deng, J. (2018). Assessing river water quality using water quality index in Lake Taihu Basin, China. Science of The Total Environment, 612: 914-922. https://doi.org/10.1016/j.scitotenv.2017.08.293
[36] FAO. (1985). Water quality for agriculture. https://openknowledge.fao.org/server/api/core/bitstreams/b1345105-e9e6-4704-81cc-577f8e187278/content.
[37] Herrmann, H., Bucksch, H. (2014). Groundwater movement. In Dictionary Geotechnical Engineering/Wörterbuch GeoTechnik. pp. 645-645. https://doi.org/10.1007/978-3-642-41714-6_72667
[38] Dimple, D., Rajput, J., Al-Ansari, N., Elbeltagi, A. (2022). Predicting irrigation water quality indices based on data-driven algorithms: Case study in semiarid environment. Journal of Chemistry, 2022(1): 4488446. https://doi.org/10.1155/2022/4488446
[39] Almeida, C., Quintar, S., González, P., Mallea, M. (2008). Assessment of irrigation water quality. A proposal of a quality profile. Environmental Monitoring and Assessment, 142: 149-152. https://doi.org/10.1007/s10661-007-9916-7
[40] Subba Rao, N. (2018). Groundwater quality from a part of Prakasam District, Andhra Pradesh, India. Applied Water Science, 8: 30. https://doi.org/10.1007/s13201-018-0665-2
[41] Li, Z., Demir, I. (2024). Better localized predictions with out-of-scope information and explainable AI: One-shot SAR backscatter nowcast framework with data from neighboring region. ISPRS Journal of Photogrammetry and Remote Sensing, 207: 92-103. https://doi.org/10.1016/j.isprsjprs.2023.11.021
[42] Sahab, M.F., Abdullah, M.H., Hammadi, G.A., Hamad, N.S., Abdulazez, A.A., Fayyadh, A.H., Ayed, D.J., Jalal, A.D., Sayl, K.N., Ramal, M.M. (2024). Ground water quality evaluation for irrigation purpose: Case study Al-Wafaa area, western Iraq. International Journal of Design & Nature and Ecodynamics, 19(4): 1415-1424. https://doi.org/10.18280/ijdne.190434
[43] Zhang, D. (2017). A coefficient of determination for generalized linear models. The American Statistician, 71(4): 310-316. https://doi.org/10.1080/00031305.2016.1256839
[44] Renaud, O., Victoria-Feser, M.P. (2010). A robust coefficient of determination for regression. Journal of Statistical Planning and Inference, 140(7): 1852-1862. https://doi.org/10.1016/j.jspi.2010.01.008
[45] Hodson, T.O., Over, T.M., Foks, S.S. (2021). Mean squared error, deconstructed. Journal of Advances in Modeling Earth Systems, 13(12): e2021MS002681. https://doi.org/10.1029/2021MS002681
[46] Murphy, A.H. (1988). Skill scores based on the mean square error and their relationships to the correlation coefficient. Monthly Weather Review, 116: 2417-2424. https://doi.org/10.1175/1520-0493(1988)116<2417:SSBOTM>2.0.CO;2
[47] Hodson, T.O. (2022). Root-mean-square error (RMSE) or mean absolute error (MAE): When to use them or not. Geoscientific Model Development, 15(14): 5481-5487. https://doi.org/10.5194/gmd-15-5481-2022
[48] Chai, T., Draxler, R.R. (2014). Root mean square error (RMSE) or mean absolute error (MAE)? - Arguments against avoiding RMSE in the literature. Geoscientific Model Development, 7(3): 1247-1250. https://doi.org/10.5194/gmd-7-1247-2014
[49] Singh, M., Duval, Q., Alwala, K.V., Fan, H., Aggarwal, V., Adcock, A., Joulin, A., Doolar, P., Feichtenhofer, C., Girshick, R., Girdhar, R., Misra, I. (2023). The effectiveness of MAE pre-pretraining for billion-scale pretraining. In Proceedings of the IEEE/CVF international conference on computer vision, Paris, France, pp. 5484-5494.
[50] Willmott, C.J., Matsuura, K. (2005). Advantages of the mean absolute error (MAE) over the root mean square error (RMSE) in assessing average model performance. Climate Research, 30: 79-82. https://doi.org/10.3354/cr030079
[51] Cinar, A.C. (2020). Training feed-forward multi-layer perceptron artificial neural networks with a tree-seed algorithm training feed-forward multi-layer perceptron artificial neural networks with a tree-seed algorithm. Arabian Journal for Science and Engineering, 45: 10915-10938. https://doi.org/10.1007/s13369-020-04872-1
[52] Panchal, G., Ganatra, A., Kosta, Y.P., Panchal, D. (2011). Behaviour analysis of multilayer perceptronswith multiple hidden neurons and hidden layers. International Journal of Computer Theory and Engineering, 3(2): 332-337. https://doi.org/10.7763/ijcte.2011.v3.328
[53] Gaya, M.S., Abba, S.I., Abdu, A.M., Tukur, A.I., Saleh, M.A., Esmaili, P., Wahab, N.A. (2020). Estimation of water quality index using artificial intelligence approaches and multi-linear regression. International Journal of Artificial Intelligence 9(1): 126-134. https://doi.org/10.11591/ijai.v9.i1.pp126-134
[54] Ray, D., Hesthaven, J.S. (2018). An artificial neural network as a troubled-cell indicator. Journal of Computational Physics, 367: 166-191. https://doi.org/10.1016/j.jcp.2018.04.029
[55] Shanmuganathan, S. (2016). Artificial neural network modelling: An introduction. In Artificial Neural Network Modelling. Springer, Cham. https://doi.org/10.1007/978-3-319-28495-8_1
[56] Trach, R., Trach, Y., Kiersnowska, A., Markiewicz, A., Lendo-Siwicka, M., Rusakov, K. (2022). A study of assessment and prediction of water quality index using fuzzy logic and ANN models. Sustainability, 14(9): 5656. https://doi.org/10.3390/su14095656
[57] Chu, H., Lu, W., Zhang, L. (2013). Application of artificial neural network in environmental water quality assessment. Journal of Agricultural Science and Technology, 15(2): 343-356. http://jast.modares.ac.ir/article-23-2071-en.html.
[58] Alaloul, W.S., Qureshi, A.H. (2020). Data processing using artificial neural networks. In Dynamic Data Assimilation-Beating the Uncertainties. IntechOpen. https://doi.org/10.5772/intechopen.91935
[59] Asadollahfardi, G. (2015). Artificial Neural Network. In Water Quality Management. SpringerBriefs in Water Science and Technology. Springer, Berlin, Heidelberg, pp. 77-91. https://doi.org/10.1007/978-3-662-44725-3_5
[60] Islam, M., Chen, G., Jin, S. (2019). An overview of neural network. American Journal of Neural Networks and Applications, 5(1): 7-11. https://doi.org/10.11648/j.ajnna.20190501.12
[61] Amarappa, S., Sathyanarayana, S.V. (2014). Data classification using support vector machine (SVM), a simplified approach. International Journal of Electronics and Computer Science Engineering, 3: 435-445.
[62] Benmahamed, Y., Kherif, O., Teguar, M., Boubakeur, A., Ghoneim, S.S.M. (2021). Accuracy improvement of transformer faults diagnostic based on DGA data using SVM-BA classifier. Energies, 14(10): 2970. https://doi.org/10.3390/en14102970
[63] Zhang, Y., Li, J., Fan, X., Liu, J., Zhang, H. (2020). Moisture prediction of transformer oil-immersed polymer insulation by applying a support vector machine combined with a genetic algorithm. Polymers, 12(7): 1579. https://doi.org/10.3390/polym12071579
[64] Mahmood, O.A., Sulaiman, S.O., Al-Jumeily, D. (2024). Forecasting for haditha reservoir inflow in the west of Iraq using support vector machine (SVM). PLoS One, 19(9): e0308266. https://doi.org/10.1371/journal.pone.0308266
[65] Chauhan, V.K., Dahiya, K., Sharma, A. (2019). Problem formulations and solvers in linear SVM: A review. Artificial Intelligence Review, 52(2): 803-855. https://doi.org/10.1007/s10462-018-9614-6
[66] Carreira-Perpinán, M.A. (1997). A review of dimension reduction techniques. Tech. Rep. CS-96-09, 9: 1-69. https://faculty.ucmerced.edu/mcarreira-perpinan/papers/cs-96-09.pdf.
[67] Mamat, N., Mohd Razali, S.F., Hamzah, F.B. (2023). Enhancement of water quality index prediction using support vector machine with sensitivity analysis. Frontiers in Environmental Science, 10: 1061835. https://doi.org/10.3389/fenvs.2022.1061835
[68] Guo, Y., Liu, Y., Oerlemans, A., Lao, S., Wu, S., Lew, M.S. (2016). Deep learning for visual understanding: A review. Neurocomputing, 187: 27-48. https://doi.org/10.1016/j.neucom.2015.09.116
[69] Sarker, I.H. (2021). Deep cybersecurity: A comprehensive overview from neural network and deep learning perspective. SN Computer Science, 2: 154. https://doi.org/10.1007/s42979-021-00535-6
[70] Bengio, Y., Goodfellow, I., Courville, A. (2017). Deep Learning. Cambridge, MA, USA: MIT press. pp. 23-24.
[71] Goodfellow, I., Bengio, Y., Courville, A., Bengio, Y. (2016). Deep Learning. Cambridge: MIT press.
[72] Ehteram, M., Ahmed, A.N., Sherif, M., El-Shafie, A. (2024). An advanced deep learning model for predicting water quality index. Ecological Indicators, 160: 111806. https://doi.org/10.1016/j.ecolind.2024.111806
[73] Sha, J., Li, X., Zhang, M., Wang, Z.L. (2021). Comparison of forecasting models for real-time monitoring of water quality parameters based on hybrid deep learning neural networks. Water, 13(11): 1547. https://doi.org/10.3390/w13111547
[74] Jahandideh-Tehrani, M., Bozorg-Haddad, O., Loáiciga, H.A. (2020). Application of particle swarm optimization to water management: An introduction and overview. Environmental Monitoring and Assessment, 192(5): 281. https://doi.org/10.1007/s10661-020-8228-z
[75] Unterthiner, T., Keysers, D., Gelly, S., Bousquet, O., Tolstikhin, I. (2020). Predicting neural network accuracy from weights. arXiv preprint arXiv:2002.11448. http://arxiv.org/abs/2002.11448
[76] Sharma, S., Sharma, S., Athaiya, A. (2017). Activation functions in neural networks. Towards Data Sci, 6(12): 310-316. https://doi.org/10.33564/ijeast.2020.v04i12.054
[77] Bhattarai, A., Dhakal, S., Gautam, Y., Bhattarai, R. (2021). Prediction of nitrate and phosphorus concentrations using machine learning algorithms in watersheds with different landuse. Water, 13(21): 3096. https://doi.org/10.3390/w13213096
[78] M'nassri, S., El Amri, A., Nasri, N., Majdoub, R. (2022). Estimation of irrigation water quality index in a semi-arid environment using data-driven approach. Water Supply, 22(5): 5161-5175. https://doi.org/10.2166/ws.2022.157