Yudi Antomi*![]() | Fajrin
| Fajrin![]() | Hendri Nofrianto
| Hendri Nofrianto![]() | Defwaldi
| Defwaldi![]() | Zikri Alhadi
| Zikri Alhadi![]()
© 2025 The authors. This article is published by IIETA and is licensed under the CC BY 4.0 license (http://creativecommons.org/licenses/by/4.0/).
OPEN ACCESS
Urbanization persistently propels the expansion of the global populace, thereby contributing to occurrences such as the Urban Heat Island (UHI) phenomenon, wherein metropolitan regions exhibit elevated temperatures compared to rural areas. This research examines land surface temperature (LST) in Padang City, West Sumatra, utilizing Landsat 8 satellite imagery from 2016 to 2024, with an emphasis on the interplay between LST, topographical features, land utilization, and their repercussions for thermal comfort within Padang City. The employment of linear regression analysis reveals that elevation, NDVI, and NDBI account for 66.63%, 45.64%, and 66.73% of the variation in LST, respectively. The forested highlands situated in the eastern region (elevation 1000-1400 meters, NDVI 0.4-0.6) exhibit low LST values (15-20℃, UTCI 9-26℃, indicative of a Neutral sensation), whereas the urban lowlands located in the western part (elevation 0-200 meters, characterized by high NDBI) demonstrate elevated LST levels (25-30℃), frequently leading to Slight heat stress to Strong heat stress (UTCI 26-38°C, ranging from slightly warm to Hot sensation). Temporal analyses of temperature indicate that maximum temperatures oscillated between 36.77℃ (January 2018) and 34.04℃ (May 2020), influenced by the dry season, urbanization, and social restrictions imposed during the COVID-19 pandemic. To alleviate heat and enhance thermal comfort, it is advisable to expand green spaces in coastal lowlands, utilize high-albedo building materials, and preserve forested areas in the highlands.
land surface temperature (LST), thermal comfort (UTCI), urban heat, environment, SGDs 11, SGDs 13
The worldwide urban demographic is anticipated to escalate from 55% to 68% by the year 2050 [1], adding 2.5 billion urban dwellers due to ongoing urbanisation [2]. Urbanisation affects various aspects, including demographic, socioeconomic, and physical landscapes, resulting in different impacts on greenhouse gas (GHG) emissions depending on the development stage of countries worldwide. The UHI, where urban areas exhibit higher temperatures than surrounding rural areas, exacerbates the impacts of climate change, Increasing the frequency and intensity of thermal events, thereby presenting substantial hazards, especially for heat-related diseases [3, 4]. Over the past decade, the UHI phenomenon has been extensively studied in cities worldwide, especially in China and the United States [5]. UHI is a temperature anomaly affecting life in urban environments, where urban areas are warmer than rural ones. The intensity of UHI is often measured as the maximum difference between the average urban and rural air temperatures. Urban structures, including buildings, concrete, asphalt, and industrial activities, contribute to the formation of UHI [6-10]. Tall buildings and narrow streets trap heat and reduce air circulation, while heat emissions from vehicles and factories further intensify the UHI effect. In addition, increasing energy demand for air conditioning exacerbates the impact of UHI [11].
Excessive heat exposure harms labour productivity, household spending patterns, and living standards [12-16]. The UHI phenomenon has the potential to exacerbate these conditions, exhibiting an average temperature differential ranging from 1℃ to 3℃. As reported by the Central Statistics Agency of Padang City, the peak temperature documented in the year 2023 attained a remarkable 36.7℃. The ramifications of the UHI effect on domestic energy expenditures [17] and the incongruence of ecosystem services are noteworthy. Aznarez et al. [18] have been widely discussed in the scientific literature. Recent studies on UHI in Padang revealed an increased risk of heat-related respiratory disorders and diarrheal diseases [19]. Regarding ecological sustainability and quality of life, assessing thermal comfort is crucial, as it positively affects daily life and social interactions in urban environments [20-22]. In addition, improving thermal comfort can enhance overall performance and economic outcomes [23-27].
The LST has emerged as an important parameter for assessing the presence of UHI. LST can be obtained using satellite imagery equipped with thermal infrared sensors [28-36] since ground-based weather stations often lack coverage and spatial distribution to capture temperature variations across urban areas comprehensively.
This research endeavors to delineate and examine the trends of urban temperature fluctuations, operationally defined as LST, within the confines of Padang City. The results are anticipated to elucidate aspects of human thermal comfort, as quantified by the Universal Thermal Climate Index (UTCI). At present, the UTCI is extensively employed in investigations concerning the ramifications of atmospheric conditions on human well-being and the assessment of Urban Heat Islands (UHI) [30-32].
Satellite data is important in evaluating and mapping climate research and thermal comfort assessment, including spatiotemporal analysis of UTCI [33, 34]. Rapid mapping of UTCI across a wider area is also essential for urban planning and heat wave-related health risk assessment [33, 34].
2.1 Thermal comfort index
A plethora of indices have been established to evaluate thermal comfort across a spectrum of environments and under diverse climatic conditions. Certain indices, particularly the Heat Stress Index (HSI) developed by academic researchers [35] and the Wet Bulb Globe Temperature Index (WBGT) devised by investigators [36], are specifically aimed at assessing heat stress in both elevated indoor and outdoor settings. The Physiological Equivalent Temperature (PET), introduced by scholars, is also extensively utilized to quantify human thermal comfort across a range of meteorological scenarios [37]. Among the most recently formulated indices is the UTCI [38, 39]. The UTCI evaluates thermal comfort in relation to a variety of climatic and environmental contexts, encompassing both urban and rural environments.
The UTCI possesses the capability to yield a more nuanced understanding of the impact of environmental variables on human thermal comfort. The UTCI was conceived as a standardized tool to investigate the ramifications of heat stress on individuals by taking into account primary meteorological factors, including air temperature, relative humidity, wind velocity, and thermal radiation [39]. The UTCI is extensively employed in scholarly inquiries regarding thermal comfort due to its proficiency in quantifying the intensity of heat stress based on existing atmospheric conditions. The classification of UTCI incorporates a spectrum of comfort levels, extending from "no thermal stress" to "extreme heat stress" [40]. The UTCI values ranging from 18 to 26℃ are considered indicative of the thermal comfort zone (Table 1) [37, 40]. However, given the notable scarcity of continuous spatial meteorological data in Padang City, remote sensing data such as LST may present a feasible alternative for more broadly estimating the distribution of thermal comfort.
Table 1. UTCI equivalent temperature is classified according to parameters of thermal stress and the Physiological Equivalent Temperature (PET)
|
Thermal Stress |
UTCI (℃) |
PET (℃) |
Thermal Sensation |
|
Extreme cold stress |
< -40 |
< 4 |
Very cold |
|
Very strong cold stress |
-40 to -27 |
|
|
|
Strong cold stress |
-27 to -13 |
4 to 8 |
Cold |
|
Moderate cold stress |
-13 to 0 |
8 to 13 |
Cool |
|
Slight cold stress |
0 to 9 |
13 to 18 |
Slightly cool |
|
No thermal stress |
9 to 26 |
18 to 23 |
Neutral |
|
Slight heat stress |
|
23 to 29 |
Slightly warm |
|
Moderate heat stress |
26 to 32 |
29 to 35 |
Warm |
|
Strong heat stress |
32 to 38 |
35 to 41 |
Hot |
|
Very strong heat stress |
38 to 46 |
|
|
|
Extreme heat stress |
> 46 |
> 41 |
Very hot |
2.2 The role of remote sensing in thermal comfort mapping
Remote sensing constitutes an invaluable technique for comprehending thermal comfort within urban settings, particularly regarding the UHI phenomenon. The UHI effect transpires when temperatures within urban locales exceed those of adjacent regions, attributable to various factors, including alterations in land surface characteristics, density of built environments, and insufficient greenery. A study by the researcher [34] showed that satellite data could help analyse surface temperatures more widely. In Jakarta, for example, satellite imagery revealed that areas with many buildings had much higher temperatures than areas with more vegetation [41].
In Bogor, a study by researchers [42] revealed that the future expansion of the city of Bogor will increase areas with high LST. This research offers valuable insights for urban planners aiming to design an urban environment that is both comfortable and sustainable. Simultaneously, through the application of satellite imagery, an additional study assessed the land surface temperature across two major Indonesian metropolitan areas, namely Jakarta and Surabaya, revealing a decline in the land surface temperature index alongside thermal humidity levels during the Covid-19 pandemic, which can be attributed to the enforcement of social restrictions in Jakarta [43]. Conversely, Surabaya experienced a marginal increase due to elevated human activity in comparison to Jakarta.
Research pertaining to urban heat phenomena, particularly in tropical regions like Indonesia, constitutes less than 20% of the overall global discourse on this subject [41]. Although research efforts have been carried out in these large cities, there is a gap in knowledge about urban heat in small towns in Indonesia. Another study [44] showed that even though medium-sized cities without green open spaces greatly affect air temperature and thermal comfort for their residents, they are the same as large cities. This study underlines the need for attention in medium-scale towns regarding thermal comfort. Despite the growing research, thermal comfort in Indonesia is still limited to large cities and concentrated on Java, such as Jakarta [41] and several towns on Java [45-47]. In juxtaposition, smaller urban centers are inadequately represented in existing literature; consequently, this research endeavors to address this deficiency by employing a remote sensing methodology, focusing on the geographical domain of Padang City, located in West Sumatra, which is characterized as a tropical coastal urban environment.
3.1 Study area and data collection
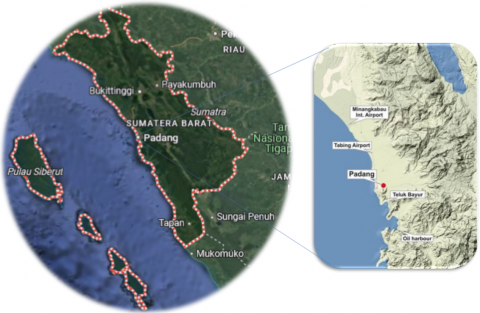
This scholarly investigation was undertaken in Padang City, which serves as the administrative capital of West Sumatra Province, Indonesia. This urban center demonstrates intricate urban and coastal dynamics, accommodating a populace of approximately 919,150 individuals. A significant portion of the city's landmass has been developed, operating as the core urban zone and the principal economic hub of the province. The elevated terrain is situated on the inclines of the Bukit Barisan Mountain range, which constitutes a designated protected forest region within the Kerinci Seblat National Park (TNKS). The topography of Padang City consists of hilly and lowland areas, with more concentrated and dense urban development in the lowland areas along the western coast (Figure 1). This is due to the steep topography in the east with a slope of up to 40%. The altitude of Padang City ranges from 0 to 1,853 meters above sea level. Padang City has a wet tropical climate, strongly influenced by the westerly wind, with a very short dry period and relatively humid conditions.
Figure 1. Study area in Padang City, West Sumatra, Indonesia
Datasets related to land surface temperature, derived from the imagery procured through the Landsat 8 Operational Land Imager (OLI) and Thermal Infrared Sensor (TIRS), span the timeframe from 2016 to 2024. This satellite-acquired imagery is intended to clarify the spatial distribution patterns of land surface temperature, facilitate the monitoring of temperature variations across temporal dimensions, and ascertain the classification of the UTCI within urban environments. The datasets employed in this analysis encompass multispectral imagery from bands four and five for the evaluation of surface reflectance, while the thermal band (band ten) is utilized to generate estimates of land surface temperature. The attributes of the datasets employed in this research are delineated in Table 2.
Table 2. Detailed information on Landsat 8 imagery used in this study
|
Sensor |
Path/Row |
Band Used |
Wavelength (µm) |
Resolution (meters) |
Acquisition Date |
|
OLI/ TIRS |
127/ 61 |
Band 4 (Red) |
0.64-0.67 |
30 |
07/06/2024 |
|
Band 5 (Near-infrared) |
0.85-0.88 |
30 |
04/07/2022 |
||
|
Band 6 (SWIR1) |
1,57-1,65 |
30 |
11/05/2020 |
||
|
Band 10 (TIRs 1,) |
10.6-11.19 |
30 |
30/01/2018 |
||
|
|
|
100 |
13/03/2016 |
3.2 Landsat 8 image collection
Landsat 8 OLI/TIRs imagery was procured from the online resource https://earthexplorer.usgs.gov/. The identification of cloud-free imagery within the designated study region presents considerable challenges; only a limited selection of images exhibits less than 10% cloud cover across the entirety of the area under investigation. Consequently, we have strategically selected dates wherein regions, particularly urban locales, are devoid of cloud interference. In the current study, band 10 is utilized to assess land surface temperatures. Additionally, band 4 (Red) and band 5 (Near Infrared) are employed in the calculation of the NDVI, which functions as a critical parameter for determining surface emissivity. Conversely, within urbanized regions, band 6 (Shortwave Infrared) in conjunction with band 5 (Near Infrared) is applied.
3.3 LST calculation
Radiometric correction where the Digital Number (DN) value is changed to Top of Atmosphere (TOA) using the following formula:
$L=ML\times DN+AL$ (1)
where, L represents the TOA spectral radiance (W/m²srµm), ML denotes the band-specific additive rescaling factor (obtained from the metadata associated with Landsat 8), AL indicates the band-specific multiplicative rescaling factor (derived from the same Landsat 8 metadata), and DN refers to the pixel value corresponding to the Landsat 8 image. Consequently, the radiance is subsequently converted into temperature (T) expressed in degrees Celsius (℃) through the application of the following equation:
$T=\frac{K2}{ln\left( \frac{K1}{L\lambda }+1 \right)}-273,15$ (2)
where, T denotes the temperature measured in Kelvin, K1 and K2 symbolize the calibration constants pertinent to the thermal spectral bands associated with the Landsat 8 satellite. In order to determine the precise land surface temperature derived from Landsat 8 imagery, it is imperative to compute the Emissivity value (∈), which can be acquired through the subsequent equation:
$\left( \in \right)=0.004\times \text{NDVI}+0.986$ (3)
where, ∈ represents the parameter that defines land surface emissivity, Pv denotes the fraction of vegetative cover present. The NDVI metric serves as a standard for appraising surface emissivity (ϵ). As a result, the equation that articulates the Normalized Difference Vegetation Index (NDVI) quantitatively evaluates the proportion of vegetation (Pv).
$NDVI=\frac{\text{ }\!\!~\!\!\text{ Band }\!\!~\!\!\text{ }5-\text{ }\!\!~\!\!\text{ Band }\!\!~\!\!\text{ }4}{\text{ }\!\!~\!\!\text{ Band }\!\!~\!\!\text{ }5+\text{ }\!\!~\!\!\text{ Band }\!\!~\!\!\text{ }4}$ (4)
$Pv=\frac{NDVI-NDV{{I}_{min}}}{NDV{{I}_{max}}-NDV{{I}_{min}}}$ (5)
The NDVI serves as a crucial tool for determining land surface emissivity (LSE), thereby facilitating the estimation of LST. The computation of NDVI is of utmost significance as it is intrinsically linked to the assessment of vegetation fraction (Pv) and emissivity (ε), both of which are vital components in the analysis of LST [48]. Furthermore, NDVI is employed in this investigation to examine the correlation between vegetative land cover and land surface temperature. The NDVI values span from -1 to 1, with values nearing 1 indicating a substantial density of vegetation, whereas values approaching zero signify either a minimal presence of vegetation or a total lack thereof [49].
To augment the comprehension of LST and land cover, this research integrates the utilization of the Normalized Difference Built-up Index (NDBI) alongside NDVI. NDBI functions as an index transformation algorithm that is adept at providing insights into the density of urbanized land through the examination of remote sensing imagery [49]. This algorithm is characterized by a straightforward equation that utilizes exclusively two spectral channels: the Short-Wave Infrared 1 (SWIR-1) and Near Infrared (NIR) channels derived from the Landsat 8 Operational Land Imager/Thermal Infrared Sensor (OLI/TIRS). The results produced from the calculation of the NDBI also range from -1 to 1, wherein negative NDBI values indicate regions lacking built structures, while notably positive values imply the presence of developed environments. The formulation of the NDBI can be articulated through the subsequent equation.:
$NDBI=\left( \frac{\text{ }\!\!~\!\!\text{ Band }\!\!~\!\!\text{ }6-\text{ }\!\!~\!\!\text{ Band }\!\!~\!\!\text{ }5}{\text{ }\!\!~\!\!\text{ Band }\!\!~\!\!\text{ }6+\text{ }\!\!~\!\!\text{ Band }\!\!~\!\!\text{ }5} \right)$
3.4 UTCI classification
Upon the procurement of LST data, a systematic categorization of the UTCI was conducted through the comparative examination of the LST values relative to the established temperature threshold parameters for UTCI classification. This method is employed to ascertain the degree of thermal comfort experienced across various regions of Padang City. The UTCI classifications encompass a spectrum from "extreme cold stress (characterized by an acute sensation of cold)" to "extreme heat stress (characterized by an acute sensation of heat)" [37, 40]. Subsequently, the LST data and UTCI classifications were subjected to spatial analysis to elucidate the distribution of surface temperature categories and corresponding thermal comfort levels within Padang City. This analytical procedure was performed utilizing Geographic Information System (GIS) software, which facilitates the spatial visualization of temperature distribution alongside thermal sensation (see Table 1).
4.1 Relationship of LST to elevation, NDVI and NDBI
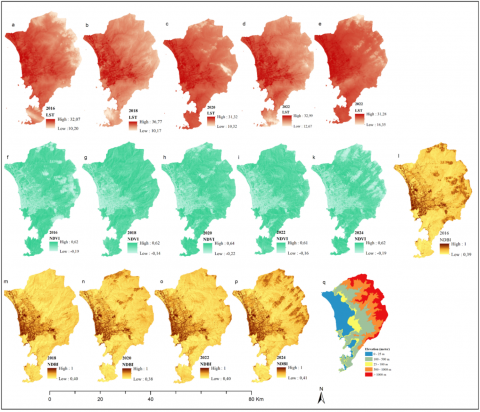
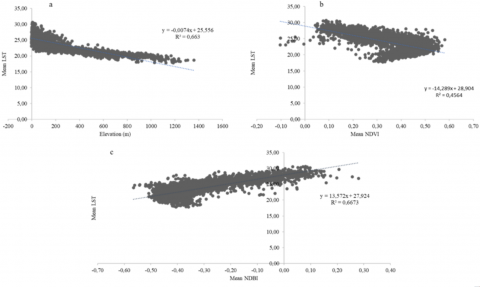
The analysis of LST within the geographic framework of Padang City, situated in West Sumatra, was carried out utilizing Landsat 8 satellite imagery spanning the years 2016 to 2024, with the aim of clarifying the correlation between LST and both topographical features and land use practices, as quantified by the NDVI and the NDBI over the identical temporal interval. The geographic topology of Padang City exhibits significant heterogeneity, encompassing urban lowland areas in the western sector and forested highland terrains in the eastern sector. To evaluate the interconnectedness of LST, topographical attributes, and land utilization—defined by NDVI and NDBI, as depicted in Figure 2—a linear regression analysis was conducted employing Elevation (measured in meters), NDVI, and NDBI as independent variables. The scatter plots illustrating the linear correlations between LST and these specified variables are presented in Figure 3.
Scatter plots (Figures 3 (a)-(c)) show a strong negative relationship between Elevation and mean LST. The R² value of 0.663 indicates that elevation changes can explain 66.3% of the variation in LST. In the context of Padang City, the highlands in the east (elevation 1000-1400 meters) show lower LST (mean 15-20℃), while the lowlands in the west (elevation 0-200 meters) have higher LST (mean 25-30℃). The data distribution on the scatter plot shows a clear linear decrease, which is to Padang's topographic characteristics, where the east's forested highlands have cooler temperatures.
Figure 2. Spatiotemporal LST (a-e), NDVI (f-k), NDBI (l-p) and elevation (q)
Furthermore, the land utilization patterns in Padang City as examined in this research can be elucidated through the utilization of NDVI and NDBI metrics. NDVI, which serves as a proxy for natural vegetation, exhibits an inverse correlation with LST, as illustrated in Figure 3(b). The coefficient of determination (R²) of 0.4564 denotes that 45.64% of the variability in LST is attributable to variations in vegetation density. This correlation underscores the cooling influence of vegetation mediated through processes of evapotranspiration and shading [50]. In the specific context of Padang City, regions characterized by elevated NDVI values (0.4-0.6), particularly within the forested eastern sector, exhibit lower LST (mean 20-25℃), whereas areas with diminished NDVI values (0.0-0.2), such as the urban lowlands to the west, are associated with elevated LST (mean 25-30℃). Conversely, NDBI, which serves as an indicator of urbanized areas, demonstrates a direct positive association with LST (R²=0.6673), as depicted in Figure 3(c). The R² value of 0.6673 indicates that urbanized regions account for 66.73% of the variability in LST. This correlation illustrates the Urban Heat Island phenomenon; wherein impermeable surfaces such as asphalt and constructed edifices that comprise urban locales (the western section of Padang City) contribute to an increase in land surface temperature.
Figure 3. Linear plot mean LST 2016-2024 versus (a) Elevation; (b) Mean NDVI; (c) Mean NDBI
4.2 Surface temperature temporal trends
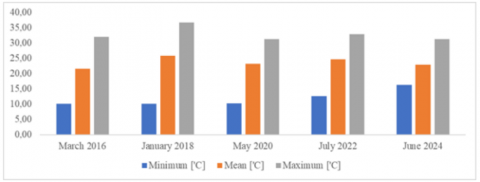
Temporal analysis of LST within the confines of Padang City reveals notable thermal variations occurring between the years 2016 and 2024. The observed minimum temperature exhibited an increase from 10.20℃ in March of 2016 to 16.35℃ in June of 2024, which can be attributed to surface warming phenomena in the western urban lowlands, corroborated by the positive correlation identified between the NDBI and LST. Surface materials such as concrete and asphalt, which are dominant in this area, absorb and release heat more slowly, causing heat to be trapped longer. The average temperature peaked in January 2018 (25.84℃), which can be attributed to increasing urbanization and decreasing vegetation in the lowlands, as indicated by the negative relationship between NDVI and LST. The Meteorology and Geophysics Agency reported that January 2018 marked the beginning of the dry season, which exacerbated the increase in temperature. However, the average temperature dropped to 22.92℃ in June 2024, which may be influenced by the forested land cover in the east, which has high NDVI and acts as an effective heat sink. The maximum temperature showed significant fluctuations, with a spike in January 2018 (36.77℃), followed by a decrease of -2.73℃ in May 2020 (34.04℃) due to large-scale social restrictions during the COVID-19 pandemic, which reduced outdoor activities and vehicle energy use in urban areas, this finding is in line with studies conducted in other cities where activity restrictions during the pandemic can reduce city temperatures [51, 52]. The increase in maximum temperature of 0.84℃ from May 2020 to July 2022, followed by a decrease of -0.86℃ until June 2024, reflects the recovery of urban activities after the restrictions (Figure 4).
Figure 4. Land surface temperature trends in Padang City 2016-2024
In summary, the geomorphology and anthropogenic land utilization within Padang City significantly influence the spatial distribution of land surface temperature (LST). The wooded elevations situated in the eastern region, with high NDVI and higher elevation, show lower LST (Figure 3(a)), as seen in the negative relationship with NDVI and elevation (Figure 3(b)). In contrast, urban lowlands in the west, with high NDBI and low elevation, experience a more significant increase in temperature, especially minimum temperatures, which show a consistent upward trend from 2016 to 2024. The fluctuations in average and maximum temperatures reflect the interaction between topography and land use, where forests in the highlands help lower temperatures, while urbanisation in the lowlands increases temperatures. The spatiotemporal distribution of LST (Figures 2 (a)-(e)) confirms that lower temperatures dominate in the eastern part of Padang City. In comparison, higher temperatures are concentrated in the western urban area.
4.3 Implications for thermal comfort
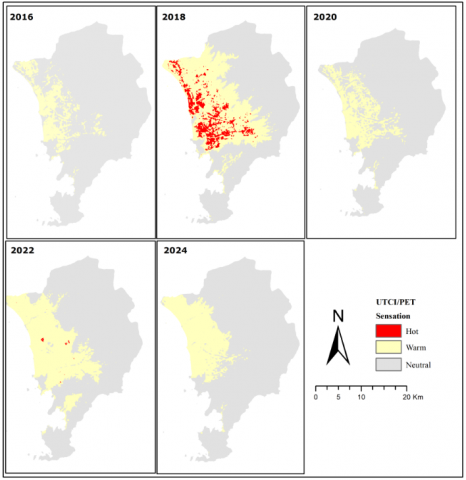
The thermal comfort experienced by the inhabitants of Padang City was assessed through the application of the Universal Thermal Climate Index (UTCI), serving as a metric for Thermal Sensation. The UTCI classifies thermal conditions based on temperature ranges, as shown in Table 2. Table 3 and Figure 5 below summarise the distribution of thermal comfort sensation in Padang City from 2016 to 2024, which reflects changes in thermal sensation at various observation times.
Figure 5. Thermal comfort dynamics
According to the data on the distribution of thermal comfort levels (Table 3) in Padang City, the majority of regions experienced conditions devoid of thermal stress (UTCI 9-26℃, Neutral sensation) during the entire observation period, with the highest pixel count recorded in March 2016 (675,016 pixels) and the lowest observed in January 2018 (451,332 pixels). Nonetheless, in January 2018, there was a notable escalation in Slight heat stress to Moderate heat stress conditions (UTCI 26-32℃, Slightly warm to Warm sensation) encompassing 268,820 pixels, alongside Strong heat stress (UTCI 32-36.77℃, Hot sensation) which accounted for 50,949 pixels. This condition reflects an increase in maximum temperature (36.77℃) due to the dry season and urbanisation in the western lowlands (high NDBI, contributing 66.73% of LST variation), which causes thermal discomfort, increases the risk of heat stress and has the potential to affect the health of the population. In May 2020, Hot conditions were not detected (maximum UTCI 31.47℃), corresponding to a decrease in maximum temperature (-2.73℃ from January 2018), potentially attributable to societal constraints imposed during the COVID-19 pandemic which led to a decline in urban engagements. In June 2024, the maximum UTCI dropped to 31.4℃ (Warm category, 159084 pixels), with the absence of Hot conditions, supported by a decrease in average temperature (22.92℃) and the influence of vegetation in the east (high NDVI, 45.64% variation in LST). The highlands in the east, with LST of 15-20℃ (UTCI 9-26℃, Neutral sensation), consistently provide comfortable thermal conditions. At the same time, the lowlands in the west are more susceptible to Slight to Strong heat stress, as seen in January 2018 and July 2022.
Table 3. Thermal comfort level 2016-2024 Padang City (in pixels 100 × 100 m)
|
Thermal Sensation |
UTCI (℃) (March 2016) |
Pixel Count (March 2016) |
UTCI (℃) (January 2018) |
Pixel Count (January 2018) |
UTCI (℃) (May 2020) |
Pixel Count (May 2020) |
|
Neutral |
9 - 26 |
675.016 |
9 - 26 |
451.332 |
9 - 26 |
641.017 |
|
Warm |
26 - 32 |
96.072 |
26 - 32 |
268.820 |
26 - 31,47 |
130.084 |
|
Hot |
32 - 32,16 |
13 |
32 – 36.77 |
50.949 |
|
|
|
Thermal sensation |
UTCI (℃) July 2022 |
Pixel Count July 2022 |
UTCI (℃) June 2024 |
Pixel Count June 2024 |
|
|
|
Neutral |
9 - 26 |
536.966 |
9 - 26 |
612.074 |
|
|
|
Warm |
26 - 32 |
233.355 |
26 – 31.4 |
159.084 |
|
|
|
Hot |
32 - 33, 14 |
780 |
|
|
|
|
The LST analysis in Padang City, West Sumatra, for 2016 to 2024 using Landsat 8 imagery revealed a significant influence of topography and land use on surface temperature. Forested highlands in the east (elevation 1000-1400 meters, NDVI 0.4-0.6) show low LST (15-20℃), providing comfortable thermal conditions with a Neutral sensation (UTCI 9-26℃), while urban lowlands in the west (elevation 0-200 meters, high NDBI) have higher LST (25-30℃), the data frequently falls within the parameters of Slight heat stress to Strong heat stress (UTCI 26-38℃, Slightly warm to Hot sensation), particularly noted in January 2018, which recorded a peak temperature of 36.77℃. The variables of elevation, NDBI, and NDVI accounted for 66.63%, 66.73%, and 45.64% of the observed variability in LST, respectively, thereby substantiating the influence of urbanized regions on temperature elevation and the mitigating effect of vegetation, with temperature fluctuations influenced by the dry season, urbanisation, and social restrictions during the COVID-19 pandemic. Temporal trends of temperature showed that the minimum temperature increased from 10.20℃ (March 2016) to 16.35℃ (June 2024), and the average temperature peaked at 25.84℃ (January 2018). It decreased to 22.92℃ (June 2024), and the maximum temperature fluctuated between 36.77℃ (January 2018) and 34.04℃ (May 2020). UTCI distribution indicates that most of Padang has no thermal stress condition. Still, the lowlands often experience Slight heat stress to Strong heat stress, increasing the risk of heat stress for residents considering that urban areas are located in these lowlands. For heat mitigation and improving thermal comfort, expansion of green space, use of high albedo building materials, and forest conservation in the highlands are recommended.
The Research Team appreciates and is most grateful to the Research Center for Rural and Urban Studies Universitas Negeri Padang and Institut Teknologi Padang for conducting this research.
[1] Huang, K., Li, X., Liu, X., Seto, K.C. (2019). Projecting global urban land expansion and heat island intensification through 2050. Environmental Research Letters, 14(11): 114037. https://doi.org/10.1088/1748-9326/ab4b71
[2] Yim, S.H.L., Wang, M., Gu, Y., Yang, Y., Dong, G., Li, Q. (2019). Effect of urbanisation on ozone and resultant health effects in China's Pearl River Delta region. Journal of Geophysical Research: Atmospheres, 124(21): 11568-11579. https://doi.org/10.1029/2019JD030562
[3] Memon, R.A., Leung, D.Y., Liu, C.H. (2009). An investigation of urban heat island intensity (UHII) as an indicator of urban heating. Atmospheric Research, 94(3): 491-500. https://doi.org/10.1016/j.atmosres.2009.07.006
[4] Buo, I., Sagris, V., Burdun, I., Uuemaa, E. (2021). Estimating the expansion of urban areas and urban heat islands (UHI) in Ghana: A case study. Natural Hazards, 105: 1299-1321. https://doi.org/10.1007/s11069-020-04355-4
[5] Liu, Y., Wang, Z. (2023). Research progress and hotspot analysis of urban heat island effects based on cite space analysis. Land, 12(6): 1154. https://doi.org/10.3390/land12061154
[6] Wijeyesekera, D., Mohamad Nazari, N.A., Lim, S., Masirin, M., Zainorabidin, A., Walsh, J. (2012). Investigation into the urban heat island effects from asphalt pavements. OIDA International Journal of Sustainable Development, 5(6): 97-118. https://ssrn.com/abstract=2191142.
[7] Vujovic, S., Haddad, B., Karaky, H., Sebaibi, N., Boutouil, M. (2021). Urban heat island: Causes, consequences, and mitigation measures emphasising reflective and permeable pavements. CivilEng, 2(2): 459-484. https://doi.org/10.3390/civileng2020026
[8] Ulfiasari, S., Yola, L. (2022). How does urban development contribute to Urban Heat Island: A decade increase of urban heat intensity in Jakarta Metropolitan Area. In the International Conference on Sustainable Design, Engineering, Management, and Sciences (ICSDEMS 2020), Bali, Indonesia. pp. 67-77. https://doi.org/10.1007/978-981-16-2329-5_9
[9] Halder, B., Bandyopadhyay, J., Khedher, K.M., Fai, C. M., Tangang, F., Yaseen, Z.M. (2022). The delineation of urban expansion influences urban heat islands and the natural environment using remote sensing and GIS-based methods in industrial areas. Environmental Science and Pollution Research, 29(48): 73147-73170. https://doi.org/10.1007/s11356-022-20821-x
[10] Fadhil, M., Hamoodi, M.N., Ziboon, A.R.T. (2023). Mitigating urban heat island effects in urban environments: Strategies and tools. IOP Conference Series: Earth and Environmental Science, 1129(1): 012025. https://doi.org/10.1088/1755-1315/1129/1/012025
[11] Ortiz, L., Gamarro, H., Gonzalez, J.E., McPhearson, T. (2022). Energy burden and air conditioning adoption in New York City under a warming climate. Sustainable Cities and Society, 76: 103465. https://doi.org/10.1016/j.scs.2021.103465
[12] Lai, W.Y., Tang, Q., Zhang, P. (2023). The effects of temperature on labor productivity. Annual Review of Resource Economics, 15: 213-232. https://doi.org/10.1146/annurev-resource-101222-125630
[13] Li, C.Z., Pan, Z. (2021). How do extremely high temperatures affect labour market performance? Evidence from rural China. Empirical Economics, 61: 2265-2291. https://doi.org/10.1007/S00181-020-01954-9
[14] García-León, D., Casanueva, A., Standardi, G., Burgstall, A., Flouris, A.D., Nybo, L. (2021). Current and projected regional economic impacts of heatwaves in Europe. Nature Communications, 12: 5807. https://doi.org/10.1038/S41467-021-26050-Z
[15] Zhao, M.Z., Lee, J.K.W., Kjellstrom, T., Cai, W.J. (2021). Assessment of the economic impact of heat-related labour productivity loss: A systematic review. Climatic Change, 167: 22. https://doi.org/10.1007/S10584-021-03160-7
[16] Zhang, Y.Q., Drew, Shindell, D.T. (2021). Costs from labour losses due to extreme heat in the USA attributable to climate change. Climatic Change, 164: 35. https://doi.org/10.1007/S10584-021-03014-2
[17] Roxon, J., Ulm, F.J., Pellenq, R.M. (2020). Urban heat island impacts state residential energy cost and CO2 emissions in the United States. Urban Climate, 31: 100546. https://doi.org/10.1016/j.uclim.2019.100546
[18] Aznarez, C., Kumar, S., Marquez-Torres, A., Pascual, U., Baró, F. (2024). Ecosystem service mismatches evidence inequalities in urban heat vulnerability. Science of the Total Environment, 922: 171215. https://doi.org/10.1016/j.scitotenv.2024.171215
[19] Sari, P.N., Gusti, A., Djafri, D. (2020). Public health center capacity in managing the risk of climate change. A case study in the City of Padang, Indonesia. Malaysian Journal of Medicine & Health Sciences, 16(4): 280-287.
[20] Eslamirad, N., Sepúlveda, A., De Luca, F., Sakari Lylykangas, K., Ben Yahia, S. (2023). Outdoor thermal comfort optimization in a cold climate to mitigate the level of Urban Heat Island in an urban area. Energies, 16(12): 4546. https://doi.org/10.3390/en16124546
[21] Khalili, S., Fayaz, L., Zolfaghari, S.A. (2022). Analyzing outdoor thermal comfort conditions in a university campus in hot-arid climate: A case study in Birjand, Iran. Urban Climate, 43: 101128. https://doi.org/10.1016/j.uclim.2022.101128
[22] Yi, P., Liu, L., Huang, Y., Zhang, M., Liu, H., Bedra, K. B. (2023). Study on the coupling relationship between thermal comfort and urban center spatial morphology in summer. Sustainability, 15(6): 5084. https://doi.org/10.3390/su15065084
[23] Boudier, K., Hoffmann, S. (2022). Analysis of the potential of decentralized heating and cooling systems to improve thermal comfort and reduce energy consumption through an adaptive building controller. Energies, 15(3): 1100. https://doi.org/10.3390/en15031100
[24] Li, Z.Y., Meng, Q.L., Wei, Y.A., Zhang, L., Sun, Z., Lei, Y., Yang, L., Yan, X.Y. (2022). Dynamic room temperature setpoints of air-conditioning demand response based on heat balance equations with thermal comfort model as constraint: On-site experiment and simulation. Journal of Building Engineering, 65: 105798. https://doi.org/10.1016/j.jobe.2022.105798
[25] Santos, M.M., Ferreira, A.V., Lanzinha, J.C.G. (2022). Passive solar systems for the promotion of thermal comfort in African countries: A review. Energies, 15(23): 9167. https://doi.org/10.3390/en15239167
[26] Ren, S., Han, M., Fang, J. (2022). Personal cooling garments: A review. Polymers, 14(24): 5522. https://doi.org/10.3390/polym14245522
[27] Altan, H., Ozarisoy, B. (2022). An analysis of the development of modular building design elements to improve thermal performance of a representative high rise residential estate in the coastline city of Famagusta, Cyprus. Sustainability, 14(7): 4065. https://doi.org/10.3390/su14074065
[28] Kaplan, G., Avdan, U., Avdan, Z.Y. (2018). Urban heat island analysis using the Landsat 8 satellite data: A case study in Skopje, Macedonia. Proceedings, 2(7): 358. https://doi.org/10.3390/ecrs-2-05171
[29] Ermida, S.L., DaCamara, C.C., Trigo, I.F., Pires, A.C., Ghent, D., Remedios, J. (2017). Modelling directional effects on remotely sensed land surface temperature. Remote Sensing of Environment, 190: 56-69. https://doi.org/10.1016/j.rse.2016.12.008
[30] Silva, T.J.V., Hirashima, S.Q.S. (2021). Predicting urban thermal comfort from calibrated UTCI assessment scale-A case study in Belo Horizonte city, southeastern Brazil. Urban Climate, 36: 100652. https://doi.org/10.1016/j.uclim.2020.100652
[31] Wang, B., Yi, Y.K. (2021). Developing an adapted UTCI (Universal Thermal Climate Index) for the elderly population in China’s severe cold climate region. Sustainable Cities and Society, 69: 102813. https://doi.org/10.1016/j.scs.2021.102813
[32] Pantavou, K., Lykoudis, S., Nikolopoulou, M., Tsiros, I. X. (2018). Thermal sensation and climate: A comparison of UTCI and PET thresholds in different climates. International journal of biometeorology, 62: 1695-1708. https://doi.org/10.1007/s00484-018-1569-4
[33] Tao, Z., Zhu, X., Xu, G., Zou, D., Li, G. (2023). A comparative analysis of outdoor thermal comfort indicators applied in China and other countries. Sustainability, 15(22): 16029. https://doi.org/10.3390/su152216029
[34] Zhang, D., Liu, C., Wu, J., Wang, H. (2024). A satellite-based approach for thermal comfort simulation: A case study in the GBA. Urban Climate, 53: 101776. https://doi.org/10.1016/j.uclim.2023.101776
[35] Budd, G.M. (2008). Wet-bulb globe temperature (WBGT)—Its history and its limitations. Journal of Science and Medicine in Sport, 11(1): 20-32. https://doi.org/10.1016/j.jsams.2007.07.003
[36] Beshir, M., Ramsey, J.D. (1988). Heat stress indices: A review paper. International Journal of Industrial Ergonomics, 3(2): 89-102. https://doi.org/10.1016/0169-8141(88)90012-1
[37] Matzarakis, A., Mayer, H., Iziomon, M.G. (1999). Applications of a universal thermal index: Physiological equivalent temperature. International Journal of Biometeorology, 43: 76-84. https://doi.org/10.1007/s004840050119
[38] Błażejczyk, K., Jendritzky, G., Bröde, P., Fiala, D., Havenith, G., Epstein, Y., Psikuta, A., Kampmann, B. (2013). An introduction to the universal thermal climate index (UTCI). Geographia Polonica, 86(1): 5-10. http://doi.org/10.7163/GPol.2013.1
[39] Jendritzky, G., De Dear, R., Havenith, G. (2012). UTCI—Why another thermal index? International Journal of Biometeorology, 56: 421-428. https://doi.org/10.1007/s00484-011-0513-7
[40] Bröde, P., Fiala, D., Błażejczyk, K., Holmér, I., Jendritzky, G., Kampmann, B., Tinz, B., Havenith, G. (2012). Deriving the operational procedure for the Universal Thermal Climate Index (UTCI). International Journal of Biometeorology, 56: 481-494. https://doi.org/10.1007/s00484-011-0454-1
[41] Siswanto, S., Nuryanto, D.E., Ferdiansyah, M.R., Prastiwi, A.D., Dewi, O.C., Gamal, A., Dimyati, M. (2023). Spatio-temporal characteristics of urban heat island of Jakarta Metropolitan. Remote Sensing Applications: Society and Environment, 32: 101062. https://doi.org/10.1016/j.rsase.2023.101062
[42] Nurwanda, A., Honjo, T. (2020). The prediction of city expansion and land surface temperature in Bogor City, Indonesia. Sustainable Cities and Society, 52: 101772. https://doi.org/10.1016/j.scs.2019.101772
[43] Wijayanto, A.K., Rushayati, S.B., Hermawan, R., Setiawan, Y., Prasetyo, L.B. (2020). Jakarta and Surabaya land surface temperature before and during the Covid-19 pandemic. Advances in Environmental Sciences, 12(3): 213-221.
[44] Kalogeropoulos, G., Dimoudi, A., Toumboulidis, P., Zoras, S. (2022). Urban heat island and thermal comfort assessment in a medium-sized Mediterranean city. Atmosphere, 13(7): 1102. https://doi.org/10.3390/atmos13071102
[45] Fajary, F.R., Lee, H.S., Kubota, T., Bhanage, V., Pradana, R.P., Nimiya, H., Putra, I.D.G.A. (2024). Comprehensive spatiotemporal evaluation of urban growth, surface urban heat island, and urban thermal conditions on Java Island of Indonesia and implications for urban planning. Heliyon, 10(13): e33708. https://doi.org/10.1016/j.heliyon.2024.e33708
[46] Agustiyara, A., Mutiarin, D., Nurmandi, A., Kasiwi, A.N., Ikhwali, M.F. (2025). Mapping urban green spaces in Indonesian cities using remote sensing analysis. Urban Science, 9(2): 23. https://doi.org/10.3390/urbansci9020023
[47] Kurniati, A.C., Nitivattananon, V. (2016). Factors influencing urban heat island in Surabaya, Indonesia. Sustainable Cities and Society, 27: 99-105. https://doi.org/10.1016/j.scs.2016.07.006
[48] Chakraborty, T.C., Lee, X., Ermida, S., Zhan, W. (2021). On the land emissivity assumption and Landsat-derived surface urban heat islands: A global analysis. Remote Sensing of Environment, 265: 112682. https://doi.org/10.1016/j.rse.2021.112682
[49] Guha, S., Govil, H., Dey, A., Gill, N. (2018). Analytical study of land surface temperature with NDVI and NDBI using Landsat 8 OLI and TIRS data in Florence and Naples city, Italy. European Journal of Remote Sensing, 51(1): 667-678. https://doi.org/10.1080/22797254.2018.1474494
[50] Zhou, W., Cao, F., Wang, G. (2019). Effects of spatial pattern of forest vegetation on urban cooling in a compact megacity. Forests, 10(3): 282. https://doi.org/10.3390/f10030282
[51] Parida, B.R., Bar, S., Kaskaoutis, D., Pandey, A.C., Polade, S.D., Goswami, S. (2021). Impact of COVID-19 induced lockdown on land surface temperature, aerosol, and urban heat in Europe and North America. Sustainable Cities and Society, 75: 103336. https://doi.org/10.1016/j.scs.2021.103336
[52] Yilmaz, S., Menteş, Y., Angin, S.N., Qaid, A. (2023). Impact of the COVID-19 outbreak on urban air, land surface temperature and air pollution in cold climate zones. Environmental Research, 237: 116887. https://doi.org/10.1016/j.envres.2023.116887