Md Munir Hayet Khan![]() | Saif Saad Mansoor
| Saif Saad Mansoor![]() | M. M. Yacoub
| M. M. Yacoub![]() | Alaa H. AbdUlameer
| Alaa H. AbdUlameer![]() | Salem M. A. Al-Ani
| Salem M. A. Al-Ani![]() | Ammar Hatem Kamel
| Ammar Hatem Kamel![]() | Jumaa Mohammed Ahmad
| Jumaa Mohammed Ahmad![]() | Haitham Abdulmohsin Afan
| Haitham Abdulmohsin Afan![]() | Faidhalrahman Khaleel*
| Faidhalrahman Khaleel*![]()
© 2025 The authors. This article is published by IIETA and is licensed under the CC BY 4.0 license (http://creativecommons.org/licenses/by/4.0/).
OPEN ACCESS
This research examines the effect of cement dust pollution on soil properties in Iraq's arid western region, particularly in the context of the area surrounding the Kubaisa Cement Plant. Spatial modeling methods were used by researchers to collect and analyze 32 soil samples at two different distances from the plant to assess chemical and physical changes to soil properties. Major findings showed higher concentrations of heavy metals like lead and lithium, higher alkalinity levels of soil, and higher particulate matter and CO₂ concentrations close to the source of the pollution. Even with present pollutants, ecological and environmental indices revealed low levels of contamination and ecological risk, on the whole. The findings indicate the continuing effects of industrial emissions on soil integrity and establish the necessity for focused measures to avert ecological and public health risks and help protect the environment.
heavy metal pollution, geoaccumulation index, arid soil degradation, sustainability, cement dust
Considering its correlation with human existence, the environmental consequences are significant in our everyday existence. Experts have closely observed industrial operations and their detrimental effects on the surroundings to tackle the issues arising from these activities and promote environmental consciousness in developing localized industrial projects.
The cement industry is an unavoidable polluter of the environment, as it emits polluting gases such as nitrogen oxides, sulfur oxides, carbon dioxide, and carbon monoxide, in addition to the particles carried with combustion gases in the form of small-diameter dust. These pollutants significantly pollute the surrounding surroundings where these factories use black oil, one of the heaviest fuel types due to its high sulfur content, as fuel [1].
Heavy elements are environmental pollutants that spread throughout the surroundings (air, water, and soil). These parts directly and indirectly contribute to human and animal health by influencing the growth of plants that sustain living organisms. Heavy element pollution is important because its products cannot decompose, unlike other chemical pollutants [2].
Kubaisa Cement Factory was chosen because it is located within the central unit in the northern Badia desert. It is also within the secondary area: the lower valley plains. The area's height ranges from 297.4 m above sea level. This area's lands consist of successive limestone and gypsum deposits in their layers [3].
These elements decompose due to various environmental influences, such as chemical reactions caused by heat, humidity, sunlight, or biological factors, which often reduce their toxicity. Heavy elements enter the natural cycle and move between living and non-living components of the environment, where their bioaccumulation occurs [4]. Its molecules in the air are subjected to a dilution process due to their vertical and horizontal spread. Still, their deposition on the ground leads to soil pollution and their concentration in it. Living organisms in the aquatic surroundings transfer them to other organisms in the water and on land, ultimately reaching their highest concentrations in animals at the top of the food chain, particularly humans [5]. The concentration of heavy elements in soil depends on several factors, some natural and others resulting from human activity, such as organic matter, pH, salinity, and others [6].
Cement dust impacts tree growth metrics (their height, number of leaves, weight, and area) as the dust settles on their leaves, blocking the pores and reducing gas exchange, forming a soft layer that leads to the fall of leaves and drying of plants, and also leads to the death of parts of the trees, gradually reducing the productivity of the plant and the soil [7, 8]. Researchers have discovered that cement dust has an impact on soil properties. Numerous studies in this field have demonstrated its effects on soil properties, such as soil electrical conductivity (EC) and pH. The study also found an increase in soil alkalinity, possibly accelerating plant weakening due to cement dust's nutrient imbalance [8, 9]. They also confirmed that when cement dust comes into contact with water, it forms a hard crust on the soil's surface. This changes the soil's chemical, physical, and biological properties because it makes it less permeable to water and better able to hold onto it. It also raises the pH level because calcium hydroxide and aluminum hydroxide are formed. Further elucidated is that incorporating cement dust into the soil diminishes its organic carbon content, thereby impeding the activity of soil microorganisms. Additionally, the nitrogen concentration in the contaminated soil differs from that of the reference soil [10]. AKokatnur and Saviramath [11] studied cement dust's impact on soil, discovering that it directly contributes to strong basicity in the soil's surface layer. The study revealed that the primary constituents of cement dust, S, Na, Al, Ca, K, and Mg, were more prevalent in the soil near the cement factory, particularly in the soil's surface layer.
1.1 Study area
Anbar province is located in the arid region of western Iraq with a 33.43 N latitude and 43.33 E longitude (Figure 1), with a 138.57 km total area. It is a critical area facing significant challenges because of climate change. The average altitude is 384.64 m, with extreme temperatures of 40℃ in the summer to 9℃ in the winter, with scarce precipitation, great contrasting temperatures between day and night, and relative humidity (19 - 82%). Winds are south-westerly and north-westerly, with a maximum speed of about 21 m/s. The rainy season is from September to May, with an average annual rainfall of about 115 mm. 49.5% occurs between November and January, 36.3% between February and April, and 14.8% between September and October. The average annual evaporation is about 3000 mm, which raises the dryness coefficient (evaporation/rain) by 25–35. As a result of climate change and lack of rain, estimates from some studies and international organizations indicate that the average number of dusty days will reach 300 days/year.
Figure 1. The location of the study area
International reports indicate that Iraq is the fifth most affected country by climate change, which is dramatically affecting the environment. Concentrations of pollutants, especially those related to air pollution, have increased significantly. Cement factories are among the primary sources of pollution in the governorate, such as the Kubaisa Cement Factory, located approximately 70 km from Ramadi, the center of Anbar Governorate (Figure 1).
1.2 Heavy metals
Heavy metals are among the most dangerous environmental pollutants, as their continued emission leads to their increasing accumulation in the soil. Some elements, such as iron and copper, are essential for human health, while others are toxic to living organisms [12]. Heavy metals are characterized by their high specific gravity and include elements with a relatively high density, atomic number, or atomic mass, such as transition elements, lanthanides, and actinides. The ecosystem naturally contains these elements, but their concentrations vary greatly, and their recent increase in levels has resulted in industrial pollution and industrial wastewater [13]. Metals are commonly associated with biological compounds containing oxygen, sulfur, and nitrogen, which can disrupt specific enzyme systems. This is particularly true for enzymes directly or indirectly involved in the production of ATP. In acute poisoning, large excesses of metal ions can disrupt membrane and mitochondrial function and generate free radicals. In most cases, this results in general weakness and malaise [14].
Air pollution sources are divided according to their type into natural sources and sources from human activity. It is sometimes difficult to separate between these two sources, as what is emitted by human activity in one area may be supported by a natural source such as wind in another location, making it difficult to determine the origin of the source. In industrialized countries, factories emit many types of air pollutants. The type varies according to the industry; some emit harmful gases, while others emit dust containing solid pollutants [15]. Both the permitted [15-19] local determinants (Iraq 2012) and the permitted local determinants (NAAQS) have been explained as shown in Table 1.
Table 1. Some permissible limits for some pollutants
|
Air Pollutants |
Allowed Local Parameters (Iraq 2012) |
Locally Allowed Queuing Specifiers (NAAQS) |
|
Carbon monoxide (CO) |
ppm / hour 35 ppm/24-hour 9 |
ppm/ hour 9 ug/m3/ hour 100 |
|
Carbon dioxide (CO2) |
- |
- |
|
Sulfur dioxide (SO2) |
ppm/24-hour 0.01 ppm/ hour 0.002 |
ppm/ hour 0.01 ug/m3/24 hour 0.03 |
|
Ozone (O3) |
ppm/ hour 0.12 |
ppm 0.12 / hour |
|
Hydrogen sulfide (H2) |
ppm/ hour 5 |
ppm/ hour 5 |
|
Nitrogen dioxide (NO2) |
0.1 ppm/ year ppm /24 hour 0.05 |
0.11 ppm/year ppm/24 hour 0.03 |
|
Total suspended minutes (T.S.P) |
350 ug/m3/ 24 hour 150 ug/m3/ year |
150 ug/m3/ 24 hour 60 - 90 ug/m3/year |
|
Lead Pb |
0.5 ug/m3/year |
2 ug/m3/ 24 hour 1.5 ug/m3/ 3 month |
Soil pollution is the destruction of the soil's surface layer due to the deposition of complex chemical compounds or reactive synthetic materials. This leads to changes in the natural properties of environmental elements. Soil retains lead as hydrated oxides or organic complexes, with mobility determined by organic content and pH level. As the lead resistance period increases, its biological availability decreases in humans and exposed organisms [19]. Heavy metal contamination primarily impacts soil through pedogenetic processes, where parent materials weather at low levels that are seldom harmful. The buildup of heavy metals in soil layers is typically driven by human activities that disturb and hasten the natural geochemical cycle [20]. In the last three decades, the soil’s buildup of these harmful substances (heavy metals) has escalated significantly, threatening both the ecosystem and human health. Pollution from heavy metals has seriously affected people, impacting the environment in multiple ways and leading to industrial unrest in several nations. Azher et al. [2] have reviewed several studies, which evaluate and analyze the numerous approaches for preparing heavy metal-free soil by adopting different soil remediation methods.
Franzaring et al. [21] stated that the critical limits for lead (Pb) in agricultural soils of some countries range from 50–300 ppm, while background concentrations of lithium in soil range from less than 1 to 200 mg/kg [22, 23], with higher concentrations in arid and saline soils [24]. Lithium generally enters the soil solution primarily through weathering sedimentary minerals [22, 25], and surface soils typically contain less lithium than the underlying layers [26]. The clay fraction of the soil contains higher concentrations of lithium than the organic soil fraction [27], with lithium found in biconcave cavities within clay minerals [28].
1.3 Research problem
The vicinity of the Kubaisa cement factory in Anbar Governorate faces significant environmental challenges resulting from increased soil pollution, which is directly threatening the surroundings and public health. This pollution requires a comprehensive study to determine its scope and different types, in addition to analyzing the environmental characteristics of the affected soil. The present study aims to use spatial modeling to assess the distribution and characteristics of pollution in the soil surrounding the factory to provide accurate data that helps develop effective strategies to reduce negative environmental impacts and improve soil quality in the region. Research has proven that cement dust impacts the soil's electrical conductivity (EC) and pH levels.
1.4 Study objectives
The study's objectives are as follows:
2.1 Data collection
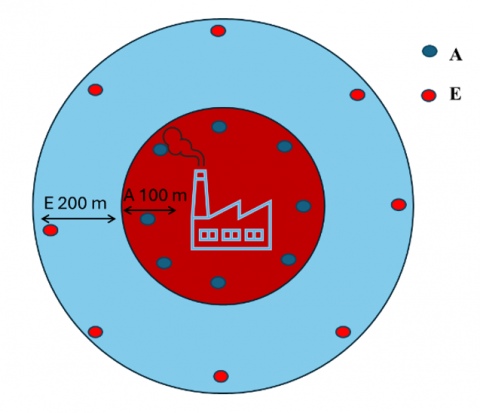
Soil samples were taken from the vicinity of the present study's Kubaisa cement factory. After obtaining the laboratory's location from the coordinates, a preliminary site survey was conducted to determine the changes in the area. A field visit was conducted to the Kubaisa Cement Factory, and a soil sample was taken from 8 sites and two complete circular perimeters (Figure 2), which were coded (A and E) from a distance of 100 meters and 200 meters and on the perimeter of the Kubaisa Cement Factory, with three replicates. Thus, the number of samples is 32 samples. A soil sample was taken from two different depths, 0–15 cm and 15–30 cm.
Several tools were used to take samples from the soil and portable air pollutant measuring devices, including a coordinate finder (GPS), auger tool, plastic bags, CO2 air pollution meter, and H2S and particulate air pollution meter. Furthermore, two types of sites were selected for the model as follows:
Figure 2. The locations of the selected models for the study
2.2 Laboratory work
After the data collection process, the samples were taken to a private laboratory for the necessary tests. The laboratory work was conducted at the University of Anbar in the College of Applied Sciences-Heet. First, soil samples were dried using an electric oven (The manufacturing company is Memmert) at a temperature of (105) Celsius. Then, the soil extraction process was carried out at an extraction ratio of 1:1 (water: soil), i.e., 100 ml of water was taken for every 100 g of soil for all 32 samples, and then these water extracts were kept in opaque bottles to conduct some measurements such as PH, electrical conductivity, heavy metals (calcium, potassium, and lithium), and finally the soil digestion, which were carried out utilizing the following steps:
2.3 Environmental index
2.3.1 Geochemical Index ( Igeo )
This index is widely used to assess the degree of pollution by comparing heavy metals obtained with the background levels initially used with the bottom sediments. It can also be applied to determine soil pollution, as shown in Eq. (1).
$I_{geo}=\log \frac{\left(\frac{\mathrm{C}_{\mathrm{n}}}{1.5 \mathrm{~B}_{\mathrm{n}}}\right)}{0.301}$ (1)
where, Cn represents the concentration of the element in the enriched samples. Bn represents the concentration of the background soil component or the element's initial value. The constant is 1.5 to reduce the effect of possible differences in background values that can be attributed to rock variations.
This method evaluates the degree of metal contamination in terms of seven degrees, based on the increasing values of the index, as shown in Table 2.
Table 2. Values and degree of geological accumulation coefficient
|
Igeo |
Degree |
Pollution Level |
|
≤ 0 |
0 |
Unpolluted |
|
0-1 |
1 |
Slightly polluted |
|
1-2 |
2 |
Moderately polluted |
|
2-3 |
3 |
Moderately severely polluted |
|
3-4 |
4 |
Severely polluted |
|
4-5 |
5 |
Severely extremely polluted |
|
> 5 |
6 |
Extremely polluted |
2.3.2 Contamination factor (CF)
The level of sediment contamination with metals is expressed in terms of the contamination factor (CF), and it is calculated as in Eq. (2).
$C_F=\frac{C_{\ {metal }}}{C_{\ {background }}}$ (2)
Cmetal is the concentration of a particular metal in river sediments. Cbackground is the background metal concentration. The CF values that describe the pollution are shown in Table 3.
Table 3. Values and degree of contamination factor
|
Degree |
Pollution Level |
|
< 1 |
Low contamination |
|
1≤ CF < 3 |
Moderate contamination |
|
3 ≤ CF < 6 |
Considerable contamination |
|
> 6 |
Very high contamination |
2.3.3 Potential Ecological Risk Index ($\mathrm{E}_{\mathrm{r}}^{\mathrm{i}}$)
The Potential Ecological Risk Index ($\mathrm{E}_{\mathrm{r}}^{\mathrm{i}}$) was calculated using Eq. (3), as follows:
$E_r^i=T_r^i \times C_f^i$ (3)
where, Ti is the toxic response factor for a given heavy metal, $\mathrm{C}_{\mathrm{f}}^{\mathrm{i}}$ is the contamination factor. $\mathrm{T}_{\mathrm{r}}^{\mathrm{i}}$ is the Toxic response factor proposed by Hakanson, Pb, Cu, Ni, Mn, Zn, As, and Co have toxic response factors of 5, 5, 5, 1, 1, 10, and 5, respectively. The potential ecological risk ($\mathrm{E}_{\mathrm{r}}^{\mathrm{i}}$) of heavy metals is classified into five levels, which are shown in Table 4.
Table 4. The levels of $\mathrm{E}_{\mathrm{r}}^{\mathrm{i}}$
|
Degree |
Pollution Level |
|
< 40 |
Low |
|
40 - 80 |
Moderate |
|
80 - 160 |
Moderate to high |
|
160 - 320 |
High |
|
≥ 320 |
Very high |
2.4 Statistical analysis
After obtaining the data, they were statistically analyzed according to the randomized complete block design (RCBD). The means were compared using the least significant difference (L.S.D) test at a significance level of 0.05 using the Gestates program.
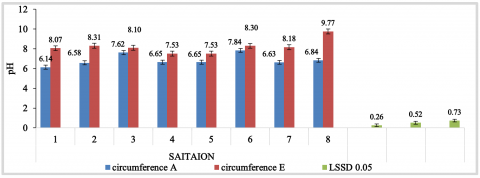
3.1 pH
Figure 3 shows how the surroundings and location affect the pH concentration of soil samples. The statistical analysis showed significant differences, as the highest pH value was 8.3 in the second surroundings (E), while the lowest was 6.9 in the first surroundings (A). The decrease in pH is attributed to the factory being out of operation for at least five years, which reduced the deposition of alkaline calcium carbonate, one of the components of cement dust in the soil. This dust contains many components, such as calcium, aluminum, and some oxides, that can raise its value. These results align with studies (38, 39) on the subject.
The statistical analysis results showed significant differences in the effect of location, as the highest value reached 8.3 at location 8 and the lowest value reached 7.1 at location 4 (Table A1, (Appendix A)).
Figure 3. The effect of the surroundings and location on the pH concentration
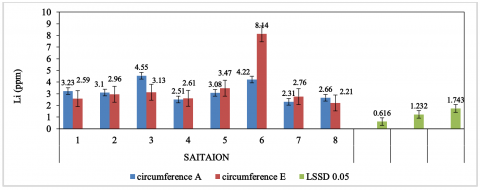
3.2 Lithium (Li)
Statistical analysis revealed significant differences in the lithium concentration in the soil. The highest lithium concentration in surroundings E was 2.008 mg/L; in surroundings A, the lowest was 1.708 mg/L, as shown in Figure 4. The statistical analysis revealed significant differences regarding the effect of location on lithium concentration, with the highest value being 2.375 mg/L and the lowest value being 0.560 mg/L in site 5. Since this site is directly in front of the chimney, it may be more susceptible to pollutant deposition (Table A2, (Appendix A)).
The statistical analysis results showed significant differences regarding the effect of location and surroundings on lithium concentration. The highest value was 2.250 mg/L, while the lowest was 0.455 mg/L.
Figure 4. The effect of the surroundings and location on the lithium concentration
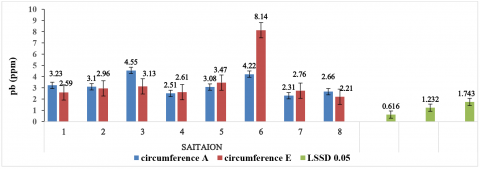
3.3 Lead (Pb)
Figure 5 shows the effect of dust and oxides produced by the Kubaisa Cement Plant on the lead concentration in the soil. The statistical analysis revealed significant differences, with the highest value reaching 3.48 mg/L in the E surroundings and the lowest value reaching 3.21 mg/L in the A environment. This is likely due to fuel burning and airborne transmission to distant areas. On the other hand, lead is less mobile. Lead in the soil is mainly associated with clay minerals, manganese oxides, iron and aluminum hydroxides, and organic matter. Adding phosphate to soil contaminated with lead results in a decrease in the soluble part of it, a significant reduction in the part associated with oxides and carbonates, and an increase in the part related to organic matter. In soils severely contaminated with lead, adding phosphate leads to the formation of lead pyromorphite metal Pbs (POCI). The solubility of lead in the soil can be significantly reduced when lime is added.
Figure 5. The effect of the surroundings and location on the lead concentration
The high pH of lime-treated soil may precipitate lead in the form of hydroxide, phosphate, or carbonate and encourage the formation of organic lead complexes characterized by their stability. Increasing the soil's acidity may improve the lead's ability to move. Still, this process is usually slower than its accumulation in layers rich in organic matter. The statistical analysis results (Table A3, (Appendix A)) showed significant differences in the site's effect on the lead concentration, as the highest value reached 6.18 mg/L at the sixth site, and the lowest value was 2.31 mg/L at the seventh site. The statistical analysis showed significant differences in lead concentration between the site and the environment, with the highest value reaching 8.14 mg/L and the lowest value being 0.455 mg/L.
When comparing the confidence intervals for the values of the first circumference A, which ranged between (2.21 - 3.13) mg/L, and circumference E, which ranged between (2.49 - 3.78) mg/L, with the permissible limits for lead in Table 1, it becomes clear that the confidence intervals were higher than the permissible limits, which are 0.5 ug/m3/year according to Allowed local parameters (Iraq 2012), while they reached 2 ug/m3/24 hour, 1.5 ug/m3/3 month, which reflects the adverse effect of the soil lead content.
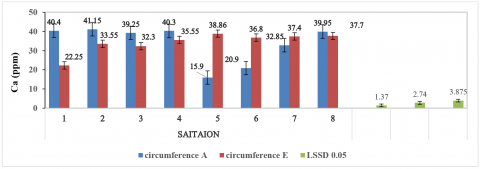
3.4 Calcium (Ca)
Figure 6 depicts the calcium content in the soil. The statistical analysis results indicated that the surroundings had no significant effect, and no significant differences appeared. The maximum calcium concentration recorded was 34.30 mg/L in surroundings E. In contrast, the minimum was 33.84 mg/L in surroundings A. Dust contains several components, including calcium, aluminum, and some oxides, which may elevate the calcium concentration.
The statistical analysis showed significant differences in the effect of location on calcium concentration. The highest calcium concentration was 38.83 mg/L at site 8, while the lowest was 27.38 mg/L at site 5. The statistical analysis results also showed significant differences regarding the effect of location and surroundings on calcium concentration. At site 2, the highest calcium concentration was 41.15 mg/L; at site 5, the lowest was 15.90 mg/L. Table A4 (Appendix A) shows that site five is located behind the chimney, away from the influence of pollutants, while site two is situated towards the chimney and the east wind.
Figure 6. The effect of the surroundings and location on the calcium concentrations
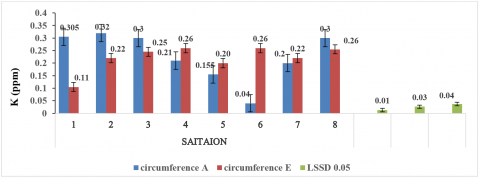
3.5 Potassium (K)
Figure 7 shows the concentration of potassium in the soil. The statistical analysis results showed that the surroundings have a significant effect, as the highest value reached 0.2287 mg/L at surroundings E, and the lowest value was 0.2206 at surroundings A.
Figure 7. The effect of the surroundings and location on the potassium concentrations
The statistical analysis results showed significant differences in the effect of location on calcium concentration, with the highest value reaching 0.2775 mg/L at site eight and the lowest value being 0.1500 at site 6. The statistical analysis results showed significant differences in the effect of the location and surroundings on calcium concentration. The highest value reached 0.3200 mg/L at site two and surroundings A, and the lowest was 0.0400 mg/L at site 6. This is because site 2 faces the chimney and the easterly wind, whereas site 5 faces the back of the chimney and is shielded from the effects of pollutants, as illustrated in Table A5 (Appendix A).
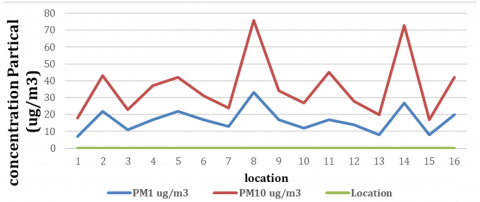
3.6 Particle diameters
Figure 8 and Table 5 show the relationship between the number of respiratory particulates PM10 (diameters more significant than 10) and particulates with diameters less than -micron PM1. The percentage of fine particles smaller than 1-micron increases significantly as one move away from the plant. This is because fine aerobic particulates settle more slowly.
Table 5. The effect of location and surroundings on the concentration of suspended particles of sizes PM1 and PM10 µg/m3
|
E8 |
A8 |
E7 |
A7 |
E6 |
A6 |
E5 |
A5 |
E4 |
A4 |
E3 |
A3 |
E2 |
A2 |
E1 |
A1 |
Location |
|
42 |
76 |
17 |
24 |
73 |
31 |
20 |
42 |
28 |
37 |
45 |
23 |
27 |
43 |
34 |
18 |
PM10 µg/m3 |
|
20 |
33 |
8 |
13 |
27 |
17 |
8 |
22 |
14 |
17 |
7 |
11 |
121 |
22 |
17 |
7 |
PM1 µg/m3 |
Figure 8. The effect of location and surroundings on the concentration of suspended particles of PM1 and PM10 µg/m3 sizes
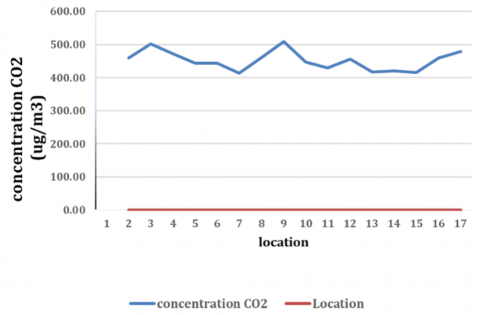
3.7 CO2 concentration
Figure 9 and Table 6 show the relationship between the surroundings and carbon dioxide gas concentration. The results showed an increase in carbon dioxide gas concentration at the first site, surroundings A, site 10, and surroundings 9.
Table 6. The effect of location and surroundings on CO2 concentration µg/m3
|
E8 |
A8 |
E7 |
A7 |
E6 |
A6 |
E5 |
A5 |
E4 |
A4 |
E3 |
A3 |
E2 |
A2 |
E1 |
A1 |
Location |
|
480 |
510 |
460 |
462 |
415 |
413 |
421 |
443 |
418 |
443 |
457 |
473 |
430 |
502 |
447 |
459 |
Concentration CO2 µg/m3 |
Figure 9. The effect of location and surroundings on CO2 concentration µg/m3
3.8 Geochemical Index (Igeo)
Table 7 shows that the pollution load index (Igeo) for all sites within the two perimeters is less than zero. This could be attributed to elevated calcium concentrations, or it aligns with the findings presented in Table 6, suggesting that pollutants from human activity, such as industrial activities or vehicles, are affecting the soil. The anthropogenic source here contributed to soil pollution due to emitted gases and materials resulting from fuel combustion in the power plant, vehicle pollutants, and any other human activity that may be present in the study area. This indicates that the terrestrial source's contribution to supplying the soil with heavy elements was small. Further analysis is shown in Table A6 (Appendix A).
Table 7. The effect of location and surroundings on the Geochemical Index (Igeo)
|
Surroundings |
Location |
Average |
|||||||||
|
1 |
2 |
3 |
4 |
5 |
6 |
7 |
8 |
||||
|
A |
-3.226 |
-3.293 |
-2.816 |
-3.580 |
-3.324 |
2.840 |
3.725 |
-3.512 |
-3.290 |
||
|
E |
-3.539 |
-3.373 |
3.278 |
-3.527 |
-3.117 |
1.896 |
3.443 |
-3.764 |
-3.242 |
||
|
Average |
-3.383 |
-3.333 |
3.047 |
-3.554 |
-3.220 |
2.368 |
-3.584 |
-3.638 |
-3.266 |
||
|
|
Surroundings |
Location |
Location & Surroundings |
||||||||
|
LSD0.05 |
0.2331 |
0.4662 |
0.6593 |
||||||||
3.9 Contamination Factor (CF)
Table 8 displays the values of (CF), and the results demonstrate that the values were less than 1, signifying a low pollution level. This is attributed to the impact of humans and their activities, precisely the anthropogenic effect (Anthropogenic), which stems from fuel combustion from furnaces and power plants and pollutants from small industrial workshops and car plumbing workshops dispersed on public roads. Additionally, vehicle fuel combustion and the gases released from their exhausts in soil samples near traffic roads contain high lead levels. The increase in traffic exacerbates this pollution, leading to higher pollution levels in the air and soil. Further analysis is shown in Table A7 (Appendix A).
Table 8. The effect of location and surroundings on the contamination factor
|
Surroundings |
Location |
Average |
|||||||||
|
1 |
2 |
3 |
4 |
5 |
6 |
7 |
8 |
||||
|
A |
0.1614 |
0.1550 |
0.2274 |
0.1256 |
0.1539 |
0.2111 |
0.1154 |
0.1332 |
0.1604 |
||
|
E |
0.1293 |
0.1479 |
0.1562 |
0.1306 |
0.1736 |
0.4070 |
0.1380 |
0.1104 |
0.1741 |
||
|
Average |
0.1453 |
0.1515 |
0.1918 |
0.1281 |
0.1638 |
0.3091 |
0.1267 |
0.1218 |
0.1673 |
||
|
|
Surroundings |
Location |
Location & Surroundings |
||||||||
|
LSD0.05 |
0.03080 |
0.06161 |
0.08713 |
||||||||
3.10 Potential Ecological Risk Index ($\mathbf{E}_{\mathbf{r}}^{\mathbf{i}}$)
Table 9 shows the results of the statistical analysis of the potential environmental hazard index ($\mathbf{E}_{\mathbf{r}}^{\mathbf{i}}$) values for heavy metals. The results demonstrate the influence of location and the surrounding environment on the potential environmental hazard values ($\mathbf{E}_{\mathbf{r}}^{\mathbf{i}}$). The heavy element lead was classified as a low potential environmental hazard, and no data exceeded this level. On the other hand, the results show that dust particles surrounding the cement plant generally contain significant amounts of lead and that these values are higher than the background values. The potential environmental hazard index and the geological accumulation index show that lead in sediments are the primary sources of environmental hazards. At the same time, it is not difficult to observe that the environment surrounding the cement plant has been severely polluted due to mining activities. This soil contamination seriously threatens the safety of workers surrounding the plant, causing all kinds of health and safety problems. These results are consistent with what was reported by Liu et al. [28] when our results are compared with the potential environmental hazard values for heavy metals in reclaimed soil by Cheng et al. [30], which are shown in Table 10. We find that the risk values for lead fall within the range of 0–27, indicating that lead represents an environmental hazard at the ecological level. Further analysis is shown in Table A8 (Appendix A).
Table 9. The effect of location and surroundings on the contamination factor
|
Surroundings |
Location |
Average |
|||||||||
|
1 |
2 |
3 |
4 |
5 |
6 |
7 |
8 |
||||
|
A |
0.807 |
0.775 |
1.137 |
0.628 |
0.770 |
1.055 |
0.577 |
0.666 |
0.802 |
||
|
E |
0.647 |
0.740 |
0.781 |
0.653 |
0.868 |
2.035 |
0.690 |
0.552 |
0.871 |
||
|
Location |
0.727 |
0.758 |
0.959 |
0.640 |
0.819 |
1.545 |
0.727 |
0.609 |
0.836 |
||
|
|
Surroundings |
Location |
Location & Surroundings |
||||||||
|
LSD0.05 |
0.1540 |
0.3080 |
0.4356 |
||||||||
Table 10. Values of the Potential Ecological Risk Index
|
Element |
Degree |
Average |
|
Lead |
0.00–27.43 |
6.21$\mp$3.21 |
Limited measurements conducted in surroundings A, 50 meters from the laboratory, and surroundings E, 200 meters from the laboratory, showed that the pH, lead, lithium, and respiratory dust particles were well above the permissible limits. The results indicate that industrial activity surrounding the laboratory has contributed significantly to increased levels of air and soil pollution, which may negatively affect public health and the environment. Besides harmful gas emissions, factories also contributed to the buildup of heavy metals like lead in the surrounding soil, increasing the risk of soil quality degradation and its unsuitability for agricultural use. Although some sites showed high levels of pollutants, more measurements and studies are needed on a larger scale to determine the long-term impact of pollution and its relationship to industrial development. Unregulated industrial development, especially in the absence of appropriate environmental measures, contributes to environmental degradation and increases the percentage of pollutants that threaten the ecological balance in the region. The impact of human activities on pollution is still more significant than the contribution of natural sources, indicating the need to take practical steps to reduce these harmful activities.
In the light of these findings. This study recommends the following:
Develop emergency plans to monitor and deal with pollution in pollutant leakage or environmental accidents.
Table A1. Potential of Hydrogen (PH)
|
P-value |
F-statistic |
Sum of Squares |
Mean Square |
Degrees of Freedom |
Source of Variation |
|
|
0.03 |
0.0032 |
0.0032 |
1 |
rep stratum |
|
<.001 |
136.89 |
16.0744 |
16.0744 |
1 |
steram |
|
<.001 |
7.23 |
0.8486 |
5.9403 |
7 |
Sation |
|
0.002 |
5.78 |
0.6788 |
4.7517 |
7 |
steram.sation |
|
|
|
0.1174 |
1.7614 |
15 |
Residual |
|
|
|
|
28.5310 |
31 |
Total |
Table A2. Lithium (Li)
|
P-value |
F-statistic |
Sum of Squares |
Mean Square |
Degrees of Freedom |
Source of Variation |
|
|
15.82 |
0.23978 |
0.23978 |
1 |
rep stratum |
|
<.001 |
47.70 |
0.72300 |
0.72300 |
1 |
steram |
|
<.001 |
96.93 |
1.46934 |
10.28537 |
7 |
Sation |
|
<.001 |
42.20 |
0.63972 |
4.47802 |
7 |
steram.sation |
|
|
|
0.01516 |
0.22737 |
15 |
Residual |
|
|
|
|
15.95355 |
31 |
Total |
Table A3. Lead (Pb)
|
P-value |
F-statistic |
Sum of Squares |
Mean Square |
Degrees of Freedom |
Source of Variation |
|
|
3.12 |
2.0859 |
2.0859 |
1 |
rep stratum |
|
0.356 |
0.91 |
0.6072 |
0.6072 |
1 |
steram |
|
<.001 |
9.13 |
6.1031 |
42.7218 |
7 |
Sation |
|
0.014 |
3.80 |
2.5415 |
17.7903 |
7 |
steram.sation |
|
|
|
0.6684 |
10.0257 |
15 |
Residual |
|
|
|
|
73.2309 |
31 |
Total |
Table A4. Calcium (Ca)
|
P-value |
F-statistic |
Sum of Squares |
Mean Square |
Degrees of Freedom |
Source of Variation |
|
|
6.70 |
22.145 |
22.145 |
1 |
rep stratum |
|
0.482 |
0.52 |
1.721 |
1.721 |
1 |
steram |
|
<.001 |
22.79 |
75.308 |
527.156 |
7 |
Sation |
|
<.001 |
54.56 |
180.295 |
1262.064 |
7 |
steram.sation |
|
|
|
3.304 |
49.566 |
15 |
Residual |
|
|
|
|
1862.650 |
31 |
Total |
Table A5. Potassium (K)
|
P-value |
F-statistic |
Sum of Squares |
Mean Square |
Degrees of Freedom |
Source of Variation |
|
|
1.75 |
0.0005281 |
0.0005281 |
1 |
rep stratum |
|
0.205 |
1.75 |
0.0005281 |
0.0005281 |
1 |
steram |
|
<.001 |
29.65 |
0.0089388 |
0.0625719 |
7 |
Sation |
|
<.001 |
51.11 |
0.0154067 |
0.1078469 |
7 |
steram.sation |
|
|
|
0.0003015 |
0.0045219 |
15 |
Residual |
|
|
|
|
0.1759969 |
31 |
Total |
Table A6. Geochemical index (Igeo)
|
P-value |
F-statistic |
Sum of Squares |
Mean Square |
Degrees of Freedom |
Source of Variation |
|
|
2.59 |
0.24826 |
0.24826 |
1 |
rep stratum |
|
0.671 |
0.19 |
0.01793 |
0.01793 |
1 |
steram |
|
<.001 |
7.15 |
0.68415 |
4.78908 |
7 |
Sation |
|
0.114 |
2.06 |
0.19700 |
1.37899 |
7 |
steram.sation |
|
|
|
0.09568 |
1.43526 |
15 |
Residual |
|
|
|
|
7.86953 |
31 |
Total |
Table A7. Contamination factor (CF)
|
P-value |
F-statistic |
Sum of Squares |
Mean Square |
Degrees of Freedom |
Source of Variation |
|
|
3.12 |
0.005215 |
0.005215 |
1 |
rep stratum |
|
0.356 |
0.91 |
0.001518 |
0.001518 |
1 |
stream |
|
<.001 |
9.13 |
0.015258 |
0.106805 |
7 |
Sation |
|
0.014 |
3.80 |
0.006354 |
0.044476 |
7 |
Stream station |
|
|
|
0.001671 |
0.025064 |
15 |
Residual |
|
|
|
|
0.183077 |
31 |
Total |
Table A8. Potential ecological risk ($\mathrm{E}_{\mathrm{r}}^{\mathrm{i}}$)
|
P-value |
F-statistic |
Sum of Squares |
Mean Square |
Degrees of Freedom |
Source of Variation |
|
|
3.12 |
0.13037 |
0.13037 |
1 |
rep stratum |
|
0.356 |
0.91 |
0.03795 |
0.03795 |
1 |
stream |
|
<.001 |
9.13 |
0.38145 |
2.67012 |
7 |
Sation |
|
0.014 |
3.80 |
0.15884 |
1.11190 |
7 |
Stream station |
|
|
|
0.04177 |
0.62660 |
15 |
Residual |
|
|
|
|
4.57693 |
31 |
Total |
[1] Venkata Sudhakar, C., Umamaheswara Reddy, G. (2023). Impacts of cement industry air pollutants on the environment and satellite data applications for air quality monitoring and management. Environmental Monitoring and Assessment, 195(840): 840. https://doi.org/10.1007/s10661-023-11408-1
[2] Azhar, U., Ahmad, H., Shafqat, H., Babar, M. (2022). Remediation techniques for elimination of heavy metal pollutants from soil: A review. Environmental Research, 214: 113918. https://doi.org/10.1016/j.envres.2022.113918
[3] Craig, N.L., Roberts, J.W. (1980). E. coli recA protein-directed cleavage of phage λ repressor requires polynucleotide. Nature, 283(5742): 26-30. https://doi.org/10.1038/283026a0
[4] Gartland, K.P., Bonner, F.W., Timbrell, J.A., Nicholson, J.K. (1989). Biochemical characterisation of para-aminophenol-induced nephrotoxic lesions in the F344 rat. Archives of Toxicology, 63(2): 97-106. https://doi.org/10.1007/BF00316430
[5] Xia, X., Yang, Z., Cui, Y., Li, Y., Hou, Q., Yu, T. (2014). Soil heavy metal concentrations and their typical input and output fluxes on the southern Song-nen Plain, Heilongjiang Province, China. Journal of Geochemical Exploration, 139: 85-96. https://doi.org/10.1016/j.gexplo.2013.06.008
[6] Meslmani, Y., Al-Oudat, M. (2004). Dust full study in the surrounding area of a cement factory and determination of the major elements of the dust fall using neutron activation analysis (NAA). Internal report.
[7] Agbede, O.T., Taiwo, A.M., Adeofun, C.O., Adetunji, M.T. (2024). Assessing the pollution effect of cement dust emission on the soil quality around Ewekoro cement factory, southwestern Nigeria. Environmental Forensics, 25(4): 228-238. https://doi.org/10.1080/15275922.2022.2125120
[8] Mlitan, A.B. (2023). Cement dust pollution and environment. Toxicology and Human Health: Environmental Exposures and Biomarkers, 55-74. https://doi.org/10.1007/978-981-99-2193-5_3
[9] Singh, S.N., Rao, D.N. (1980). Growth of wheat plants exposed to cement dust pollution. Water, Air, and Soil Pollution, 14(1): 241-249. https://doi.org/10.1007/BF00291839
[10] Adnan, M., Xiao, B., Ali, M.U., Xiao, P. (2024). Heavy metals pollution from smelting activities: A threat to soil and groundwater. Ecotoxicology and Environmental Safety, 274: 116189. https://doi.org/10.1016/j.ecoenv.2024.116189
[11] AKokatnur, S., Saviramath, V.B. (2019). Impact of cement dust on physico-chemical properties of soils around a cement factory in Bagalkot, Karnataka, India. Journal of Geography, Environment and Earth Science International, 20(2): 1-12. https://doi.org/10.9734/JGEESI/2019/v20i230103
[12] Peng, J.Y., Zhang, S., Han, Y., Bate, B. (2022). Soil heavy metal pollution of industrial legacies in China and health risk assessment. Science of the Total Environment, 816: 151632. https://doi.org/10.1016/j.scitotenv.2021.151632
[13] Sun, Q., Li, Y., Shi, L., Hussain, R. (2022). Heavy metals induced mitochondrial dysfunction in animals: Molecular mechanism of toxicity. Toxicology, 469: 153136. https://doi.org/10.1016/j.tox.2022.153136
[14] Al-Ahmady, K.K., Obeed, H.M. (2015). Assessment of air particulate pollution in New Badoosh Cement Factory/Iraq. Al-Rafidain Engineering Journal, 23(3): 123-135. https://doi.org/10.33899/rengj.2015.101565
[15] Al Katheeri, E., Al Jallad, F., Al Omar, M. (2012). Assessment of gaseous and particulate pollutants in the ambient air in Al Mirfa City, United Arab Emirates. Journal of Environmental Protection, 3(7): 640-647. https://doi.org/10.4236/jep.2012.37077
[16] United States Environmental Protection Agency (USEPA). National air quality: Status and trends of key air pollutants. https://www.epa.gov/air-trends.
[17] National Center for Biotechnology Information. https://www.ncbi.nlm.nih.gov.
[18] Iraqi Ministry of Environment. https://moen.gov.iq/en.
[19] Gautam, K., Sharma, P., Dwivedi, S., Singh, A. (2023). A review on control and abatement of soil pollution by heavy metals: Emphasis on artificial intelligence in recovery of contaminated soil. Environmental Research, 225: 115592. https://doi.org/10.1016/j.envres.2023.115592
[20] Liu, L., Li, W., Song, W., Guo, M. (2018). Remediation techniques for heavy metal-contaminated soils: Principles and applicability. Science of the Total Environment, 633: 206-219. https://doi.org/10.1016/j.scitotenv.2018.03.161
[21] Franzaring, J., Schlosser, S., Damsohn, W., Fangmeier, A. (2016). Regional differences in plant levels and investigations on the phytotoxicity of lithium. Environmental Pollution, 216: 858-865. https://doi.org/10.1016/j.envpol.2016.06.059
[22] Aral, H., Vecchio-Sadus, A. (2008). Toxicity of lithium to humans and the environment—A literature review. Ecotoxicology and Environmental Safety, 70(3): 349-356. https://doi.org/10.1016/j.ecoenv.2008.02.026
[23] Schrauzer, G.N. (2002). Lithium: occurrence, dietary intakes, nutritional essentiality. Journal of the American College of Nutrition, 21(1): 14-21. https://doi.org/10.1080/07315724.2002.10719188
[24] Chow, A.T. (2022). Proactive approach to minimize lithium pollution. Journal of Environmental Quality, 51(5): 872-876. https://doi.org/10.1002/jeq2.20405
[25] Wang, H., Zhang, Y., Li, W., Li, C., Ouyang, M. (2020). Soil pollution element content and size distribution of particles released by abused prismatic Ni-rich automotive lithium-ion batteries. In 2020 International Conference on Mathematics and Computers in Science and Engineering, Madrid, Spain, pp. 209-215. https://doi.org/10.1109/MACISE49704.2020.00045
[26] Hayyat, M.U., Nawaz, R., Siddiq, Z., Shakoor, M.B. (2021). Investigation of lithium application and effect of organic matter on soil health. Sustainability, 13(4): 1705. https://doi.org/10.3390/su13041705
[27] Mlitan, A.B., Alajtal, A.I., Alsadawy, A.M. (2013). Toxicity of heavy metals and microbial analysis of soil samples collected from the area around Zliten cement factory. Open Journal of Air Pollution, 2(1): 25-28. https://doi.org/10.4236/ojap.2013.21004.
[28] Liu, K., Li, C., Tang, S., Shang, G. (2020). Heavy metal concentration, potential ecological risk assessment and enzyme activity in soils affected by a lead-zinc tailing spill in Guangxi, China. Chemosphere, 251: 126415. https://doi.org/10.1016/j.chemosphere.2020.126415
[29] Dao, N.B., Dogan, B., Ghosh, S., Kazemzadeh, E. (2025). Toward sustainable ecology: How do environmental sustainability and circular economy initiatives affect environmental performance? Clean Technologies and Environmental Policy, 27: 1387-1405. https://doi.org/10.1007/s10098-024-02887-y
[30] Cheng, H., Huang, L., Ma, P., Shi, Y. (2019). Ecological risk and restoration measures relating to heavy metal pollution in industrial and mining wastelands. International Journal of Environmental Research and Public Health, 16(20): 3985. https://doi.org/10.3390/ijerph16203985