Rinto Anugraha NQZ*![]() | Roni Muslim
| Roni Muslim![]() | Lala Septem Riza
| Lala Septem Riza![]() | Judhistira Aria Utama
| Judhistira Aria Utama![]() | Khyrina Airin Fariza Abu Samah
| Khyrina Airin Fariza Abu Samah![]() | Dhani Herdiwijaya
| Dhani Herdiwijaya![]() | Emanuel Sungging Mumpuni
| Emanuel Sungging Mumpuni![]()
© 2025 The authors. This article is published by IIETA and is licensed under the CC BY 4.0 license (http://creativecommons.org/licenses/by/4.0/).
OPEN ACCESS
Various physical or mathematical models have analyzed the relationship between Radiance and distance. Using data from VIIRS satellite imagery, this paper proposes a simplified method to analyze the relationship between the average Radiance $\langle R\rangle$ and the distance $r$ measured from the center point (highest Radiance). We reviewed three major cities in Indonesia: Jakarta, Bandung, and Yogyakarta. Analyzing the VIIRS raw data from 20122021, Jakarta follows the power-law relation: $\langle R\rangle \sim r^{-\alpha}$. Bandung and Yogyakarta follow the exponential relation: $\langle R\rangle \sim \exp (-\alpha r)$, where the values of $\alpha$ vary yearly. In addition, we also find that the average Radiance follows the power-law relation with the area $A$ that is $\langle R\rangle \sim A^{-\beta}$, where $A$ is the region area at a distance $r$. The $\beta$ exponent varies every year and from all three cities. By comparing the numerical results to real-time VIIRS data, the study validates the reliability of this simplified approach. The findings underscore the impact of urban development on light pollution, offering a practical and extendable model to other regions. This research contributes to understanding urban lighting dynamics, providing implications for sustainable city planning and environmental protection efforts.
exponential relation, light pollution, power-law relation, Radiance, VIIRS data
The use of artificial light at night is an issue of considerable concern in the astronomical community. The effect of using artificial light can reduce the visual quality of the night sky so that it can interfere with observing astronomical objects in the night sky [1]. Because of this effect, artificial light is categorized as light pollution [2-4]. The use of artificial light for lighting on the Earth’s surface is increasing over time [5]. This situation is because of the growing population on Earth and the need for information due to the expanding number of human activities. In addition, a portion of the world’s population is concentrated in urban areas [6].
The fact is that the human population is not evenly distributed throughout the Earth’s surface. However, the human population continues to increase every year. The increasing human population cannot be separated from various human activities on the Earth’s surface that directly impact the environment [6-9]. This human activity is, of course, related to the need for both absorbed and wasted energy, one of the impacts of which is the emergence of light pollution. Besides making it more challenging to see astronomical objects, especially in urban areas, light pollution also impacts psychological, epidemiological, and ecological problems. Medically, artificial light at night disrupts circadian rhythms and suppresses melatonin production, which is linked to increased risks of metabolic disorders, immune dysfunction, and cancers such as breast and colorectal cancer. Ecologically, light pollution alters reproductive cycles, disrupts predator-prey dynamics, and interferes with migration and orientation in various species. For instance, birds and sea turtles relying on natural light cues for navigation are often disoriented by urban sky glow, leading to fatal consequences. It also affects foraging behaviors, where increased illumination heightens predation risks and disrupts the ecosystem balance. [10]. Light pollution also increases the brightness of the sky by 10% of natural sky brightness above an altitude of 45o [11].
One can analyze information about light pollution from the Radiance value of artificial light. Here, Radiance R is defined as the radiant flux per unit projected area and per unit solid angle incident on, passing through, or emerging in a specified direction from a specified point in a specified surface [12]. The SI unit for Radiance is W m-2 sr-1. In this paper, we use the unit of nW cm-2 sr-1.
Scientists have used various methods to analyze the Radiance trend over space and time; one of the methods is by fitting light pollution data from multiple international astronomical agencies/organizations, such as the National Aeronautics and Space Administration (NASA) and the International Dark-Sky Association. These data show that the Radiance of artificial light decreases as the distance increases [13-20]. Garstang has introduced a complex physical model of light scattering from the Earth’s surface, known as the Garstang model [14-16]. The Garstang model predicts the brightness of the sky by an observer observing it at various points on the Earth’s surface. The Garstang model was adopted to create the world's first Artificial Night Sky Brightness Atlas [21]. Most data from the mainland use DMSP-OLS satellite imagery [22]. The physical model used to predict Radiance over the curvature of distance on the Earth's surface is written as $R=R_0 d^{-\beta}$, where $R_0$ is the night sky Radiance near the source and $\beta$ is the exponent parameter depending on the curvature distance $d$ through $\beta=k(1+$ $d / 1000)$ [23].
In this paper, using a simple method, we analyze the relationship between the average Radiance and the distance or area of several cities in Indonesia, such as Jakarta, Bandung, and Yogyakarta. Based on the Central Agency on Statistics of Indonesia (BPS), all three cities are among the areas with the highest electricity usage compared to other cities in Indonesia [24]. Electricity, of course, is partly used for lighting—the distance measured from the center of the cities (highest Radiance) of several cities in Indonesia. The Radiance information is based on the Visible Infrared Imaging Radiometer Suite (VIIRS).
VIIRS is one of five instruments onboard the Suomi National Polar-orbiting Partnership (NPP) satellite platform. The VIIRS satellite instrument observes and collects global satellite observations that span the visible and infrared wavelengths across land, ocean, and atmosphere. There are 22 channels ranging from 0.41 μm to 12.01 μm. Five channels are high-resolution image bands or I-bands, and sixteen are moderate-resolution or M-bands. VIIRS also hosts a unique panchromatic Day/Night band (DNB), which is ultra-sensitive in low-light conditions and allows us to observe nighttime lights with better spatial and temporal resolutions compared to previously provided nighttime lights data by the Defense Meteorological Satellite Program.
The VIIRS sensor was designed to extend and improve upon the series of measurements initiated by its predecessors, such as the Advanced Very High-Resolution Radiometer (AVHRR), the Moderate Resolution Imaging Spectroradiometer (MODIS), and the Sea-viewing Wide Field-of-view Sensor. VIIRS-derived data products are used to measure cloud and aerosol properties, ocean color, ocean and land surface temperature, ice movement and temperature, fires, and Earth's albedo [25]. VIIRS data can also be used to measure radiance, a key parameter to quantify light pollution.
The light pollution website processes VIIRS data derived from satellite imagery data. Then, we downloaded the radiance data from the website [26]. The data are in raw tiff format, converted using QGIS software, and then analyzed using a self-made ImageJ macro program. By setting the appropriate scale between the Radiance's and pixel's values in ImageJ software, we find that the average Radiance follows the power and exponential laws to the distance. The average Radiance follows the power law relation with the distance for Jakarta, where the value of the parameter power law is different yearly. In addition, the average Radiance follows the exponential law with the distance for Bandung and Yogyakarta, where the exponential parameter is also different every year. Our works suggest that analyzing the Radiance versus distance measured from the brightness point of the artificial light could be simpler than the previously proposed models.
To analyze an area's average Radiance áRñ, we consider the 2012-2021 VIIRS raw data and employ the free ImageJ software (throughout the macro language) to obtain the pixel's value [27]. We consider three metropolitan cities in Indonesia: Jakarta, the capital city of Indonesia; Bandung; and Yogyakarta. The raw data image from VIIRS is converted to tiff format using free QGIS software [28]. After that, the image is converted to an 8-bit (black-white) image type using ImageJ software. The sample of the converted image in 8-bit (black-white) image type is exhibited in Figure 1.
Figure 1. Jakarta, Bandung, and Yogyakarta images are presented in 8-bit type (black-white). The sea area is considered to have a zero-pixel value
To obtain the average Radiance $\langle R\rangle$ using ImageJ macro language, we use the Algorithm as follows: Firstly, we determine the initial location at the highest Radiance R as a center point. Secondly, we determine the measured location r = (rin + rout)/2, located between the inner rin and outer rout location points, where rout-rin = 230 m. Outside this region, the Radiance is not be calculated. The Radiance values at point r are recorded and averaged. When r exceeds 10 km, the measurement is stopped. We carry out these measurements for all VIIRS data from 2012 to 2021.
We fit the measured data to see the trend/pattern and obtain the best-fitting parameters. We find that the data has either a power law or exponential law relationship with distance r and a power law with area A. Previous works have also reported this kind of data pattern [14-20]. The fitting or slope parameter can describe the imbalance in the use of artificial light between the city center and a location r from the city center.
We employ a straightforward method by employing raw VIIRS raw data compared to already processed data provided by NOAA (National Oceanic and Atmospheric Administration) due to practical considerations. While there is already a monthly composite with 16-bit images that have a spatial resolution of 15 arcseconds, equivalent to approximately 0.5 km on the equator, and average cloud-free radiance expressed in nanowatt/cm2/sr [29], however, the reliance on the processed data can be considered impractical for earlier assessment of light pollution condition. The cloud cover greatly affects Indonesian tropical conditions, affecting time-to-time measurement, so we consider that average radiance by using raw data approximately justifies the severity of light pollution in the selected cities for the study.
As such, the city of Bandung has also already been studied by the correlation between VIIRS and in-situ measurement, which shows a more detailed map of light pollution above the city, which can be used as a baseline model of light pollution of the city in detail [29].
The light pollution map from the VIIRS data for several cities in Indonesia is exhibited in Figure 2. Based on the map, one can see that all three cities have a relatively high use of artificial light compared to cities on the island of Java [25]. As previously mentioned, according to the 2020 BPS data of Indonesia, these three cities are Indonesia's most significant electricity users. Therefore, it is interesting to analyze the average Radiance in the regions.

Figure 2. The VIIRS map of Jakarta, Bandung, and Yogyakarta in 2021 [26]
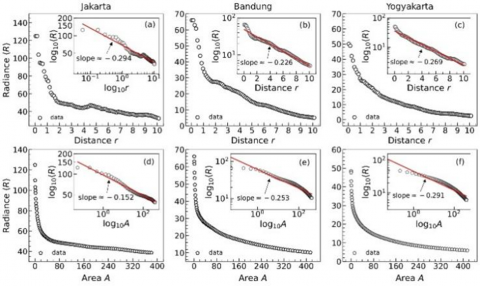
We analyzed the VIIRS raw data from 2012-2021 for three cities in Indonesia, namely Jakarta, Bandung, and Yogyakarta, to analyze artificial light intensity (the average Radiance), which is calculated from the highest Radiance (usually in the city center) to a distance of 10 km away from the city center. The results of the average Radiance $\langle R\rangle$ versus distance r and area A for the data 2012, 2013, 2020, and 2021 are shown in Figures 3-6, respectively. The average Radiance $\langle R\rangle$ decreases as the distance r increases. In contrast, for Jakarta, the average Radiance $\langle R\rangle$ satisfies the power-law relation, that is, $\langle R\rangle \sim r^{-\alpha}$, where the value of $\alpha$ is different every year. For Bandung and Yogyakarta, the average Radiance $\langle R\rangle$ decreases exponentially as $r$ increases with relation $\langle R\rangle \sim \exp (-\alpha r)$, where the value of $\alpha$ is also different every year for both cities (see the inset graphs).
We also analyze the relationship between the average Radiance $\langle R\rangle$ and the area A, measured at a distance r from the center of the highest Radiance. We calculate the area A using the formula A = $\pi$ (rout2-rin2), with rout-rin = 230 m calculated on the surface of the Earth. The plot of the average Radiance $\langle R\rangle$ versus area A is exhibited in the bottom panel of Figures 3-6. We take a value of 230 m because the Radiance value is relatively constant in that area. Based on the Figures 3-6, it can be seen that the average Radiance value decreases more steeply with area A than with distance r. This is because the Radiance values at the points within the area A are more heterogeneous than those located as far as r from the center of the Radiance. This condition can also be seen `roughly' for three cities in Figure 2. The average Radiance $\langle R\rangle$ follows the power-law relation with area $A$ for all three cities, namely $\langle R\rangle$ $\sim A^{-\beta}$, where the value of $\beta$ is different for all three cities.
Figure 3. (Data 2012) The numerical result of the average Radiance $\langle R\rangle$ versus distance r(km) [top] and area A(Km2) [down], for Jakarta [(a) $\alpha \approx 0.312$, and (d) $\beta \approx 0.161]$, Bandung [(b) $\alpha \approx 0.220$, and (e) $\beta \approx 0.238$], and Yogyakarta [(c) $\alpha \approx 0.282$, and (f) $\beta \approx 0.316$]. See the text for an explanation of $\alpha$ and $\beta$
Figure 4. (Data 2013) Similar as Figure 3 explanation, for Jakarta $\alpha \approx 0.294, \beta \approx 0.152$; for Bandung $\alpha \approx 0.226, \beta \approx$ 0.253; and for Yogyakarta $\alpha \approx 0.269, \beta \approx 0.291$
Figure 5. (Data 2020) Similar as Figure 3 explanation, for Jakarta $\alpha \approx 0.305, \beta \approx 0.149$; for Bandung $\alpha \approx 0.172, \beta \approx$ 0.179; and for Yogyakarta $\alpha \approx 0.229, \beta \approx 0.285$
Figure 6. (Data 2021) Similar as Figure 3 explanation, for Jakarta $\alpha \approx 0.306, \beta \approx 0.153$; for Bandung $\alpha \approx 0.143, \beta \approx$ 0.165; and for Yogyakarta $\alpha \approx 0.205, \beta \approx 0.248$
Jakarta exhibits a power-law relationship in Radiance decay with distance from the city center. This decay indicates that Radiance decreases more gradually compared to an exponential decay, signifying that Jakarta’s lighting systems are extensive, with light pollution reaching far beyond the city’s core. This trend is consistent with Jakarta’s status as Indonesia’s largest metropolitan area, characterized by sprawling urban development, high population density, and significant infrastructure expansion. The city’s extensive use of lighting in peripheral areas such as industrial zones, highways, and suburban neighborhoods likely contributes to this slower decay.
In contrast, Bandung and Yogyakarta follow an exponential decay model where Radiance drops sharply as one moves away from the urban center. This steep reduction reflects more compact urban structures, with lighting concentrated in core areas and declining rapidly in peripheral zones. These cities are less densely populated and have fewer outlying commercial or industrial zones than Jakarta.
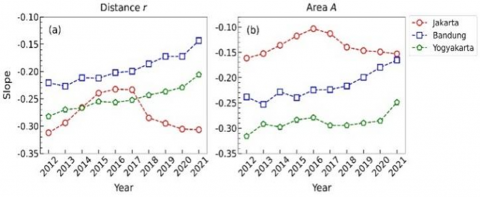
The slope trend value for the three cities is shown in Figure 7. It can be seen that the value of the slopes $\alpha$ and $\beta$ increases yearly. However, for Jakarta, starting from 2017 to 2021, the slope's value decreases. As we can see in the figure, the slope value represents the inequality of the average Radiance $\langle R\rangle$ between the location with the highest value of $R$ (usually in the city center) and the average Radiance at a distance $r$ from the city center. One can say that the average Radiance gap between the city center and the area at a distance $r$ (maximum 10 km from the city center) is increasing every year for the three cities, starting from 2012-2021 for the cities of Bandung and Yogyakarta, and starting in 2012-2016 for the city of Jakarta and decreased from 2017-2021. This condition can be caused by the higher use rate of artificial light in the city center every year, while in locations that are far away, it is relatively constant. We also note that the average Radiance value at many locations from the city center tends to increase with increasing time. This shows that the level of light pollution is increasing.
Figure 7. The trend of slopes versus (a) distance r and (b) area A from 2012 – 2021 for three cities
Jakarta’s inequality grew until 2016, after which it plateaued or decreased. Jakarta’s plateau suggests possible interventions (e.g., policies, saturation of development in central areas). The plateau in inequality could reflect efforts to decentralize urban lighting through infrastructure development in peripheral zones and natural saturation of lighting development in the urban core.
Bandung and Yogyakarta exhibit a steady increase in Radiance inequality, with sharper disparities between urban centers and peripheral zones. Bandung and Yogyakarta maintain a continuous upward trend in slope values, reflecting urban centralization and rising light usage in cores.
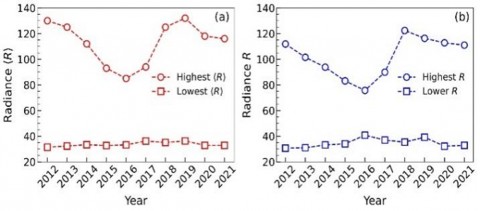
We also compare the numerical result of our method for the average Radiance $\langle R\rangle$ versus the Radiance $R$ of the real-time data from the VIIRS light pollution info for the same specific location as exhibited in Figure 8, as for Jakarta from 2012 to 2021. One can see that the trend is relatively similar for both data. Therefore, our simple method can analyze other regions' average Radiance $\langle R\rangle$.
Figure 8. The trend of $\langle R\rangle$ that is obtained by numerical calculation (a) and the real-time Radiance R obtained from [26] (b) for Jakarta from 2012 to 2021
Figure 8 shows a relatively similar trend over the studied period, though specific yearly values differ. The highest average Radiance typically corresponds to measurements near the city center, while the lowest R values are recorded 10 km from the city center. This trend is consistent with light pollution originating from the urban core and diminishing with increasing distance. The similarity between the two trends validates the reliability of the simplified numerical approach for analyzing average Radiance. The comparison underscores the impact of urban development on light pollution over time. It also supports the numerical methods for broader light pollution studies, especially in regions where direct real-time data may not always be available.
Using the simple model obtained for three cities, we extend the analysis to other big cities in Indonesia, such as Semarang, Surabaya, Medan, Palembang, and Makassar. We obtain similar results with the average Radiance following an exponential form $\langle R\rangle \sim \exp (-\alpha r)$ with different coefficients of $\alpha$. These results explain that the simple model can quantitatively analyze light pollution models using radiance values from VIIRS data.
However, this result needs to be checked further with several other locations around Indonesia, which have already been measured by the method of the study [29] for other cities outside of the three mentioned in this work [30]. By using Bandung as the baseline city, the expected condition of light pollution is comparable. In particular, the method [29] applied to the study [30] was derived by in-situ measurement to compare with VIIRS, which had already removed cloud cover. In-situ measurement was prone to cloud cover, so this method has a shortcoming with cloud cover conditions during the measurement. In this way, that straightforward method using raw VIIRS data has the advantage of quick assessment. We have demonstrated that this method can be used for early assessment for well-developed urban areas by using the VIIRS data. It is expected that this method can be used for exploring the new emerging area with low light pollution for various purposes around Indonesia and the predicted development [31], as well as overcoming the difficulty of detecting fragmented low-altitude clouds in the equator [32].
From the above results, we propose some recommendations for reducing light pollution. Mitigating light pollution in urban planning can begin with formulating stricter and more targeted rules and regulations for outdoor lighting. As a first step, local governments can establish lighting zones with different light intensity limits according to land use, such as commercial, residential, or conservation areas. In addition, curfews for non-essential lights, such as billboards and decorative lamps, can be enforced to reduce lighting levels after midnight.
Outdoor lighting must also be designed using technology that limits light emissions upwards. Using full cutoff fixtures that emit light directly downwards rather than skyward can minimize glare and reduce unnecessary light spread. Technical standards that set maximum brightness levels for various types of lamps can also help prevent over-illumination that is detrimental to the night environment.
The government can encourage using energy-efficient lamps, such as LEDs, which are highly efficient and easily controlled. Implementing motion sensors, timers, and intelligent lighting systems allows dynamic lighting levels to be adjusted to environmental activity. These policies can be combined with economic incentives, such as tax breaks or subsidies, to motivate property owners to switch to environmentally friendly and energy-efficient lighting systems.
The role of governments and related institutions can hold workshops, seminars, or public campaigns to raise public awareness about the negative impacts of light pollution on health, ecosystems, and astronomical research. Simple guides in the form of brochures or online resources can also be provided to residents so that they can understand how to choose and install lights that meet night sky-friendly standards.
Lighting considerations need to be integrated into urban planning. Every new development project, from residential areas to city parks, should include aspects of light pollution mitigation in the spatial design. These policies can be continuously refined through routine monitoring and periodic evaluation using light-intensity measurement data. A comprehensive approach involving strict regulations, appropriate technology, economic incentives, and public education can achieve healthier and more sustainable night sky conditions.
Finally, adopting smart street lighting systems, such as traffic-aware technologies and adaptive part-night operations, offers significant economic and environmental advantages over conventional lighting systems. These systems reduce energy consumption by up to 96% and achieve substantial cost savings with a payback period of 5-6 years despite higher initial installation costs [33]. Additionally, smart lighting significantly lowers CO2 emissions, contributing to climate change mitigation, with emissions as low as 22.047 kg/year compared to 583.2 kg/year for traditional LED systems. The dynamic brightness adjustment of smart lighting enhances visibility and safety, making it a sustainable and efficient solution for modern urban infrastructure.
This study provides a detailed assessment of light pollution trends in three Indonesian cities—Jakarta, Bandung, and Yogyakarta—using VIIRS satellite data from 2012 to 2021. By examining the relationships between Radiance, distance, and area, the analysis reveals distinct patterns of light pollution in urban environments. Jakarta demonstrates a power-law decay in Radiance with distance, reflecting widespread and uncontrolled urban sprawl, while Bandung and Yogyakarta exhibit exponential decay, indicative of more compact urbanization. Across all three cities, Radiance declines more sharply with area than with distance, highlighting greater heterogeneity in lighting distribution across larger zones.
The study highlights that the VIIRS-based method is effective for early assessments of light pollution, particularly in well-developed urban areas, and can be extended to explore emerging areas with low light pollution across Indonesia. To mitigate light pollution, comprehensive strategies should include stricter regulations, the adoption of energy-efficient technologies like LEDs, and public awareness campaigns, integrated into urban planning and supported by economic incentives. Finally, adopting smart lighting systems, such as traffic-aware technologies, offers significant environmental and economic benefits, energy savings, and drastically reduced CO2 emissions, making them a sustainable solution for urban lighting.
R. Anugraha NQZ would like to thank Jurij Stare for valuable discussions. The authors would like to acknowledge the Ministry of Research and Technology, Research, and Gadjah Mada University for funding this work via the Indonesian Collaboration Research (RKI) Grant for the years 2022-2024.
[1] Gronkowski, P., Tralle, I., Wesołowski, M. (2018). Visibility of comets during their outbursts and the night sky light pollution—Use the Bortle scale. Astronomische Nachrichten, 339(1): 37-45. https://doi.org/10.1002/asna.201713387
[2] Cavazzani, S., Ortolani, S., Bertolo, A., Binotto, R., Fiorentin, P., Carraro, G., Saviane, I., Zitelli, V. (2020). Sky Quality Meter and satellite correlation for night cloud-cover analysis at astronomical sites. Monthly Notices of the Royal Astronomical Society, 493(2): 2463-2471. https://doi.org/10.1093/mnras/staa416
[3] Falchi, F., Bará, S. (2020). A linear systems approach to protect the night sky: Implications for current and future regulations. Royal Society Open Sciences, 7(12): 201501. https://doi.org/10.1098/rsos.201501
[4] Simons, A.L., Yin, X., Longcore, T. (2020). High correlation but high scale-dependent variance between satellite measured night lights and terrestrial exposure. Environmental Research Communications, 2(2): 021006. https://doi.org/10.1088/2515-7620/ab7501
[5] Riza, L.S., Izzuddin, A., Utama, J.A., Samah, K.A.F.A., Herdiwijaya, D., Hidayat, T., Anugraha, R., Mumpuni, E.S. (2022). Data analysis techniques in light pollution: A survey and taxonomy. New Astronomy Reviews, 95: 101663. https://doi.org/10.1016/j.newar.2022.101663
[6] Falchi, F., Cinzano, P., Duriscoe, D., Kyba, C.C.M., Elvidge, C.D., Baugh, K., Portnov, B.A., Rybnikova, N.A., Furgoni, R. (2016). The new world atlas of artificial night sky brightness. Science Advances, 2(6): e1600377. https://doi.org/10.1126/sciadv.1600377
[7] Elvidge, C.D., Baugh, K.E., Dietz, J.B., Bland, T., Sutton, P.C., Kroehl, H.W. (1999). Radiance calibration of DMSP-OLS low-light imaging data of human settlements. Remote Sensing of Environment, 68(1): 77-88. https://doi.org/10.1016/S0034-4257(98)00098-4
[8] Hara, M., Okada, S., Yagi, H., Moriyama, T., Shigehara, K., Sugimori, Y. (2004). Progress for stable artificial lights distribution extraction accuracy and estimation of electric power consumption by means of DMSP/OLS night-time imagery. International Journal of Remote Sensing and Earth Sciences, 1(1): 31-42. https://www.researchgate.net/publication/285696522_Progress_for_stable_artificial_lights_distribution_extraction_accuracy_and_estimation_of_electric_power_consumption_by_means_of_DMSPOLS_nighttime_imagery.
[9] Shi, K., Yu, B., Huang, Y., Hu, Y., Yin, B., Chen, Z., Chen, L., Wu, J. (2014). Evaluating the ability of NPP-VIIRS nighttime light data to estimate the gross domestic product and the electric power consumption of China at multiple scales: A comparison with DMSP-OLS data. Remote Sensing, 6(2): 1705-1724. https://doi.org/10.3390/rs6021705
[10] Navara, K.J., Nelson, R.J. (2007). The dark side of light at night: Physiological, epidemiological, and ecological consequences. Journal of Pineal Research, 43(3): 215-224. https://doi.org/10.1111/j.1600-079x.2007.00473.x
[11] Hu, Z., Hu, H., Huang, Y. (2018). Association between nighttime artificial light pollution and sea turtle nest density along Florida coast: A geospatial study using VIIRS remote sensing data. Environmental Pollution, 239: 30-42. https://doi.org/10.1016/j.envpol.2018.04.021
[12] McCluney, W.R. (2014). Introduction to Radiometry and Photometry (2nd ed.). Artech House.
[13] Walker, M.F. (1977). The effects of urban lighting on the brightness of the night sky. Publications of the Astronomical Society of the Pacific, 89(529): 405. https://doi.org/10.1086/130142
[14] Garstang, R.H. (1986). Model for artificial night-sky illumination. Publications of the Astronomical Society of the Pacific, 98(601): 364-375. https://doi.org/10.1086/131768
[15] Garstang, R.H. (1989). Night sky brightness at observatories and sites. Publications of the Astronomical Society of the Pacific, 101(637): 306-329. https://doi.org/10.1086/132436
[16] Garstang, R.H. (1991). Dust and light pollution. Publications of the Astronomical Society of the Pacific, 103(668): 1109-1116. https://doi.org/10.1086/132933
[17] Aubé, M., Kocifaj, M. (2012). Using two light-pollution models to investigate artificial sky radiances at Canary Islands observatories. Monthly Notices of the Royal Astronomical Society, 422(1): 819-830. https://doi.org/10.1111/j.1365-2966.2012.20664.x
[18] Linares, H., Masana, E., Ribas, SJ., Garcia-Gil, M., Figueras, F., Aubé, M. (2018). Modelling the night sky brightness and light pollution sources of Montsec protected area. Journal of Quantitative Spectroscopy and Radiative Transfer, 217: 178-188. https://doi.org/10.1016/j.jqsrt.2018.05.037
[19] Duriscoe, DM., Anderson, SJ., Luginbuhl, CB., Baugh, KE. (2018). A simplified model of all-sky artificial sky glow derived from VIIRS Day/Night band data. Journal of Quantitative Spectroscopy and Radiative Transfer, 214: 133-145. https://doi.org/10.1016/j.jqsrt.2018.04.028
[20] Falchi, F., Bará, S. (2021). Computing light pollution indicators for environmental assessment. Natural Sciences, 1(2): e10019. https://doi.org/10.1002/ntls.10019
[21] Cinzano, P., Falchi, F., Elvidge, C.D., Baugh, K.E. (2000). The artificial night sky brightness mapped from DMSP satellite operational linescan system measurements. Monthly Notices of the Royal Astronomical Society, 318(3): 641-657. https://doi.org/10.1046/j.1365-8711.2000.03562.x
[22] Cinzano, P., Falchi, F., Elvidge, C.D. (2001). The first World Atlas of the artificial night sky brightness. Monthly Notices of the Royal Astronomical Society, 328(3): 689-707. https://doi.org/10.1046/j.1365-8711.2001.04882.x
[23] Cinzano, C., Falchi, F. (2012). The propagation of light pollution in the atmosphere. Monthly Notices of the Royal Astronomical Society, 427(4): 3337-3357. https://doi.org/10.1111/j.1365-2966.2012.21884.x
[24] BPS. (2024). Electricity distributed by province (in Indonesian), 2021-2022, Indonesia. Retrieved from https://www.bps.go.id/id/statistics-table/2/ODU5IzI=/listrik-yang-didistribusikan-menurut-provinsi-gwh-.html.
[25] Visible Infrared Imaging Radiometer Suite (VIIRS). (20224). https://ladsweb.modaps.eosdis.nasa.gov/missions-and-measurements/viirs/.
[26] Stare, J. (2022). Light Pollution Map. https://www.lightpollutionmap.info.
[27] Schneider, C.A., Rasband, W.S., Eliceiri, K.W. (2012). NIH image to ImageJ: 25 years of image analysis. Nature Methods, 9(7): 671-675. https://doi.org/10.1038/nmeth.2089
[28] QGIS Software. (2022). http://qgis.org.
[29] Priyatikanto, R., Admiranto, A.G., Putri, G.P., Elyyani, E., Maryam, S., Suryana, N. (2019). Map of sky brightness over greater Bandung and the prospect of astro-tourism. Indonesian Journal of Geography, 51(2): 190-198. https://journal.ugm.ac.id/ijg/article/view/43410.
[30] Admiranto, A.G., Priyatikanto, R., Maryam, S., Ellyani, Kurniawati, S., Saputro, M.F.E. (2021). Light pollution observations in Indonesia. IntechOpen. https://doi.org/10.5772/intechopen.96897
[31] Riza, L.S., Putra, Z.A.Y., Firdaus, M.F.Y., Trihutama, F.Z., Izzuddin, A., Utama, J.A., Samah, K.A.F.A., Herdiwijaya, D., NQZ, R.A., Mumpuni, E.S. (2023). A spatiotemporal prediction model for light pollution in conservation areas using remote sensing datasets. Decision Analytics Journal, 9: 100334. https://doi.org/10.1016/j.dajour.2023.100334
[32] Priyatikanto, R., Mumpuni, E.S., Hidayat, T., Saputra, M.B., Murti, M.D., Rachman, A., Yatini, C.Y. (2023). Characterization of Timau National Observatory using limited in situ measurements. Monthly Notices of the Royal Astronomical Society, 518(3): 4073-4083. https://doi.org/10.1093/mnras/stac3349
[33] Mohammad, A., Modabbir, Ashraf, I., Kamal, M.M. (2023). Economic and environmental impact of energy efficient design of smart lighting system. Journal of The Institution of Engineers (India): Series B, 104(3): 679-692. https://doi.org/10.1007/s40031-023-00885-0