Yashraj Patil![]() | Rani Fathima
| Rani Fathima![]() | Brian Campbell
| Brian Campbell![]() | Dorian Janney
| Dorian Janney![]() | Shilpa Hudnurkar
| Shilpa Hudnurkar![]() | Harikrishnan R*
| Harikrishnan R*![]()
© 2024 The authors. This article is published by IIETA and is licensed under the CC BY 4.0 license (http://creativecommons.org/licenses/by/4.0/).
OPEN ACCESS
The review study explores contemporary Earth observation (EO) methods and the influential role of citizen science in environmental research. It emphasizes the integration of diverse datasets-such as satellite imagery, field surveys, and citizen science contributions, to enhance the precision and efficiency of Earth system studies. By combining high-resolution remote sensing technologies with ground-based observations, researchers can effectively monitor and analyze biodiversity hotspots and other critical environmental phenomena. The study highlights the crucial role of citizen science and community engagement in broadening data collection efforts and involving the public in environmental monitoring initiatives. It also acknowledges the importance of field studies and research expeditions for validating and complementing EO data. A key focus of the review is the use of open-source tools and innovative methodologies that facilitate high-quality research on constrained budgets. This approach improves accessibility and repeatability, enabling significant scientific advancements without substantial financial investments. The review showcases how leveraging these integrated technologies can advance Earth science research and overcome financial barriers, ensuring that valuable scientific contributions are achievable even with limited resources. This review provides practical insights for integrating EO techniques, field studies, and citizen science, offering guidance for conducting impactful and cost-effective environmental research.
biodiversity hotspot, citizen science, earth observation, field study, NASA GLOBE program, remote sensing
Earth is the only planet in the solar system known to support life, owing to its specific physical and chemical conditions. Yet, amid its breathtaking beauty and awe-inspiring complexity, our planet faces unprecedented challenges, chief among them being the escalating threat of climate change.
Climate change is one of our most pressing global challenges, with far-reaching consequences for ecosystems, economies, and human societies. Its impacts are particularly pronounced in ecologically sensitive regions, characterised by high levels of species richness and endemism. These regions are crucial for global biodiversity conservation and vital resources for ecosystem services on which human well-being depends.
Climate change manifests in various forms, including alterations in temperature patterns, precipitation levels, and extreme weather events. These changes have profound implications for biodiversity hotspots, as they can disrupt delicate ecological balances, threaten the survival of endemic species, and lead to shifts in species distributions and community compositions.
The 21st Century is witnessing a long breakthrough in STEM (Science, Technology, Engineering and Mathematics) research and development with advancements in earth observation tools and techniques. Remote sensing is a popular technique for earth observation and ecological monitoring from space. Yet, there are several hurdles in getting data from remote sensing, like cloud cover, cyclones, and space weather, that could be improved for the performance of remote sensing. This is when the terrestrial earth observation methods help us understand the Earth more effectively. Yet they, too, have certain limitations that restrict the area of study focused on the Biodiversity Hotspots.
1.1 Why are biodiversity hotspots so important?
Biodiversity, or the variety of living organisms present on Earth, is essential for life for several reasons,
Biodiversity is necessary for our existence because it allows for adaptation and evolution, provides societal advantages, plays an integral part in climate change mitigation, has aesthetic and inspirational value, and enhances ecosystem functioning and the availability of services that benefit the environment.
As a result, the term’ Biodiversity Hotspot’ emerged as an approach to identifying areas of the world with a high level of biodiversity that are simultaneously under serious threat from human activity. Norman Myers originated the term in 1988, and Conservation International popularised it in the 1990s [7].
A biodiversity hotspot is a region on Earth characterised by exceptionally high levels of biodiversity, meaning it harbours many different species. However, these areas are also under considerable threat due to human activities, which have led to the loss of natural habitat and the endangerment of numerous species. To be classified as a biodiversity hotspot, an area must meet specific criteria [8]:
1) Species Endemism: The region must contain many species found nowhere else on Earth, known as endemic species. Typically, a biodiversity hotspot must have at least 1,500 species of vascular plants endemic to the area.
2) Vegetation Loss: The hotspot must have experienced significant habitat loss, with at least 70 percent of its primary native vegetation destroyed or severely degraded due to human activities.
Various Earth observation techniques employ remote sensing approaches developed by numerous international and national space organisations. These organisations have devised diverse methods for observing Earth from space. However, terrestrial earth observation remains prevalent during ground-based landscape research and study expeditions, enabling researchers to capture intricate surface characteristics. However, when covering larger areas, challenges arise as thorough scanning within a short timeframe is unfeasible. Remote sensing techniques become essential for documenting regions using satellite bands and identifying changes through band combinations.
Space-based earth observation techniques encounter limitations such as cloud cover obstructing infrared signal reflection from the planet’s surface or inaccessible areas beyond satellite reach. These constraints result in identified blocked and blackout regions due to satellite trajectory and the earth’s elliptical shape. However, subsequent orbital cycles may cover these areas, and in-situ observations can supplement the remotely sensed spatial data gaps. Hence, innovative technologies are employed to assess planetary health and discern anomalies and changes over defined timeframes [9]. Consequently, multiple tools are deployed to monitor planetary health and interpret anomalies and changes detected within specific intervals.
Citizen science is a collaborative research approach in which volunteers from the general public actively participate in scientific investigations. These individuals help with data collection, analysis, and interpretation while working with professional scientists. Citizen science projects transcend multiple disciplines, emphasising public engagement, scientific knowledge, and open science research. This approach harnesses the collective power of communities to address scientific questions, fostering a sense of shared responsibility and contributing valuable data for scientific advancements.
The review study provides an in-depth examination of Earth observation methods and their integration with citizen science in studying biodiversity hotspots. It begins with a discussion on terrestrial Earth observation techniques, including field surveys and validation of satellite imagery using ground-based observations. The review then covers sophisticated remote sensing technologies, such as spaceborne LiDAR, RADAR, and multispectral and hyperspectral imaging. These techniques illustrate the extensive range of tools available for ecological research, emphasising the need for integrating diverse data sources to improve the accuracy and effectiveness of environmental monitoring.
The role of citizen science is also a key focus, highlighting its significant contributions to environmental research and the United Nations Sustainable Development Goals (SDGs). The review details youth-focused programs and initiatives like NASA’s GLOBE Program, which engages the public in data collection through protocols and tools such as the GLOBE Observer App. Additionally, it explores open-source geospatial tools like the Open Foris Suite and NASA Giovanni for managing and analysing large datasets crucial for environmental monitoring. The final section proposes a cost-effective methodology for low-budget or self-funded research, integrating these technologies to enhance research outcomes and democratise access to scientific tools, promoting a more inclusive and innovative scientific community.
1) Research Focus: The review paper reviewed present studies that provide Earth observation methods to monitor and study the ecology or forest ecosystems.
2) Literature Search Approach: A literature search was conducted on multiple scholarly databases, such as Scopus, Web of Science, and Google Scholar, along with relevant repositories like ESA and NASA archives. Keywords such as "Ecological Study," "Terrestrial Observation," "Remote Sensing," "Earth Observation," and "Citizen Science" were combined in various ways using Boolean operators (e.g., AND, OR). A record of all search results was kept, duplicate items were removed using EndNote, and systematic review principles guided the final selection.
3) Inclusion Criteria: The search was guided by a fixed set of inclusion criteria to narrow down the selection of literature. The literature had to address earth observation methods as the primary or secondary subject. As a complete sentence, the specified keywords must be included in at least one of the fields (title, keywords, or abstract). Only peer-reviewed scholarly journal articles written in English were taken into consideration.
4) Literature Selection: The literature was searched using Scopus based on the inclusion above criteria. Papers that met the criteria were selected for further analysis and review.
5) Methodological Approach: The review paper utilised the indexed scientific databases to identify relevant peer-reviewed studies that directly or indirectly referenced earth observation and citizen science. Examples from the literature were included to summarise previous achievements, potential future directions, and areas for improvement in integrating earth observation into ecological research.
6) Analytical Techniques: The methodology combines systematic literature review and qualitative analysis. The systematic literature review involved a comprehensive search, selection, and analysis of studies that met the inclusion criteria. Qualitative analysis was employed to synthesise and summarise the state of available earth observation approaches and provide insights into future research possibilities.
Earth observation is the study and monitoring of the natural and manmade environment on Earth. It entails gathering and analysing data from on-the-ground investigations, satellites, aircraft, drones, and other platforms capable of capturing photos and data about the Earth’s surface, atmosphere, and oceans [10].
Earth observation data is used to study various natural phenomena associated with Earth’s environment, including weather patterns, land use changes, vegetation health, ocean currents, and atmospheric composition. It can also be employed to track catastrophic events like floods, wildfires, and tropical cyclones and aid in efforts to respond to them [11].
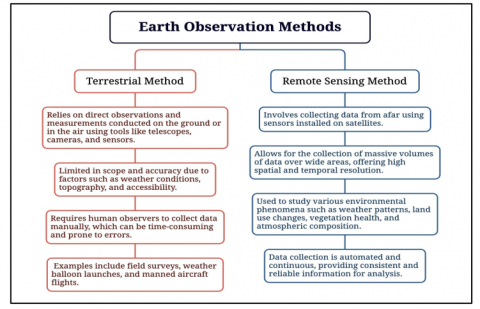
Earth Observation (EO) techniques provide crucial insights into environmental changes and biodiversity monitoring. Earth observation consists of terrestrial and remote sensing methods [12-14], two different ways of studying and monitoring the Earth’s environment. Figure 1 highlights the significant aspects involved between both of these methods.
Terrestrial and remote sensing methods are complementary approaches that can be combined to create a more complete picture of the natural world on the planet. While terrestrial earth observation has advantages regarding detailed, precise observations and measurements, remote sensing offers a broader perspective and can be more effective in monitoring large-scale changes over time [14, 15].
Figure 1. Earth observation methods
The following methods are central to understanding and managing biodiversity hotspots:
3.1 Satellite imagery
Satellite Imagery utilises various satellites to capture images of the Earth’s surface. It provides valuable data on land cover, vegetation, and habitat changes over time.
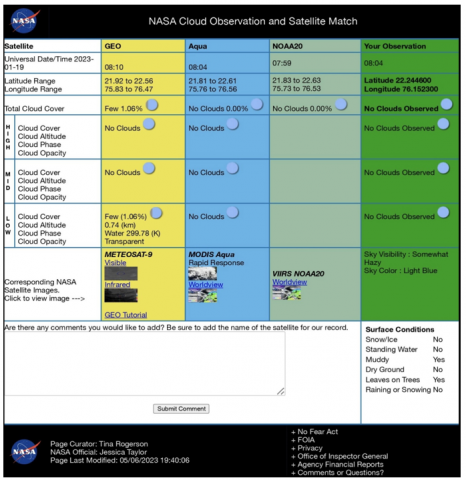
Satellite imagery validation using terrestrial earth observation techniques is essential in earth observation. While satellite photography can monitor and map the Earth’s surface [16], confirming and verifying the information gained from satellite data using ground-based measurements and observations is essential. Terrestrial observations, for example, can be used to authenticate satellite pictures by providing direct measurements of the Earth’s surface. Ground-based sensors, for example, can be utilised to assess soil moisture or vegetation cover, and the results can be compared to satellite pictures to validate the accuracy of the satellite data. Crowdsourced data, in addition to standard earth observation techniques, can be used to validate satellite imagery. Citizen scientists, for example, use their smartphones to capture and submit geotagged photographs, which can then be compared to satellite photography to check the correctness of the satellite data. Thus, terrestrial earth observation procedures for validating satellite imagery are vital in ensuring earth observation data’s correctness and dependability. By integrating satellite data with ground-based measurements and observations, researchers can gain a more subtle picture of the Earth’s surface and its changes through time. Both satellite imaging and ground-based measurements should generally be in the same units and format. For example, if the satellite imaging measures temperature, the ground-based data should also be in temperature units. Also, it is crucial to ensure that satellite imaging and ground-based measurements represent the same area and period. The correlation may be less accurate if the ground-based data are gathered at a different location or time than the satellite picture. Figure 2 demonstrates the terrestrial cloud observation and satellite data match report, which provides one example of ground-truthing spatial observations through terrestrial observations.
Figure 2. The NASA cloud observation and satellite match report (Credit: NASA and GLOBE)
3.2 Spaceborne lidar technology
LiDAR (Light Detection and Ranging) is a remote sensing technology that uses laser beams to measure the distance between a sensor and the Earth’s surface. Active remote sensing delivers accurate and detailed three-dimensional information on the Earth’s surface and features [15, 17, 18].
Table 1. LiDAR technology-based earth observation missions
|
Mission |
Launch Date |
Primary Objective |
Key Features |
Data Applications |
|
CALYPSO |
2006 |
Study clouds and aerosols in the Earth’s atmosphere [24] |
LiDAR technology for vertical profiling of clouds and aerosols |
Climate research, Weather forecasting |
|
GEDI |
2018 |
Measure Earth’s forests in 3D [25] |
High-resolution LiDAR data from the ISS [26] |
Forest structure, carbon cycle, biodiversity [27] |
|
ICESat-1 |
2003 |
Measure polar ice sheet thickness and cloud properties [28] |
Laser altimeter for precise elevation measurements |
Ice sheet monitoring, climate change research |
|
ICESat-2 |
2018 |
Continue and enhance measurements from ICESat-1 |
Advanced Topographic Laser Altimeter System (ATLAS) [29] |
Improved ice sheet, cloud, and land elevation data [30] |
LiDAR is adequate for mapping forest structures, measuring canopy height, and assessing vegetation density.
Principle of Operation: LiDAR emits laser pulses and measures the time the pulse travels to the target and returns to the sensor. The time interval can be turned into a distance measurement by knowing the speed of light. LiDAR sensors can shoot laser pulses rapidly, allowing them to collect many data points across the measured region [19].
Point Cloud Data: The output of LiDAR is a point cloud, a collection of millions or billions of individual data points in three-dimensional space that LiDAR produces. Each point in the point cloud represents a precise position on the Earth’s surface and elevation data. LiDAR point clouds contain excellent spatial resolution and detailed representations of topography, vegetation, buildings, and other things [20].
The Cloud-Aerosol Lidar and Infrared Pathfinder Satellite Observations (CALIPSO), Global Ecosystem Dynamics Investigation (GEDI) and Ice, Cloud, and land Elevation Satellite (ICESat) are primary NASA missions that utilise LiDAR technology in remote sensing for Earth observation which provides open-source remotely sensed data for analysis [21-23]. Table 1 highlights these missions briefly.
3.3 Spaceborne radar technology
Radar (Radio Detection and Ranging) analyses reflected signals to detect and quantify the qualities of objects [31]. Radar systems onboard satellites to monitor and measure numerous phenomena on Earth’s surface and atmosphere are called spaceborne radar technology.
Radar also measures the Doppler shift in the frequency of reflected signals to determine the target’s velocity. Spaceborne radar has a wide range of applications across various scientific disciplines, as follows:
1) Earth Observation: Mapping surface properties such as topography, vegetation, and land cover changes. This is particularly relevant for environmental studies, disaster management, and land-use monitoring [32].
2) Weather and Climate: Detecting precipitation, storms, and atmospheric dynamics to support weather forecasting and climate trend analysis [33].
3) Oceanography: Measures water surface phenomena such as waves, currents, and wind speed and direction. It contributes to oceanic research, coastal monitoring, and maritime navigation [34].
4) Glaciology: Monitoring ice sheet thickness and surface changes and detecting glacial dynamics, contributing to research on polar regions and climate change [35, 36].
Table 2. RADAR technology-based earth observation missions
|
Mission |
Launch Date |
Primary Objective |
Key Features |
Data Applications |
|
GPM |
2014 |
Measure global precipitation [37, 38] |
Dual-frequency Precipitation Radar (DPR) [39] |
Weather forecasting, climate research, hydrology [40] |
|
SMAP |
2015 |
Measure soil moisture and freeze/thaw states [41] |
L-Band Radar and Radiometer for high-resolution soil moisture data |
Agriculture, water resource management, climate studies [42] |
Synthetic Aperture Radar (SAR), a widely employed spaceborne radar method, enhances imaging capabilities by simulating a large antenna aperture through satellite motion. SAR enables high-resolution imaging and provides valuable data for research in Earth system sciences, including interferometry and polarimetry techniques used to extract geophysical parameters.
The development of radar technology has significantly contributed to missions such as NASA and the Japanese Aerospace Exploration Agency (JAXA) ‘s Global Precipitation Measurement (GPM) and Soil Moisture Active Passive (SMAP), which play critical roles in advancing weather forecasting, hydrology, and soil moisture monitoring for agricultural and water resource management. These missions, summarised in Table 2, demonstrate the integration of radar technologies in addressing Earth observation challenges central to this research.
3.4 Field surveys and validation
Ground-based data collection is essential for validating and calibrating remote sensing data. Field surveys help ensure the accuracy of satellite and airborne measurements by providing on-the-ground observations.
Field surveys and Field Expeditions include direct observations and measurements done by humans using sampling equipment such as binoculars, cameras, etc. Field surveys can investigate various environmental phenomena, including plant and animal habitats, terrain study, water quality, soil characteristics, etc., as shown in Figure 3.
Figure 3. Field survey types concerning earth system
Figure 4. Himalayan Expedition 2021 at Ladakh: (a)The researchers studying sand ramp formation; (b)One of the researchers pointed out a distant landscape to know more about it; (c)Two researchers are discussing the stone sample collected for geological study; (d)The Senior Geo-scientist explained Tso Kar Terrain and sketched the landscape with note-taking significant insights; (e)Few explorers collect water samples, which portrays team spirit and cooperation; (f)Visiting the site to collect data from the mountain valley; (g)Soil characteristics measuring scale for field data collection
Depending on the extent and complexity of the study, field expeditions can be undertaken by a single researcher or a team of researchers, especially embarking on field expeditions, as seen in Figure 4. Field Surveys are typically conducted regularly, such as daily, weekly, or monthly, to track changes over a particular time or season.
Field surveys and expeditions can be time-consuming and labour-intensive, but they can yield valuable data and insights that remote sensing approaches cannot supply. They can also confirm and enhance remotely sensed spatial data, ensuring environmental monitoring and research accuracy and dependability.
The accessibility of information technology infrastructures, such as mobile phones and affordable sensors for data gathering and reporting, propels the surge in citizen science development. The internet facilitates seamless data sharing, while cloud storage solutions are pivotal in hosting and storing information.
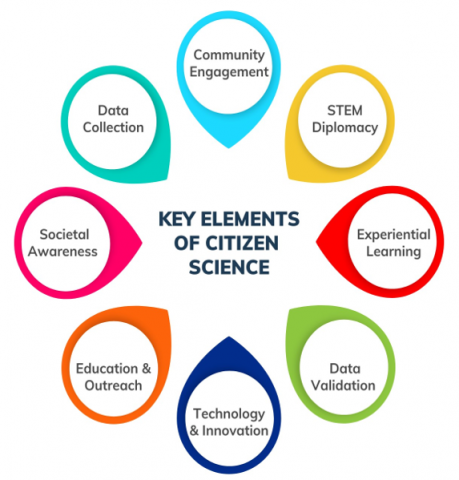
Figure 5 illustrates the integral components of citizen science. Collectively, these elements form a robust foundation. Table 3 delves into the importance of citizen science, emphasising the key components outlined in Figure 5.
Figure 5. Key elements of citizen science
Emerging as a promising avenue for environmental research, citizen science is propelled by increasing interest from governmental and research sectors. Despite high expectations, a notable gap exists between anticipated and actual impacts. Understanding the pathways through which citizen science drives environmental change is essential to address this disparity. Six key pathways are identified: environmental management, policy support, behaviour change, social advocacy, political influence, and community action. The recent study underscores the intricate interplay between project attributes and participant needs. A framework is proposed, delineating four distinct citizen science approaches: localised community engagement, specialised interest exploration, educational research endeavours, and large-scale data collection initiatives [43].
Table 3. Elements of citizen science
|
Elements |
Significance |
|
Community Engagement |
Establishes a strong connection between the public and scientific research, fostering a sense of shared responsibility. |
|
STEM Diplomacy |
Integrates science, technology, engineering, and mathematics, promoting international cooperation. |
|
Experiential Learning |
Empowers individuals through direct involvement in scientific research, contributing to hands-on education. |
|
Data Validation |
Ensures the reliability of information collected by participants, enhancing the credibility of scientific findings. |
|
Technology and Innovation |
Leverages modern tools for efficient data collection and problem-solving, enhancing the overall research process. |
|
Education and Outreach |
Enhances public awareness and scientific literacy, promoting engagement and understanding. |
|
Societal Awareness |
Heightens awareness as citizens actively contribute to research, addressing global challenges collectively. |
|
Data Collection |
Underscores the importance of the public’s role in generating valuable scientific insights through active data collection. |
4.1 Youth-focused programs for environmental research
Youth-focused programs exemplify this approach, playing a pivotal role in environmental research by engaging young participants in scientific inquiry and conservation activities. Through hands-on participation in projects, youths contribute to conservation outcomes such as regional resource management and habitat improvement while also developing environmental science initiatives - a combination of understanding, identification with scientific practices, and belief in their capacity to enact change. This dual impact enhances youth’s scientific literacy and fosters a sense of ownership and responsibility towards environmental issues, shaping them into future ecological stewards and driving positive environmental change [44].
Citizen science informs management decisions and promotes public involvement in protected area stewardship through various approaches and innovative technologies. By engaging volunteers from diverse backgrounds, this research demonstrates the transformative potential of citizen science in advancing environmental conservation efforts, paving the way for a more inclusive and sustainable approach to environmental management [45].
Citizen science advances scientific understanding and empowers communities to engage in environmental decision-making processes actively. This underscores the transformative potential of citizen science in promoting collaboration, enhancing public awareness, and driving meaningful action towards environmental sustainability [46].
4.2 Citizen science contribution to the United Nations SDGs
Citizen science significantly contributes to various UN Sustainable Development Goals (SDGs) through data collection, monitoring, and community engagement. Citizen science initiatives provide valuable data for SDG indicators, particularly in areas such as biodiversity conservation (SDG 15), urban sustainability (SDG 11), public health (SDG 3), and water management (SDG 6). By engaging citizens in data collection and analysis, these initiatives enhance the effectiveness of environmental research and monitoring, fostering community participation and empowering individuals to contribute to sustainable development efforts globally [47].
Examples of Citizen Science Studies Focusing on SDGs:
To illustrate the impact of citizen science on the SDGs, the following examples highlight studies that have successfully integrated citizen science approaches to address key sustainable development targets.
These studies are included to demonstrate citizen science’s practical applications and significant contributions to achieving various SDGs. They provide concrete examples of how community engagement and citizen-led data collection can enhance environmental monitoring and support sustainable development goals.
4.2.1 Contributions of citizen science to the SDGs
Fraisl et al. [48] examined the contributions of citizen science to the United Nations Sustainable Development Goals and other international agreements and frameworks. This study highlighted how citizen science initiatives can bridge the gap between data availability and the need for timely, relevant, and reliable information to track progress toward the SDGs. The research emphasised that despite the global adoption of the SDGs and the development of a Global Indicator Framework with 231 unique indicators, many countries need help monitoring these indicators due to limited resources and institutional capacity. Citizen science offers a solution by involving local communities in data collection and monitoring efforts, enhancing the capacity to measure progress accurately and supporting the SDGs’ achievement.
4.2.2 Assessing biodiversity and ecosystem service potential of urban green spaces in Ghana
Damptey et al. [49] explored the biodiversity and ecosystem service potential of urban green spaces in Sunyani, Ghana, using citizen science approaches. The study assessed biodiversity levels and ecosystem services in various green spaces, including the University of Energy and Natural Resources Wildlife Sanctuary and Arboretum, Sunyani Parks and Gardens, Sunyani Residency Park, and Sunyani Senior High School Woodlot. Citizen scientists, including community members and children, observed and documented biodiversity (trees, arthropods) and ecosystem services. The findings showed a significant relationship between arthropod communities and vegetation variables, highlighting the importance of urban green spaces in provisioning and regulating services. The study also revealed high awareness among citizen scientists about the value of nature and the threats posed by human activities. This example demonstrates how citizen science can enhance biodiversity monitoring in data-deficient regions and contribute to sustainable urban management.
The intersection of Citizen Science and Earth Observation represents a developing frontier in environmental research, poised to revolutionise how we collect, validate, and interpret data about our planet. With the proliferation of high-resolution satellite imagery and advancements in mobile technology, citizens are increasingly empowered to contribute to scientific endeavours, from data collection to hypothesis generation, bridging the gap between professional scientists and the general public. Their synergy is evident in myriad applications, spanning disaster response, marine ecology, biodiversity monitoring, land cover analysis, forest inventory, and phenological studies. By engaging citizens in these activities, this initiative not only harnesses the collective power of community involvement but also provides invaluable ground-truth observations for calibrating and validating remotely sensed imagery [50]. Figure 6 presents an enhanced framework for earth observation through citizen science.
Figure 6. Enhanced framework for earth observation through citizen science integration
5.1 Proposed enhanced framework for earth observation through citizen science integration
The Proposed Enhanced Framework for Earth Observation through Citizen Science Integration aims to create a synergistic approach to environmental monitoring and research. At the core of this framework is integrating diverse methodologies and data sources, leveraging the strengths of traditional scientific research and community-driven citizen science. The central components of this framework are Citizen Science & Global Engagement, Data Collection & Environmental Monitoring, Collaborative Data Sharing, and Scientific Research & Education. Each component is interconnected, promoting a holistic approach to Earth observation that is more accurate, inclusive, and effective.
Citizen Science & Global Engagement focuses on crowdsourcing data collection and empowering communities. By involving the public in scientific research, this component enhances data accuracy and coverage through ground-truthing spatial data and promotes environmental awareness. Data Collection & Environmental Monitoring ensures high-resolution and accurate data collection, further validating remote sensing data. Collaborative Data Sharing facilitates the exchange of data and best practices across borders, fostering global collaboration and increasing data accessibility.
Finally, Scientific Research & Education advances knowledge and informs policy by analysing collected data and fostering innovation and critical thinking. These components create an amplified knowledge exchange, leading to accelerated scientific discovery and informed climate change and biodiversity conservation decision-making. This integrated framework is innovative and essential for advancing Earth observation capabilities through the active involvement of citizen scientists.
As governments and organisations increasingly recognise the value of citizen-based data, legislative support and technological innovation will play pivotal roles in fully integrating citizen science into operational earth observation applications, democratising access to environmental information and catalysing collaborative efforts to understand and protect our planet.
The GLOBE Program is an incredible example of how Citizen Science and Earth Observation are integrated to study the environment from Local to Global Approach.
5.2 The GLOBE program
The NASA-sponsored GLOBE (Global Learning and Observations to Benefit the Environment) Program is a global scientific and education initiative encouraging students, teachers, and citizen scientists to participate in Earth observation and environmental monitoring. The program engages participants in ecological data collection and analysis through a hands-on, inquiry-based approach [51].
The GLOBE Program provides students, instructors, and citizen scientists a platform to engage in Earth observation and environmental monitoring. The program improves scientific literacy, encourages a better understanding of Earth’s systems, and contributes to global environmental research and awareness by involving people in data collecting, analysis, and sharing [17, 52]. By embracing a hands-on approach to inquiry, participants are actively encouraged to engage in local investigations guided by GLOBE Protocols [53]. These protocols are rigorously developed and validated by a global community of scientists to ensure their scientific reliability and accuracy. They cover five fundamental fields: atmosphere, biosphere, hydrosphere, soil (pedosphere), and Earth as a system.
These meticulous measurements, aligned with GLOBE Protocols [54], are integral to creating a global resource for scientific inquiry and play a crucial role as ground truth for NASA satellite data products, particularly in areas such as clouds and soil moisture. The GLOBE Protocols are a guiding framework that promotes observation consistency and reliability and contributes to local understanding and broader scientific endeavors.
Table 4 briefly overviews the GLOBE Program’s earth observation approach. It explores protocols and measurements, citizen science, data entry and sharing, technology and tools, collaboration, and local and global research.
Table 4. Key aspects of the GLOBE program
|
Aspect |
Description |
|
Protocols and Measurements |
The GLOBE Program standardizes data gathering techniques as GLOBE Protocols in Earth science realms such as the atmosphere, biosphere, hydrosphere, and pedosphere (soil). Specific measurements and methodologies for observing environmental indicators such as temperature, precipitation, cloud cover, soil moisture, vegetation, and water quality are outlined in these protocols [55]. |
|
Citizen Science |
The GLOBE Program actively involves students, teachers, general citizens, and scientists/researchers in data collection and observation activities. The techniques are taught to the individuals, and they use scientifically rigorous approaches to collect data from their local environments. This citizen science approach enables the collection of vast amounts of Earth observation data from various geographic regions [17, 55]. |
|
Data Entry and Sharing |
GLOBE Members enter their collected data into the GLOBE database, which stores it and makes it available for analysis and visualization. The data has been quality-checked and is available for further study and investigation by scientists, academics, and educators. This collaborative approach encourages data sharing and advances our understanding of Earth’s systems [17, 55]. |
|
Technology and Tools |
The GLOBE Program utilizes technology and online tools to facilitate data entry, analysis, and visualization. People can use their smartphones to take and submit observations using the GLOBE Observer mobile app. The GLOBE Visualization System (GVS) is a set of interactive tools for exploring and analyzing GLOBE data via maps, graphs, and visualizations [55]. |
|
Collaboration and Research |
The GLOBE Program promotes collaboration among scientists, educators, and students. The data produced aids scientific study and can be used to validate and calibrate satellite observations. GLOBE also invites students to design their research topics and inquiries utilizing GLOBE data and fosters joint research projects [17, 55]. |
5.3 NASA GLOBE protocols for environmental monitoring
As shown in Figure 7, studying the different Earth’s spheres, like the Atmosphere, Biosphere, Hydrosphere, and Pedosphere (Soil), gives us an understanding of the functioning of the Earth’s System.
Table 5 briefly describes each protocol’s purpose and measurement parameters for terrestrial earth observation.
Figure 7. NASA GLOBE Protocols (Credit: NASA-Source: https://eospso.nasa.gov/publications/29)
Table 5. Environmental monitoring GLOBE protocols
|
Protocol |
Measurements |
Purpose |
|
Atmosphere Protocol [55] |
Air temperature, precipitation, humidity, cloud cover, air pressure, wind speed, wind direction |
Assist participants in understanding the dynamics of the Earth’s atmosphere and the variables that influence weather and climate. |
|
Biosphere Protocol [55] |
Plant and animal life cycle observations (leaf growth, flowering, migration patterns), soil properties (temperature, moisture content) |
Help participants better understand the relationships between living species and their surroundings. |
|
Hydrosphere Protocol [56] |
Water temperature, pH, dissolved oxygen, turbidity |
Help participants understand the properties and dynamics of the Earth’s water systems, including rivers, lakes, and oceans. |
|
Pedosphere Protocol [55] |
Soil temperature, moisture, texture, color |
Help participants understand soil properties and the importance of soils in supporting life on Earth. |
Each protocol contains complete data collection methods, including information on equipment, measuring processes, and data recording. Participants can enter their data into the GLOBE database [55], where scientists and other users can access it for research reasons. Thus, the GLOBE program and associated protocols offer students and citizens a significant opportunity to contribute to global environmental research while gaining hands-on experience in scientific data collecting and analysis [57, 58].
5.4 NASA GLOBE observer app tool
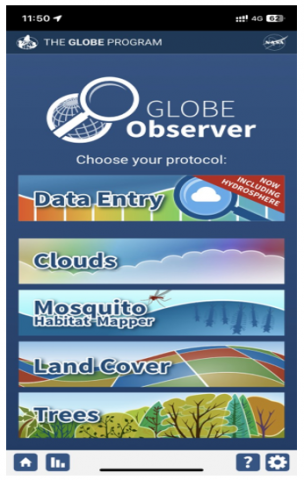
The NASA GLOBE Observer app is a mobile application that allows individuals to participate in Earth science studies by gathering environmental observations. Figure 8 shows the screenshot of the app. The GLOBE Observer app is part of The GLOBE Program (Global Learning and Observations to Benefit the Environment), which aims to engage people in data gathering and improve our understanding of Earth’s systems [55].
Figure 8. Screenshot of NASA GLOBE observer app
1) Data Collection: The GLOBE Observer app features an easy-to-use interface for collecting environmental observations. Users can participate in various campaigns and protocols, such as cloud observations, mosquito habitat mapping, land cover classification, tree height measuring, and more. Each procedure provides step-by-step instructions and visual assistance to ensure correct data collection. Figure 8 shows the screenshot of the app, which has different data collection sections with which to interact.
2) Integration of Mobile Sensors: The software uses smartphone sensors to collect extra data. The cloud observations protocol, for example, captures images of the sky using the phone’s camera. In contrast, the land cover classification protocol uses the GPS and camera to detect the user’s location and acquire photos of the surrounding environment.
3) Educational Resources: The app contains educational resources and interactive elements to improve learning and engagement. Through forums and social media, users can learn about the science underlying each protocol, discover educational materials, and engage with a community of GLOBE scientists.
4) Data Visualization: The app collects observations, visualises them on maps, and makes them available for public viewing. Users can investigate their findings and those supplied by others, allowing them to visualise global patterns and trends in environmental data [59].
5) Continuous Updates and Campaigns: The GLOBE Observer app’s procedures and campaigns are frequently updated to reflect current scientific research objectives and environmental issues. New initiatives allow citizen scientists to contribute to specific research fields and address urgent ecological challenges.
Individuals can use the NASA GLOBE Observer app to actively participate in Earth science research and contribute to our understanding of the environment. The app makes it easier for citizen scientists to collect vital data and contribute to global environmental monitoring initiatives by using the accessibility and capabilities of smartphones [57].
Geospatial tools and techniques provide the framework for Earth observation analysis, offering vital insights into environmental processes, land cover changes, disaster monitoring, and other uses. The data needs, analysis objectives and user skills determine the choice of specific tools and techniques.
OpenForis and Giovanni are selected for review study due to their significant contributions and capabilities in facilitating Earth observation analysis. OpenForis is a suite of open-source tools designed for collecting, managing, and analysing environmental data. It is an invaluable resource for researchers and practitioners in field data collection and land cover analysis. On the other hand, Giovanni provides access to a wide range of Earth science data sets and analysis tools, allowing users to explore and visualise environmental processes and phenomena easily. Both platforms offer user-friendly interfaces and advanced analytical capabilities, making them suitable choices for addressing the diverse data needs and analysis objectives in Earth observation research. Additionally, their open-access nature promotes collaboration and knowledge sharing within the scientific community, further justifying their significance behind the selection for the review study.
6.1 Open Foris suite
Open Foris is a suite of open-source software tools created by the United Nations Food and Agriculture Organisation (FAO). Its purpose is to monitor the forest, collect data, and analyse it [60]. Below are the Open Foris’ primary features discussed briefly:
1) Collect Earth: This tool allows users to collect reliable and efficient land monitoring and assessment data. It uses satellite photos and high-resolution aerial photographs to enable users to define sample locations and collect ground-based data using an intuitive interface [61].
2) Open Foris Calc: It is a data analysis and processing software tool. It has several functions for analysing, aggregating, and summarising data. It offers statistical calculations, transformations, and spatial analysis to obtain relevant insights from acquired data.
3) Open Foris Geospatial Toolkit: This toolkit is a set of tools for geospatial analysis. It comprises geographic data processing, interpolation, raster analysis, and map algebra functions. It allows users to do advanced geospatial analysis activities on remote sensing data and other spatial information.
4) Open Foris SEPAL: SEPAL (System for Earth Observation Data Access, Processing, and Analysis for Land Monitoring) is a cloud-based platform within Open Foris. It provides users access to various remote sensing data, picture processing, and analysis capabilities. SEPAL enables advanced image analysis, categorisation, and change detection on large-scale satellite imagery collections.
5) Forest Assessment: Open Foris provides forest assessment tools and procedures, such as forest inventory and monitoring. It facilitates data gathering on forest cover, tree species, biomass, and other critical metrics for monitoring forest health, carbon stocks, and biodiversity [62].
6) Collaborative Data Sharing: Open Foris encourages collaborative data sharing and provides tools for data administration, sharing, and visualisation. It enables users to publish and distribute collected data, analysis results, and maps to other stakeholders and the larger community [63].
7) Integration and Customization: Open Foris is intended to be expandable and compatible with various tools and systems. It enables interoperability with existing GIS software, databases, and data repositories by supporting data interchange via standard formats and protocols. Its open-source nature also allows for customisation and extension.
The Earth Map Tool [64], part of the Open Foris Suite, is a comprehensive platform for visualising and analysing diverse spatial and environmental data. The interface, as shown in Figure 9, provides various features that facilitate in-depth ecological analysis and research. Users can begin by selecting specific areas of interest (AoI), allowing them to focus their analysis on predefined geographical regions. This flexibility supports tailored studies at local, regional, or global scales.
Figure 9. Interface of OpenForis - Earth map platform where the area of interest selected is European Union for demonstration purpose
The tool offers numerous data layers categorised under themes such as agriculture, biodiversity, climate, climate projections, emissions, fire, forestry, geophysical, hydrology, vegetation, imagery, etc. Users can filter and select the layers most relevant to their research needs. This extensive range of options ensures that researchers can access and integrate various data types to support comprehensive environmental studies.
Users can choose specific data variables and parameters in the’ Insights’ panel, such as maximum temperature, precipitation, soil moisture, etc. The tool allows for temporal aggregation, enabling data analysis on an annual or monthly basis. Once the desired parameters are set, the Earth Map Tool processes the data to generate visual outputs. For example, a temporal plot might display trends in temperature changes, precipitation patterns, or vegetation growth over time, with visualisations including mean values and trend lines to provide insights into temporal changes and patterns for the selected Area of Interest.
Additionally, the tool includes options for opening the area of interest with different analytical tools, running custom scripts for advanced data processing, and exporting visualisations for further analysis or reporting.
The Earth Map Tool empowers researchers, policymakers, and environmentalists by providing access to high-quality spatial data and advanced analytical tools [64]. It supports comprehensive environmental monitoring and research, enabling users to study various phenomena, from climate change and biodiversity loss to agricultural productivity and water resource management. The Earth Map Tool fosters a more inclusive and innovative scientific community through open access to these tools and data, promoting informed decision-making and impactful research across diverse regions and disciplines.
By providing accessible and user-friendly tools for data gathering, analysis, and visualisation, Open Foris intends to help sustainable forest management, biodiversity conservation, and land monitoring. Its open-source nature encourages cooperation and allows organisations and individuals to alter and enhance the earth observation to meet their needs and objectives [62, 65].
6.2 NASA Giovanni
NASA Giovanni is an acronym for "Goddard Earth Sciences Data and Information Services Centre (GES DISC) Interactive Online Visualisation and Analysis Infrastructure.” It is a web-based platform that allows users to access, visualise, and analyse data sets from multiple satellite missions and models. Giovanni offers user-friendly interactive tools and visualisations for exploring and analysing data [66, 67]. Key features of Giovanni include:
1) Data Access: Giovanni gives you access to a massive library of NASA Earth science data from satellites, including atmospheric [68], oceanic, terrestrial, and climate data [69, 70].
2) Visualisation: To better comprehend and analyse the information, users can build maps, time series, scatterplots, and other visualisations of the specified data sets.
3) Analysis Tools: Giovanni provides fundamental analytic functions such as data sub-setting, averaging, anomaly calculation, and statistical comparisons.
4) User-Friendly Interface: The platform is user-friendly, allowing researchers, students, and other users to interact with Earth science data without requiring substantial programming or technical knowledge.
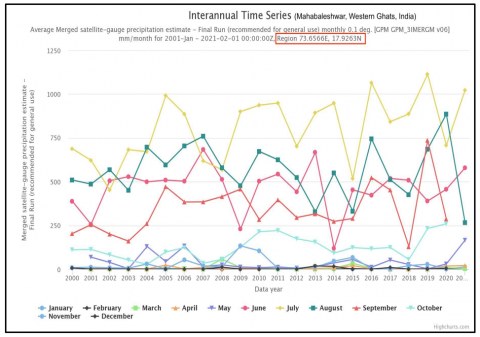
Giovanni provides interactive visualisation tools that let users explore and analyse GPM data by creating maps, among other visualisations [67, 71].
Figure 10 depicts the GPM Data Time Series for Mahabaleshwar Hill Station. This shows the average yearly and monthly rainfall from 2001 to 2020. Interannual and seasonal variability is significant in the precipitation of the graph. For example, the more substantial rain during the monsoon months, June to September, is associated with the Indian Summer Monsoon, driven by large-scale atmospheric circulation patterns and the orographic effects of the Western Ghats. Conversely, less precipitation in other months is attributed to the retreat of the monsoon and dry conditions. These variations have critical implications for water resource management, agriculture, and local climate dynamics in the region and thus require further investigation into the underlying mechanisms and long-term trends.
Figure 10. GPM time series data of Mahabaleshwar, India (Generated from NASA Giovanni tool)
This review study provides insights into future opportunities for research and development in Earth observation and environmental monitoring. Some of the potential opportunities are highlighted in Table 6.
Table 6. Critical analysis major highlights
|
Opportunities |
Description |
|
Integration of multiple data sources |
Emphasizes the significance of combining diverse data sources (e.g., ground-based observations, satellite imagery, citizen science) to enhance accuracy and efficiency in environmental monitoring. |
|
Advancements in remote sensing technology |
Explores the potential of newer technologies like hyperspectral imaging, LiDAR, and RADAR in providing more detailed and precise data for environmental research and monitoring. |
|
Easier use of machine learning and AI |
Highlights the potential of machine learning and artificial intelligence in simplifying the analysis of large datasets for identifying patterns in environmental data, making it accessible to a wider audience. |
|
Citizen science and community engagement |
Stresses the importance of involving the public in environmental research through citizen science and suggests the need for innovative engagement methods to bolster community participation. |
|
Climate change adaptation and mitigation |
Addresses the critical role of Earth observation in tackling pressing environmental issues like climate change and underscores the need for novel approaches in adaptation and mitigation strategies. |
Overall, this review study provides valuable insights into the current state of Earth observation and environmental monitoring and suggests several potential opportunities for future research and development in this field. By combining the tools above, approaches, and remote sensing data, we propose a unique methodology for our research to study the influential parameters affecting biodiversity hotspots.
7.1 Future directions: A proposed methodology for ecological study
Ecological studies require careful site selection within a 1-3km radius, adaptable based on geography and research goals. Key steps include using Earth Map to analyse elevation, climate dynamics, and ecological metrics (e.g., precipitation, temperature, and vegetation indices). Monthly time series analyses help identify trends, while stakeholder inputs validate findings. The parameters identified are then linked to ecosystem impacts, with control sites selected for comparison to assess their influence comprehensively. This leads us to develop three models. Model 1 focuses on correlation analysis. Model 2 builds upon these findings, and Model 3 provides an understanding by aggregating all results (Figures 11-13, respectively).
Model 3 is then the final stage of this analysis, synthesising the model outputs from Model 1 and Model 2 to further understand the study region’s ecological climate dynamics. Unlike a simple aggregation of results, Model 3 performs an integrative role between the associations obtained in Model 1 and the validated parameters and ecosystem interactions obtained in Model 2. This integration facilitates moving beyond isolated parameter relationships to understand the overarching impacts on the ecosystem, particularly within biodiversity hotspots.
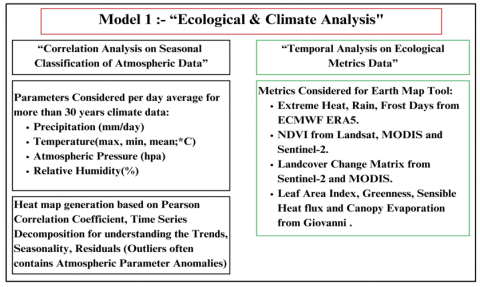
Model 1 is the starting point for logical progression, as it establishes correlations between climate parameters such as temperature, precipitation, relative humidity, and atmospheric pressure with ecological metrics like NDVI, land cover change, and surface temperature. This step provides a basic understanding of how climatic factors influence ecosystem components over time. Model 2 advances these findings to validate through field visits and stakeholder insights but still provides an added layer of analysis that aims to determine key influential parameters and their dependencies within the ecosystem. Comparing this study site to some control areas less affected by identified parameters, Model 2 ensures that impacts are robust and contextual.
Figure 11. Model 1 focused on selected parameters analysis
Figure 12. Model 2 focused on validating results from Model 1, further cross-analysis with selected control sites, and quantifying the impact factor of influential parameters
Figure 13. Model 3 possesses the outcome from Model 1 and Model 2 results
Model 3 takes these validated relationships and builds an integrated analysis to quantify influential parameters’ cumulative and individual effects on the ecosystem. This will include an analysis of interactions and influences on biodiversity, vegetation health, and changes in land cover over time. For instance, the combined impacts of extreme temperature events and reduced precipitation can be assessed through integrated analysis to determine their effects on vegetation productivity and habitat integrity. Spatial and temporal assessments are also done to identify trends in change both within and between control sites, providing a clearer picture of the magnitude and severity of the ecological impacts. Predictive modeling simulates future scenarios, such as the increased frequency of extreme weather events, which can accelerate the loss of vegetation or habitat fragmentation.
The outputs from Model 3 include detailed assessments of changes in ecosystems, thematic maps that represent key impacts, and actionable insights that can be used for biodiversity conservation. These insights are not descriptive but are quantitatively grounded, ensuring that the results will inform targeted conservation strategies. Notably, the logical framework of Model 3 provides that the study evolves from understanding parameter associations (Model 1) to validating and contextualising their impacts (Model 2), which can then further be integrated into a system-level perspective (Model 3). This progression through methodological rigour addresses specific research questions and provides a transferable framework for similar studies elsewhere.
Ultimately, Model 3 is not a product but the result of a systematic and iterative research process established through Model 1 and Model 2. Synthesising these findings, Model 3 delivers an actionable understanding of the ecological impacts of climatic parameters, specifically at biodiversity hotspots and ecosystem resilience. This ensures that the results are scientifically robust, practically relevant, and logically aligned with the broader objectives of ecological research.
The ultimate objective is to create a model that evaluates the impact of identified parameters in both minimal influence situations. By adopting this methodology, we unveil unidentified parameters and gain a comprehensive understanding of the intricate climate and vegetation dynamics within the selected study areas. Remarkably, this approach allows us to achieve these outcomes without additional financial resources. Our proposed methodology focuses on investigating the influence of climate change on biodiversity hotspots and ecosystems.
This comprehensive review summarises terrestrial earth observation methods, remote sensing, and the significance of citizen science. The review highlights the wide range of Earth observation tools and techniques employed in ecological research. Integrating multiple data sources and different earth observation methods is emphasised to enhance the accuracy and efficiency of remote sensing applications. Furthermore, the review focuses on the significant role of citizen science and mobile technology in collecting environmental observations and contributing to global environmental monitoring initiatives. The study recognises the importance of engaging the general public in data collection efforts, which can provide valuable insights into ecological patterns and contribute to broader conservation efforts.
The review identifies several areas for future research and improvement in integrating different earth observation methods into ecological studies. These include refining and expanding remote sensing technologies, harnessing the potential of field study, and further integrating citizen science approaches into environmental monitoring initiatives. Overall, this review paper is a valuable resource for scientists, researchers, and students in earth sciences. It provides a comprehensive understanding of the current state of knowledge and highlights the potential for advancements in remote sensing applications for ecological research.
The study anticipates that the forthcoming results obtained through this proposed methodology will revolutionise scientific research by providing valuable insights even with limited budgets or self-funded projects. The methodology proposed can be tailored to explore specific environmental and climate parameters, enabling researchers to uncover concealed yet consequential factors that often receive inadequate attention. The proposed method aims to enhance the quality of limited-budget or self-funded research projects by leveraging open-source tools and data. Researchers can achieve higher-quality outcomes and make significant discoveries by strategically utilising available resources. This approach improves the overall quality of research and promotes inclusivity by encouraging individuals from low-income and advanced countries, where most citizen science projects have been conducted with substantial support, to engage in earth science research projects and explore uncharted territories. By democratising access to tools and data, this methodology paves the way for a more diverse and innovative scientific community, fostering ground-breaking advancements in earth science.
[1] Loreau, M., De Mazancourt, C. (2013). Biodiversity and ecosystem stability: A synthesis of underlying mechanisms. Ecology Letters, 16: 106-115. https://doi.org/10.1111/ele.12073
[2] Weiskopf, S.R., Rubenstein, M.A., Crozier, L.G., Gaichas, S., Griffis, R., Halofsky, J.E., Hyde, K.J.W., Morelli, T.L., Morisette, J.T., Muñoz, R.C., Pershing, A.J., Peterson, D.L., Poudel, R., Staudinger, M.D., Sutton-Grier, A.E., Thompson, L., Vose, J., Weltzin, J.F., Whyte, K.P. (2020). Climate change effects on biodiversity, ecosystems, ecosystem services, and natural resource management in the United States. Science of the Total Environment, 733: 137782. https://doi.org/10.1016/j.scitotenv.2020.137782
[3] Siddig, A.A., Ellison, A.M., Ochs, A., Villar-Leeman, C., Lau, M.K. (2016). How do ecologists select and use indicator species to monitor ecological change? Insights from 14 years of publication in Ecological Indicators. Ecological Indicators, 60: 223-230. https://doi.org/10.1016/j.ecolind.2015.06.036
[4] Oguh, C.E., Obiwulu, E.N.O., Umezinwa, O.J., Ameh, S.E., Ugwu, C.V., Sheshi, I.M. (2021). Ecosystem and ecological services; need for biodiversity conservation-A critical review. Asian Journal of Biology, 11(4): 1-14. https://doi.org/10.9734/ajob/2021/v11i430146
[5] Nogués-Bravo, D., Rodríguez-Sánchez, F., Orsini, L., de Boer, E., Jansson, R., Morlon, H., Fordham, D.A., Jackson, S.T. (2018). Cracking the code of biodiversity responses to past climate change. Trends in Ecology & Evolution, 33(10): 765-776. https://doi.org/10.1016/j.tree.2018.07.005
[6] Hisano, M., Searle, E.B., Chen, H.Y. (2018). Biodiversity as a solution to mitigate climate change impacts on the functioning of forest ecosystems. Biological Reviews, 93(1): 439-456. https://doi.org/10.1111/brv.12351
[7] Marchese, C. (2015). Biodiversity hotspots: A shortcut for a more complicated concept. Global Ecology and Conservation, 3: 297-309. https://doi.org/10.1016/j.gecco.2014.12.008
[8] CEPF, Biodiversity hotspots defined-cepf. URL. https://www.cepf.net/our-work/biodiversity-hotspots/hotspots-defined.
[9] Stephenson, P.J. (2020). Technological advances in biodiversity monitoring: Applicability, opportunities and challenges. Current Opinion in Environmental Sustainability, 45: 36-41. https://doi.org/10.1016/j.cosust.2020.08.005
[10] Anderson, K., Ryan, B., Sonntag, W., Kavvada, A., Friedl, L. (2017). Earth observation in service of the 2030 agenda for sustainable development. Geo-Spatial Information Science, 20(2): 77-96. https://doi.org/10.1080/10095020.2017.1333230
[11] Mehta, A., McCartney, S., Adamo, S., Insaf, T., Filiault, C., Kuzma, S., Nilson, E., Saccoccia, L., Schleifer, L., Snyder, A. (2019). ARSET - Earth observations for disaster risk assessment & resilience. https://appliedsciences.nasa.gov/join-mission/training/english/arset-earth-observations-disaster-risk-assessment-resilience.
[12] Lillesand, T., Kiefer, R.W., Chipman, J. (2015). Remote Sensing and Image Interpretation. John Wiley & Sons. https://dl.acm.org/doi/10.5555/1215632.
[13] Jensen, J.R. (2009). Remote sensing of the environment: An earth resource perspective 2/e. Pearson Education India.
[14] Lin, S.K. (2011). Introduction to remote sensing. fifth edition. edited by jamesb. Campbell and Randolph H. Wynne, the Guilford Press. Remote Sensing, 5(1): 282-283. https://doi.org/10.3390/rs5010282
[15] Su, Y., Guo, Q., Fry, D.L., Collins, B.M., Kelly, M., Flanagan, J.P., Battles, J.J. (2016). A vegetation mapping strategy for conifer forests by combining airborne LiDAR data and aerial imagery. Canadian Journal of Remote Sensing, 42(1): 1-15. https://doi.org/10.1080/07038992.2016.1131114
[16] Krankina, O.N., Pflugmacher, D., Hayes, D.J., McGuire, A.D., Hansen, M.C., Häme, T., Elsakov, V., Nelson, P. (2011). Vegetation cover in the eurasian arctic: Distribution, monitoring, and role in carbon cycling. In Eurasian Arctic Land Cover and Land Use in A Changing Climate, pp. 79-108. https://doi.org/10.1007/978-90-481-9118-5_5
[17] Enterkine, J., Campbell, B.A., Kohl, H., Glenn, N.F., Weaver, K., Overoye, D., Danke, D. (2022). The potential of citizen science data to complement satellite and airborne lidar tree height measurements: Lessons from The GLOBE Program. Environmental Research Letters, 17(7): 075003. https://doi.org/10.1088/1748-9326/ac77a2
[18] Beland, M., Parker, G., Sparrow, B., Harding, D., Chasmer, L., Phinn, S., Antonarakis, A., Strahler, A. (2019). On promoting the use of lidar systems in forest ecosystem research. Forest Ecology and Management, 450: 117484. https://doi.org/10.1016/j.foreco.2019.117484
[19] Senf, C. (2022). Seeing the system from above: The use and potential of remote sensing for studying ecosystem dynamics. Ecosystems, 25(8): 1719-1737. https://doi.org/10.1007/s10021-022-00777-2
[20] Guo, Q., Su, Y., Hu, T., Guan, H., Jin, S., Zhang, J., Zhao, X., Xu, K., Wei, D., Kelly, M., Coops, N.C. (2020). Lidar boosts 3D ecological observations and modelings: A review and perspective. IEEE Geoscience and Remote Sensing Magazine, 9(1): 232-257. https://doi.org/10.1109/MGRS.2020.3032713
[21] Schneider, D.P., Deser, C., Fasullo, J., Trenberth, K.E. (2013). Climate data guide spurs discovery and understanding. Eos, Transactions American Geophysical Union, 94(13): 121-122. https://doi.org/10.1002/2013EO130001
[22] GEDI Overview. https://lpdaac.usgs.gov/data/get-started-data/collection-overview/missions/gedi-overview/.
[23] Khalsa, S.J.S., Borsa, A., Nandigam, V., Phan, M., Lin, K., Crosby, C., Fricker, H., Baru, C., Lopez, L. (2022). OpenAltimetry-rapid analysis and visualization of Spaceborne altimeter data. Earth Science Informatics, 1-10. https://doi.org/10.1007/s12145-020-00520-2
[24] Winker, D.M., Vaughan, M.A., Omar, A., Hu, Y., Powell, K.A., Liu, Z., Hunt, W.H., Young, S.A. (2009). Overview of the CALIPSO mission and CALIOP data processing algorithms. Journal of Atmospheric and Oceanic Technology, 26(11): 2310-2323. https://doi.org/10.1175/2009JTECHA1281.1
[25] Albinet, C., Whitehurst, A.S., Jewell, L.A., Bugbee, K., Laur, H., Murphy, K.J., Frommknecht, B., Scipal, K., Costa, G., Jai, B., Ramachandran, R., Lavalle, M., Duncanson, L. (2019). A joint ESA-NASA multi-mission algorithm and analysis platform (MAAP) for biomass, NISAR, and GEDI. Surveys in Geophysics, 40: 1017-1027. https://doi.org/10.1007/s10712-019-09541-z
[26] Melack, J.M., Hess, L.L. (2023). Areal extent of vegetative cover: A challenge to regional upscaling of methane emissions. Aquatic Botany, 184: 103592. https://doi.org/10.1016/j.aquabot.2022.103592
[27] Potapov, P., Li, X., Hernandez-Serna, A., Tyukavina, A., Hansen, M.C., Kommareddy, A., Pickens, A., Turubanova, S., Tang, H., Silva, C.E., Armston, J., Dubayah, R., Blair, J.B., Hofton, M. (2021). Mapping global forest canopy height through integration of GEDI and Landsat data. Remote Sensing of Environment, 253: 112165. https://doi.org/10.1016/j.rse.2020.112165
[28] Brown, M.E., Arias, S.D., Chesnes, M. (2023). Review of ICESat and ICESat-2 literature to enhance applications discovery. Remote Sensing Applications: Society and Environment, 29: 100874. https://doi.org/10.1016/j.rsase.2022.100874
[29] Neumann, T., Magruder, L., Kurtz, N. (2022). ICESat-2 Mission: Contributions of a spaceborne lidar to ocean science. OCEANS 2022, Hampton Roads, Hampton Roads, VA, USA, 1-5. https://doi.org/10.1109/OCEANS47191.2022.9977260
[30] Campbell, B.A. (2021). ICESat-2 and the Trees Around the GLOBE student research campaign: Looking at Earth’s tree height, one tree at a time. Acta Astronautica, 182: 203-207. https://doi.org/10.1016/j.actaastro.2021.02.002
[31] Chen, F., Lasaponara, R., Masini, N. (2017). An overview of satellite synthetic aperture radar remote sensing in archaeology: From site detection to monitoring. Journal of Cultural Heritage, 23: 5-11. https://doi.org/10.1016/j.culher.2015.05.003
[32] Steele-Dunne, S.C., McNairn, H., Monsivais-Huertero, A., Judge, J., Liu, P.W., Papathanassiou, K. (2017). Radar remote sensing of agricultural canopies: A review. IEEE Journal of Selected Topics in Applied Earth Observations and Remote Sensing, 10(5): 2249-2273. https://doi.org/10.1109/JSTARS.2016.2639043
[33] Falconi, M.T., Marzano, F.S. (2019). Weather radar data processing and atmospheric applications: An overview of tools for monitoring clouds and detecting wind shear. IEEE Signal Processing Magazine, 36(4): 85-97. https://doi.org/10.1109/MSP.2019.2890934
[34] Sankaran, K. (2020). Spaceborne radar remote sensing of ocean surfaces: Electromagnetic modelling and applications. Journal of Electromagnetic Waves and Applications, 34(1): 1-34. https://doi.org/10.1080/09205071.2019.1696237
[35] Eckerstorfer, M., Bühler, Y., Frauenfelder, R., Malnes, E. (2016). Remote sensing of snow avalanches: Recent advances, potential, and limitations. Cold Regions Science and Technology, 121: 126-140. https://doi.org/10.1016/j.coldregions.2015.11.001
[36] Hou, A.Y., Kakar, R.K., Neeck, S., Azarbarzin, A.A., Kummerow, C.D., Kojima, M., Oki, R., Nakamura, K., Iguchi, T. (2014). The global precipitation measurement mission. Bulletin of The American Meteorological Society, 95(5): 701-722. https://doi.org/10.1175/BAMS-D-13-00164.1
[37] Portier, A., Kirschbaum, D., Gebremichael, M., Kemp, E., Kumar, S., Llabres, I., Snodgrass, E., Wegiel, J. (2023). NASA’s global precipitation measurement mission: Leveraging stakeholder engagement & applications activities to inform decision-Making. Remote Sensing Applications: Society and Environment, 29: 100853. https://doi.org/10.1016/j.rsase.2022.100853
[38] Draper, D.W., Newell, D.A., Wentz, F.J., Krimchansky, S., Skofronick-Jackson, G.M. (2015). The global precipitation measurement (GPM) microwave imager (GMI): Instrument overview and early on-orbit performance. IEEE Journal of Selected Topics in Applied Earth Observations and Remote Sensing, 8(7): 3452-3462. https://doi.org/10.1109/JSTARS.2015.2403303
[39] Watters, D., Battaglia, A. (2021). The NASA‐JAXA global precipitation measurement mission-part I: New frontiers in precipitation. Weather, 76(2): 41-44. https://doi.org/10.1002/wea.3865
[40] Mazzoglio, P., Domeneghetti, A., Ceola, S. (2021). Flood detection and monitoring with EO data tools and systems. Earth Observation for Flood Applications, 195-215. https://doi.org/10.1016/B978-0-12-819412-6.00009-2
[41] O’Neill, P., Entekhabi, D., Njoku, E., Kellogg, K. (2010). The NASA soil moisture active passive (SMAP) mission: Overview. In 2010 IEEE International Geoscience and Remote Sensing Symposium, Honolulu, HI, USA, pp. 3236-3239. https://doi.org/10.1109/IGARSS.2010.5652291
[42] Sazib, N., Bolten, J.D., Mladenova, I.E. (2021). Leveraging NASA soil moisture active passive for assessing fire susceptibility and potential impacts over Australia and California. IEEE Journal of Selected Topics in Applied Earth Observations and Remote Sensing, 15: 779-787. https://doi.org/10.1109/JSTARS.2021.3136756
[43] van Noordwijk, T., Bishop, I., Staunton-Lamb, S., Oldfield, A., Loiselle, S., Geoghegan, H., Ceccaroni, L. (2021). Creating positive environmental impact through citizen science. The Science of Citizen Science, 373-395. https://doi.org/10.1007/978-3-030-58278-4_19
[44] Ballard, H.L., Dixon, C.G., Harris, E.M. (2017). Youth-focused citizen science: Examining the role of environmental science learning and agency for conservation. Biological Conservation, 208: 65-75. https://doi.org/10.1016/j.biocon.2016.05.024
[45] Cheung, S.Y., Leung, Y.F., Larson, L.R. (2022). Citizen science as a tool for enhancing recreation research in protected areas: Applications and opportunities. Journal of Environmental Management, 305: 114353. https://doi.org/10.1016/j.jenvman.2021.114353
[46] Turrini, T., Dörler, D., Richter, A., Heigl, F., Bonn, A. (2018). The threefold potential of environmental citizen science-Generating knowledge, creating learning opportunities and enabling civic participation. Biological Conservation, 225: 176-186. https://doi.org/10.1016/j.biocon.2018.03.024
[47] Fraisl, D., Campbell, J., See, L., Wehn, U., Wardlaw, J., Gold, M., Moorthy, I., Arias, R., Piera, J., Oliver, J.L., Masó, J., Penker, M., Fritz, S. (2020). Mapping citizen science contributions to the UN sustainable development goals. Sustainability Science, 15: 1735-1751. https://doi.org/10.1007/s11625-020-00833-7
[48] Fraisl, D., See, L., Campbell, J., Danielsen, F., Andrianandrasana, H.T. (2023). The contributions of citizen science to the United Nations sustainable development goals and other international agreements and frameworks. Citizen Science: Theory and Practice, 8(1): 1-6. https://doi.org/10.5334/cstp.643
[49] Damptey, F.G., Opuni-Frimpong, N.Y., Arimiyaw, A.W., Bentsi-Enchill, F., Wiafe, E.D., Abeyie, B.B., Mensah, M.K., Debrah, D.K., Yeboah, A.O., Opuni-Frimpong, E. (2022). Citizen science approach for assessing the biodiversity and ecosystem service potential of urban green spaces in Ghana. Land, 11(10): 1774. https://doi.org/10.3390/land11101774
[50] Fritz, S., Fonte, C.C., See, L. (2017). The role of citizen science in earth observation. Remote Sensing, 9(4): 357. https://doi.org/10.3390/rs9040357
[51] Kennedy, T.J., Henderson, S. (2003). The GLOBE program: Bringing together students, teachers and scientists to increase scientific understanding of the earth through research. Children, Youth and Environments, 13(2): 217-227. http://www.jstor.org/stable/10.7721/chilyoutenvi.13.2.0217.
[52] Dodson, J.B., Colón Robles, M., Rogerson, T.M., Taylor, J.E. (2023). Do citizen science Intense Observation Periods increase data usability? A deep dive of the NASA GLOBE Clouds data set with satellite comparisons. Earth and Space Science, 10(2): e2021EA002058. https://doi.org/10.1029/2021EA002058
[53] Hayden, L., Taylor, J., Robles, M.C. (2019). GLOBE: Connecting to the community of observers directly to NASA satellites [education]. IEEE Geoscience and Remote Sensing Magazine, 7(1): 98-99. https://doi.org/10.1109/MGRS.2019.2891930
[54] Munyai, L.F., Dondofema, F., Banda, K., Mutoti, M.I., Gumbo, J.R. (2022). Satellite-derived estimation of chlorophyll - A on harmful algal blooms (HABs) in selected dams of Vhembe District, Limpopo Province. International Journal of Environmental Impacts, 5 (4): 362-374. https://doi.org/10.2495/EI-V5-N4-362-374
[55] Kohl, H.A., Nelson, P.V., Pring, J., Weaver, K.L., Wiley, D.M., Danielson, A.B., Cooper, R.M., Mortimer, H., Overoye, D., Burdick, A., Taylor, S., Haley, M., Haley, S., Lange, J., Lindblad, M.E. (2021). GLOBE observer and the GO on a trail data challenge: A citizen science approach to generating a global land cover land use reference dataset. Frontiers in Climate, 3: 620497. https://doi.org/10.3389/fclim.2021.620497
[56] Rast, M., Johannessen, J., Mauser, W. (2014). Review of understanding of Earth’s hydrological cycle: Observations, theory and modelling. Surveys in Geophysics, 35: 491-513. https://doi.org/10.1007/s10712-014-9279-x
[57] Činčera, J., Kroufek, R., Marková, K., Křepelková, Š., Šimonová, P. (2021). The GLOBE program: What factors influence students’ and teachers’ satisfaction with science education. Research in Science & Technological Education, 39(2): 245-261. https://doi.org/10.1080/02635143.2019.1687441
[58] Tapiador, F.J., Navarro, A., Levizzani, V., García-Ortega, E., Huffman, G.J., Kidd, C., Kucera, P.A., Kummerow, C.D., Masunaga, H., Petersen, W.A., Roca, R., Sánchez, J.-L., Tao, W.K., Turk, F.J. (2017). Global precipitation measurements for validating climate models. Atmospheric Research, 197: 1-20. https://doi.org/10.1016/j.atmosres.2017.06.021
[59] Manzanarez, S., Manian, V., Santos, M. (2022). Land use land cover labeling of GLOBE images using a deep learning fusion model. Sensors, 22(18): 6895. https://doi.org/10.3390/s22186895
[60] Tzamtzis, I., Federici, S., Hanle, L. (2019). A methodological approach for a consistent and accurate land representation using the FAO open foris collect earth tool for GHG inventories. Carbon Management, 10(4): 437-450. https://doi.org/10.1080/17583004.2019.1634934
[61] Saah, D., Johnson, G., Ashmall, B., Tondapu, G., Tenneson, K., Patterson, M., Poortinga, A., Markert, K., Quyen, N.H., Aung, K.S., Schlichting, L., Matin, M., Uddin, K., Aryal, R.R., Dilger, J., Ellenburg, W.L., Flores-Anderson, A.I., Wiell, D., Lindquist, E., Goldstein, J., Clinton, N., Chishtie, F. (2019). Collect earth: An online tool for systematic reference data collection in land cover and use applications. Environmental Modelling & Software, 118: 166-171. https://doi.org/10.1016/j.envsoft.2019.05.004
[62] Koskinen, J., Leinonen, U., Vollrath, A., Ortmann, A., Lindquist, E., d’Annunzio, R., Pekkarinen, A., Käyhkö, N. (2019). Participatory mapping of forest plantations with open foris and google earth engine. ISPRS Journal of Photogrammetry and Remote Sensing, 148: 63-74. https://doi.org/10.1016/j.isprsjprs.2018.12.011
[63] Swain, S., Mishra, S.K., Pandey, A., Dayal, D. (2022). Assessment of drought trends and variabilities over the agriculture-dominated Marathwada Region, India. Environmental Monitoring and Assessment, 194(12): 883. https://doi.org/10.1007/s10661-022-10532-8
[64] Morales, C., Díaz, A.S.P., Dionisio, D., Guarnieri, L., Marchi, G., Maniatis, D., Mollicone, D. (2023). Earth map: a novel tool for fast performance of advanced land monitoring and climate assessment. Journal of Remote Sensing, 3: 0003. https://doi.org/10.34133/remotesensing.0003
[65] Jalal, R., Iqbal, Z., Henry, M., Franceschini, G., Islam, M. S., Akhter, M., Khan, Z.T., Hadi, M.A., Hossain, M.A., Mahboob, M.G., Udita, T.S., Aziz, T., Masum, S.M., Costello, L., Saha, C.R., Chowdhury, A.A.M., Salam, A., Shahrin, F., Sumon, F.R., Rahman, M., Siddique, M.A., Rahman, M.M., Jahan, M.N., Shaunak, M.F., Rahman, M.S., Islam, M.R., Mosca, N., D’Ánnunzio, R., Hira, S., Di Gregorio, A. (2019). Toward efficient land cover mapping: An overview of the national land representation system and land cover map 2015 of Bangladesh. IEEE Journal of Selected Topics in Applied Earth Observations and Remote Sensing, 12(10): 3852-3861. https://doi.org/10.1109/JSTARS.2019.2903642
[66] Acker, J.G. (2022). Using the NASA Giovanni system to assess and evaluate remotely-sensed and model data variables relevant to public health issues. In Geospatial Technology for Human Well-being and Health. Cham: Springer International Publishing, pp. 127-149. https://doi.org/10.1007/978-3-030-71377-5_8
[67] Jamali, A.A., Kalkhajeh, R.G., Randhir, T.O., He, S. (2022). Modeling relationship between land surface temperature anomaly and environmental factors using GEE and Giovanni. Journal of Environmental Management, 302: 113970. https://doi.org/10.1016/j.jenvman.2021.113970
[68] Sharifi, E., Brocca, L. (2022). Monitoring precipitation from space: Progress, challenges, and opportunities. Precipitation Science, 239-255. https://doi.org/10.1016/B978-0-12-822973-6.00021-4
[69] Bluestein, H.B., Carr, F.H., Goodman, S.J. (2022). Atmospheric observations of weather and climate. Atmosphere-Ocean, 60(3-4): 149-187. https://doi.org/10.1080/07055900.2022.2082369
[70] Boukabara, S.A., Eyre, J., Anthes, R.A., Holmlund, K., Germain, K.M.S., Hoffman, R.N. (2021). The earth-Observing satellite constellation: A review from a meteorological perspective of a complex, interconnected global system with extensive applications. IEEE Geoscience and Remote Sensing Magazine, 9(3): 26-42. https://doi.org/10.1109/MGRS.2021.3070248
[71] Teng, W., Rui, H., Vollmer, B., de Jeu, R., Fang, F., Lei, G.D., Parinussa, R. (2014). NASA giovanni: A tool for visualizing, analyzing, and intercomparing soil moisture data. Remote Sensing of the Terrestrial Water Cycle, 331-346. https://doi.org/10.1002/9781118872086.ch20