S. M. Sekgobela*![]() | K. Semenya
| K. Semenya![]()
© 2024 The authors. This article is published by IIETA and is licensed under the CC BY 4.0 license (http://creativecommons.org/licenses/by/4.0/).
OPEN ACCESS
The constitution of South Africa states that local government must provide waste management services which includes waste removal, storage and disposal, but local municipalities with combination of urban and rural areas often struggle to find the balance in providing services to both areas. Solid waste collection services are consistent in urban areas than in rural areas. Therefore, this study sought to compare MSWM in gaMothapo and Seshego in PLB, Limpopo, South Africa. To achieve the aim and objectives of this study, mixed method research approach was applied. The approach was in a form of qualitative and quantitative methods which were applied concurrently. Study participants were selected using non-probability convenience sampling for gaMothapo and Seshego households and non-probability purposive sampling for municipal workers. The comparison was based on household demographics, household waste management choices and MSWM services. Structured questionnaires were utilized to arrive at a detailed understanding of how the community of gaMothapo and Seshego manage their solid waste. Semi-structured interviews were utilised to understand how municipality manage solid waste in gaMothapo as compared to Seshego and observations at the collection points were also used to gather more information on solid waste management. This study found that PLB uses different methods to manage waste in gaMothapo and Seshego. The households in Seshego rely mostly on weekly door to door solid waste collection by municipality. The households pay for the waste collection services monthly through rates which are added to the household's municipal bill and are payable to the individual municipal account. Households in gaMothapo are provided with weekly nodal waste collection services for free. Shortage of resources and infrastructure together with lack of community awareness in both areas were found to hinder an effective solid waste management by PLB. The study also determined that PLB prioritise the provision of better waste removal services than waste minimisation through community awareness, recycling and material recovery. This study recommends that waste management awareness in both study areas should be conducted regularly.
collection, community awareness, illegal dumping, municipal solid waste management (MSWM), rural and urban areas, Polokwane Local Municipality (PLM), solid waste disposal and storage
Illegal dumping of solid waste degrades the natural environment, often the dumped trash is caught in runoff and flow into the water bodies where it causes contamination of drinking water suppliers and rivers [1].
According to Department of Environment, Forestry and Fisheries [2], solid waste is regarded as anything that is dispatched to the garbage or disposed of using any method and it consists of organic matter like paper, rags, garden refuse, discarded packages, food scraps, and inorganic matter such as old appliances, furniture, industrial waste and construction rubble.
Management of solid waste in South Africa is considered under the mandate of the Department of Environment, Forestry and Fisheries (DEFF) which is derived from section 24 of the Constitution of the Republic of South Africa (Act 108 of 1996). The act stipulates that everyone has the right to a clean environment which is not harmful to their health and wellbeing.
The gradual increase of waste generated in South Africa, has added to the historical backlog of improper waste services which leads to undesirable living conditions and a contaminated, unhealthy environment [3]. Illegal dumping of solid waste on secluded areas and the sides of the road poses environmental and health threats on the animals and people around the area. Municipal solid waste collection in gaMothapo is irregular while Seshego has a consistent schedule of waste collection. gaMothapo and other rural areas under PLM are largely left to use the unregulated communal waste fills, while others have no place to dump their waste at all. gaMothapo is provided with big communal waste bins which are situated next to the main road, approximately 6Km apart from each other.
Despite the effort by the municipality to provide communal bins, there is no formal schedule for the collection of communal bins, they sometimes overflow with waste and households would start to throw waste on the ground next to the bins or burn waste in the bins. Households situated far from the communal bins continue to dump their waste on the rivers, open field or mountains, while others burn the waste in their backyards. There is a huge variation between different geographical areas within the same municipality, since Seshego rely mostly on landfills for solid waste disposal. These variations pose threat to the environment, human health and animals in the areas.
Most cities in developing countries does not collect all the waste generated by their residents and this has a negative impact on human health and the environment [4]. In developing countries of Asia waste management is the responsibility of municipal government. It is common for residents to dump waste by the roadside or other public places; therefore, these countries prioritise street sweeping as the main element of their waste management system. Street sweeping in urban areas occurs daily. In rural areas the communal bins are placed at the roadsides, and they are collected weekly by the vehicles or the hand carts. Studies found that lack of awareness, technical knowledge, legislation, policies and long-term strategy are major challenges for solid waste management in Asian developing countries [5].
In Philippines waste collection is usually presented as a percentage of waste generation and waste collection frequencies and rates are higher in urban areas or cities than in rural areas. Waste collection coverage ranges from 30% in rural areas to about 70% in highly urbanised cities [6]. In Sri-Lanka solid waste management challenges are related to rapid urbanization and industrialization, therefore the challenges are more serious in urban and semi- urban areas than in rural areas. It is the responsibility of local government to manage solid waste in Sri-Lanka [7]. In Ukraine, National Waste Management Strategy 2030 has been adopted with an intention to prevent generation of waste. The country is in a process of introducing the eco-design of goods consumption and economic mechanisms which encourages the reduction in waste generation. Ukraine is considering waste tax and a ban in the production of polyethylene bags and plastic disposable dishes to support the strategy [8].
Waste management in Africa is characterised by uncontrolled dumping, open burning and limited access to proper landfills [5, 9]. States that administration is one of the major weaknesses of MSWM system in Africa. The most common disposal method in Africa is open dumps and this method either is performed legally or illegally it generates various environmental and health hazards. Fires periodically break out in open dumps, generating smoke and contributing to air pollution. In rural areas the residents either dump their waste at the nearest vacant space, public places, rivers or they burn or burry it in their backyards.
Eighteen percent of households in Accra (Ghana) are rural and they have challenges with uncollected waste. Household store waste in open waste containers such as baskets and plastic bags and they dump their waste in open dumping sites for free. Only 10% of the waste generated in rural areas are properly disposed [10]. Worku and Muchie [11] in Egypt states that municipal solid waste collection is the responsibility of local government, but in big cities such as Cairo, solid waste is collected by subcontractors and Private local and multinational companies. The average rate of waste collection in urban areas is 30-77% and it is close to 90% in Private residential areas. Waste is transported to open dumpsites where waste pickers separate recyclable materials, and the remaining waste is burned or sometimes is left to decompose. There is no proper waste collection and disposal in rural areas of Egypt. Organic waste is used to feed livestock and the non-organic materials are dumped at the roadside, open land or drainage canals. Only few rural municipalities use trucks and tractors to collect solid waste to open dumps [11, 12].
Ethiopia like other developing countries is faced with diverse effects confronting MSWM. Rapid urbanization causes disturbances in the management of municipal solid waste collection, transportation and disposal in most Ethiopian cities. The biggest problem of waste management at community level is lack of manpower, equipment and financial constraints [13]. Solid waste generation rate in Addis Ababa is approximately 0.45kg/day per person. The city generates 3,200 t of solid waste per day which consists 64.8% organic waste and 21. 3% recyclables. There is a door-to-door collection of waste which is facilitated by private sectors, yet only 65% of the waste reaches the city’s dumpsite. The system has improved over the years but, the remaining 8% of solid waste is left to be illegally dumped on the streets, rivers and secluded spots [14]. In South Africa solid waste is governed by different pieces of legislature emanating from the supreme law of the country which is the constitution.
3.1 South African legal framework on solid waste management
The constitution of South Africa states that Local government must provide waste management services which includes waste removal, storage and disposal services as per schedule 5B. Municipalities are encouraged to work with industries and other stakeholders to extend recycling at municipal level and they must also provide additional bins for separation of waste at source, deliver organic waste from landfills and compost it [2]. However, PLM does not provide any additional bins for the households [15]. With effect from 1 July 2009 the South African waste Act of 2008 requires the establishment National Waste Management Strategy (NWMS) to promote cleaner environment, reduce generated waste volumes and invoking the culture of waste reuse, recycle and treatment while land fill disposal is considered as the last resort [16].
In South Africa waste is governed by various pieces of legislation including the following:
-The South African Constitution (Act 108 of 1996)
-Environment Conversation Act (Act 73 of 1989)
-The National Environmental Management Act (Act 107 of 1998)
-Air Quality Act (Act 59 of 2008)
-National Waste Management Strategy
The problem of waste management in South Africa relates to policy enforcement and monitoring the effectiveness caused by scarcity of suitable waste management experts, inefficient logistics and standard practices. Other problems facing the rural and semi-urban waste management in South Africa is the lack of accessible buy back centres to sell the recovered materials, lack of commercially viable and environmentally sustainable recycling projects, inadequate waste volumes generated to sustain recycling initiatives in small rural areas and poor municipal service delivery leading to waste not being collected and it end up being burned, illegally dumped in the rivers and causing degradation of wetland [17]. There are limited number of buy back centres in gaMothapo and Seshego and it makes it difficult for the communities to recycle their waste.
3.2 Solid waste avoidance and reduction
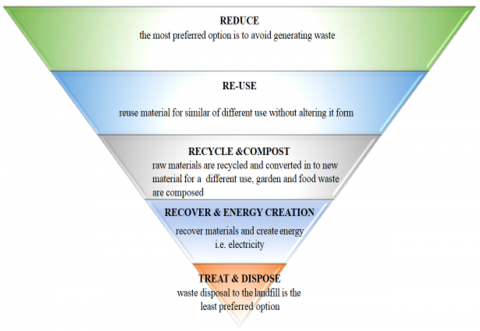
The first and preferable step in the waste hierarchy is to avoid and reduce waste generation. The hierarchy suggests that waste should be avoided in the first place and where it cannot be avoided then generation should be reduced [7, 16]. Defines waste reduction as the design, manufacture, purchase and use of material to reduce quantity or toxicity before reaching the waste stream. One way of achieving these is by increasing recyclability of packaging material that cannot be reduced and the consumer to actually recycle those materials [18].
Figure 1. Waste hierarchy
According to the Department of Environmental affairs, solid waste management should follow a waste hierarchy. Figure 1 represent the waste hierarchy.
3.3 Solid waste generation and storage
Department of Environmental Affairs and Tourism [19] stated that South Africa generated over 42 million tonnes of solid waste every year which is 0,7kg per person per day and these values increased remarkably, in 2017 was 55 million tonnes with 11% diverted to landfills. The rate of solid waste generation in society is increasing with the increase of population, technological development and changes in life styles [14].
South Africa has the largest Industrialised economy in Africa and thus it faces environmental challenges like those of many developed countries. Johannesburg is expected to grow to the status of mega city by 2030 and this implies a higher prospect for increase in waste generation and environmental pollution [15]. Waste generated in PLM is estimated at 0.4-2.5kg per person per day. Generation of waste increases from rural to urban areas and it also increases with the level of income. Rapid population and economic growth together with the rise in community living standards have also proved to increase the rate of municipal solid waste generation in developing areas [20].
3.4 Solid waste collection and transportation
Waste collection is the basic element of any waste management system. Waste collection is an act of picking up waste at homes, businesses, institutions, commercial and industrial areas and other locations and transporting them to a facility for further processing or transfer to disposal site [2]. In South Africa municipalities are tasked with the duty to collect waste in their jurisdictions while private involvement is encouraged in the areas where it is mandatory to pay for waste disposal [21].
Studies found that waste from urban areas in Polokwane is not separated at source and it is mixed in plastic bags. Waste is collected weekly on specific day per area. The collection system in town is effective and there is no refuse bag left by the roadside to litter. Waste is transported to the landfill and 60% of the collected waste could be recycled should the municipality implement a formal recycling programme [22]. There are informal waste pickers at the landfill and they recycled 10% of the collected waste in 2012 and value increased to 25% in 2020 [20].
3.5 Solid waste disposal and recovery
The recovery of material from waste in this study refer to reduce, re-use and recycle. Recovery is important to minimize waste generation and disposal of valuable materials. Reduction of waste at the source is found to reduce pressure on the landfills [23]. Corrêa et al. [24] concludes that the main reason for not recycling in the urban areas is the disposal of waste in the readily available bins and for rural and semi-urban areas is the lack of knowledge. These study holds the view that individuals with better information and awareness are more likely to participate in waste recycling than those without knowledge.
Municipalities throughout South Africa are facing solid waste management and disposal crisis, which is primarily due to lack of landfill capacity. Problems and issues of MSWM is of outmost importance in rapidly urbanizing areas of the developing countries, because rapid population growth overwhelm the capacity for municipalities to provide basic waste management services [25].
Waste disposal in south Africa is mostly in landfills, about 90% of an estimated 59 million tonnes of general waste produced in 2011 ended up in landfills and only 10% was recycled, the figures improved by 2017 where 34.5% of general waste was recovered. Only 5% of waste is disposed of in the designated sites, thus most of the waste in South Africa is disposed in environmentally unsafe sites [26]. Waste in urban areas of PLM is collected from the households and delivered to the waste disposal site [17], there is no formal plan of waste collection in areas such as gaMothapo [22].
The study was conducted in gaMothapo and Seshego in PLM, Limpopo province South Africa. gaMothapo village as a representative for rural communities and Seshego Township as a representative for urban communities of PLM. Seshego has a population of 83.863 and 24 736 households and gaMothapo has a population 26 201 and 6804 households [27].
4.1 Research design
Qualitative and quantitative research methods were used in this study because different methods complement each other and overcome the weakness of a single design [28]. Qualitative methods refer to the research strategies such as participant in-depth interviews, participation, field work and others which allows the researcher to obtain first-hand knowledge on the activity being investigated. Quantitative methods generally involve the use of measuring instruments, observations or experimental studies and survey research, in this study observations were performed. This study adopted a concurrent mixed method design using identical samples for both qualitative and quantitative components. The administration of interviews and questionnaires as well as observations were conducted concurrently. Qualitative methods were used to understand views and perceptions of the participants while quantitative methods were used to quantify the attitudes, opinions, behaviours, and other variables [29].
4.2 Data collection tools and analysis
Primary and secondary data was collected for this study. Primary data was collected through Questionnaires which were self-developed, Key Informant Interviews where the waste management services managers within the municipality were interviewed in order to identify the management and policies of waste collection, storage, transportation, recovery and disposal within the different areas in the municipality and Field Observation were conducted in order to get a deeper insight of how people within the study areas generates and manage their solid waste, observations of the waste disposal methods, waste storage containers municipal waste removal patterns and illegal dumping spots and pictures captured.
Secondary data on solid waste management was collected from censuses, documents from government departments, organisational records, journals, newspapers, books which were randomly chosen through the internet. Research key words were used to search the relevant literature sources. Literature showed matters that needed to be investigated and guided the researcher on which matters to include when constructing the field observation questions [30]. Non probability convenience sampling was used in this study to select accessible respondents followed by a non-probability purposive sampling which was used to select the key informants [28].
Key informants were selected purposively according to their positions within the municipality, i.e., waste management services manager in PLM, waste management supervisor for Seshego and waste management supervisor for gaMothapo. This method was used because the researcher was interested in the respondents who are knowledgeable with the procedures and ways of managing municipal solid waste within the study areas. The sampling frame for the study area one was all 6804 households of gaMothapo village and the sampling frame for study area two was all 24736 households of Seshego [27]. Therefore, the sampling size for study area one was 89 households and sampling size for study area two was 90. Sampling frame and sample size were calculated using 95% confidence level to avoid Type 1 error in the inference and to yield good precision [31].
Quantitative data obtained from the questionnaires (closed-ended questions) was analysed using Statistical Package for the Social Sciences (SPSS) version 26. The results were presented in graphs, tables and charts. The questionnaires were coded 1a -89a for study area 1 (gaMothapo) and 1b - 90b for study area 2 (Seshego), to ensure that one questionnaire was not analysed more than once. Different variables were used during data analysis, each response category had a number associated with it and codes were recorded when data was prepared for analysis. The observed data was presented in pictures [28].
Qualitative data such as open-ended questions from interview scripts were examined thematically to identify common themes (topics, ideas and patterns) of meanings that come repeatedly [32], and they were presented in the form of written discussions. The themes were coded manually using Microsoft Word, and the codes were derived from the research questions.
This section provides a summary of the crucial findings of the study based on the objectives. The objectives were to assess the socio-economic dynamics of households in gaMothapo and Seshego in relation to solid waste management, assess the management of municipal solid waste between gaMothapo and Seshego areas of PLM and to determine the level of community awareness on solid waste management and recycling in gaMothapo and Seshego in PLM.
5.1 Socioeconomic dynamics
The socio-economic dynamics in this study refers to the interaction between the social and economic practices of the participants in relation to waste generation and management. The socio-economic dynamics such as age, gender, household income, household size, marital status and educational level of the respondents in gaMothapo and Seshego were assessed. It was found that in gaMothapo, majority of the respondents were females as compared to Seshego. In both areas majority of the respondents were single, completed high school education, employed and aged between 26-45 years old. In gaMothapo the common household size was found to be 5-6 as compared to 3-4 in Seshego. Households in gaMothapo were found to be earning below the national minimum wage of R3500, mostly they earned below R2000 per month while majority of the respondents in Seshego earned above R6000 per month.
5.2 Interviews
The interviews were conducted with the key stakeholders in waste management section of PLM. Themes emanating from the research objectives were identified and presented as follows.
It was found in this study that respondents in both study areas used plastic as their storage containers. Respondents in Seshego generated plastic waste more than other kinds of waste and in gaMothapo respondents generated different waste types equally. Generally, respondents in both areas did not separate their waste and these could be related to lack of awareness and buy back centres for recyclables. Respondents in gaMothapo rely on different disposal methods of which some of them were unregulated and unhealthy such as burning.
Respondent 1: (waste management superintendent)
gaMothapo has a weekly collection route for skip bins and for waste in selected dumping spots. Waste is disposed temporarily in the two transfer stations situated at Syferkeil and Makotopong where it was sorted for reusable or recyclable materials by informal waste pickers before is taken to the Weltervreden landfill. There are no waste removal fees charged to or paid by households in PLM's rural areas, including gaMothapo.
Respondent 2: (waste management superintendent)
Waste is collected daily in Seshego and disposed at Weltervreden landfill site. There is no transfer station in Seshego. Household solid waste is removed for a fee of approximately R97.37per month for the financial year 2022/2023 and this amount is added to individual household municipal rates. Special waste removal services for business costs R893.51 per removal.
Respondent 3: (waste training manager)
PLM has a budget for community awareness and staff training. There is a specific person internally who is responsible to train new staff or all Staff members if there is a new policy or procedure in place. Municipality in conjunction with the provincial or sometimes with the national office plan and conduct community cleaning campaigns within the area.
5.3 Level of community awareness and recycling
Majority of respondents in gaMothapo did not know anything about waste management services provided by municipality. Mostly they knew about waste management initiatives at the community level such as informal waste collectors, recycling and buyback centres. Majority of residents in Seshego had knowledge of MSWM services in their area and the service that was known by majority was waste collection Services. Majority of the respondents in Seshego did not know of any waste management initiatives at the community level.
Chi square test results revealed that there was a significant association between the level of awareness on MSWM and the choice of waste disposal method, which means the level of awareness had a positive effect and can determine how households chose to dispose their waste. It was further determined that although the respondents in gaMothapo were aware of solid waste management at their community level, majority of them were not involved in those initiatives, while Seshego respondents who were aware of MSWM initiatives at their community level, were involved in those initiatives. Table 1 represent awareness v/s waste disposal methods.
5.4 Illegal dumping
Illegal dumping was found to be a serious challenge to municipality and residents in both areas. Participants in both areas perceive illegal dumping as bad and they had different reasons for dumping their waste illegally. Some of the reasons provided by respondents in gaMothapo is that they did not have any better waste disposal methods and respondents from Seshego did not have enough storage especially when municipality did not manage to collect waste on the day it was expected to be collected. These reasons draw back to the responsibilities of local government to provide households with additional bins.
5.5 Waste management challenges
PLM faces both external and internal challenges regarding solid waste management. Common challenges found in both areas were illegal dumping, lack of community awareness and attitudes towards municipality. Internally both areas were faced with lack or shortage of resources, lack of funds, breakdown and shortage of equipment, lack of infrastructure, staff shortage and rapid population growth.
Table 1. Cross tabulation and Chi-Square test for awareness on MSWM services vs waste disposal methods in gaMothapo and Seshego
|
Variables |
Attributes |
Waste Disposal Methods in gaMothapo |
(p-value) |
(x²) |
||||||
|
|
|
Burn |
Combination |
Bury |
Community dumpsite |
Illegal dumping |
Collected |
Recycle/Reuse |
|
|
|
Awareness on MSWM |
yes |
0 |
10 |
0 |
5 |
0 |
3 |
3 |
0.002 |
20.361 |
|
no |
13 |
27 |
4 |
8 |
10 |
6 |
0 |
|||
|
Variables |
Attributes |
Waste disposal methods in Seshego |
(p-value) |
(x²) |
||||||
|
|
|
Burn |
Combination |
Bury |
Community dumpsite |
Illegal dumping |
Collected |
Recycle/reuse |
|
|
|
Awareness on MSWM |
yes |
27 |
1 |
2 |
43 |
0 |
27 |
1 |
0.000 |
39.422 |
|
no |
1 |
3 |
7 |
5 |
1 |
1 |
3 |
|||
There are different ways of managing solid waste in gaMothapo and Seshego areas of PLM. The Respondents from gaMothapo mostly recycled their waste while respondents from Seshego relied mostly on waste collection by municipality. In this study it was found that lack of funds, shortage of resources including human resources, lack of facilities and infrastructure, lack of community awareness and community attitudes towards waste management were the main challenges hampering the delivery of effective solid waste management services by PLM. Respondents from both areas did not have any waste management training or awareness. It was observed that both study areas had illegal dumping spots where respondents would dump their waste if not collected by the municipality.
This study would not have been completed without the participants from gaMothapo, Seshego and PLM, so I would like to thank them for willingly taking their precious time to participate in this study. Further acknowledgement to University of South Africa Masters and Doctorate bursary (DFS-POSTGRD) for funding this study.
|
R |
Rand (Currency in South Africa) |
|
t |
Tonnes |
|
% |
Percentage |
|
Kg/day |
Kilogram per day |
|
Superscripts |
|
|
p |
Significance value |
|
x² |
Pearson Chi-Square value |
[1] Getahun, T., Mengistie, E., Haddis, A., Wasie, F., Alemayehu, E., Dadi, D., Van Gerven, T., Van der Bruggen, B. (2012). Municipal solid waste generation in growing urban areas in Africa: Current practices and relation to socioeconomic factors in Jimma, Ethiopia. Environmental Monitoring and Assessment, 184: 6337-6345. https://doi.org/10.1007/s10661-011-2423-x
[2] Department of Environment, Forestry and Fisheries (DEFF). (2020). National waste management strategy. https://faolex.fao.org/docs/pdf/saf198615.pdf.
[3] Tassie Wegedie, K. (2018). Household behavior and demand for better solid waste management services: A case of Bahir Dar city, Amhara National Regional Stat, Ethiopia. Adv Recycling Waste Manag, 3(1): 152. https://doi.org/10.4172/2475-7675.1000152
[4] Kassa, Z. (2010). The challenges of solid waste management in urban areas, the case of Debremarkos town. Addis Ababa University, Ethiopia.
[5] Statistics South Africa. (2017). The state of basic service delivery in South Africa: In-depth analysis of the community survey 2016 data. https://www.statssa.gov.za/?p=9701.
[6] Viljoen, J.M., Schenck, C.J., Volschenk, L., Blaauw, P.F., Grobler, L. (2021). Household waste management practices and challenges in a rural remote town in the Hantam Municipality in the Northern Cape, South Africa. Sustainability, 13(11): 5903. https://doi.org/10.3390/su13115903
[7] Natural Hazards Center. (2020). 45th Annual Natural Hazards Research and Applications Workshop, Broomfield, Colorado. https://hazards.colorado.edu/workshop/2020.
[8] Environment People Law (EPL). (2018). The rule of law for the protection of the environment. Web studio. epl.org.ua.
[9] Bello, I.A., Ismail, M.B., Kabbashi, N.A. (2016). Solid waste management in Africa: A review. International Journal of Waste Resources, 6(2): 1-4.
[10] Boateng, S., Amoako, P., Appiah, D.O., Poku, A.A., Garsonu, E.K. (2016). Comparative analysis of households solid waste management in rural and urban Ghana. Journal of Environmental and Public Health, 2016(1): 5780258. https://doi.org/10.1155/2016/5780258
[11] Worku, Y., Muchie, M. (2012). An attempt at quantifying factors that affect efficiency in the management of solid waste produced by commercial businesses in the city of Tshwane, South Africa. Journal of Environmental and Public Health, 2012(1): 165353. https://doi.org/10.1155/2012/165353
[12] Hemmati, S., Fataei, E., Imani, A.A. (2019). Effects of source separation education on solid waste reduction in developing countries (A case study: Ardabil, Iran). The Journal of Solid Waste Technology and Management, 45(3): 267-272. https://doi.org/10.5276/JSWTM/2019.267
[13] Zayani, A. Riad, M. (2010). Solid waste management: Overview and current state in Egypt.
[14] European Electronic Waste. (2022). How much e-waste does Europe generate, recycle and repair. https://www.euronews.com/next.
[15] Maluleke, P.H. (2014). A review of solid waste management practices in Polokwane City. Master's thesis, University of South Africa.
[16] Department of Environmental Affairs. (2008). National environmental management: Waste act 59 of 2008. https://www.dffe.gov.za/sites/default/files/legislations/nema_amendment_act59.pdf.
[17] Rasmeni, Z.Z., Madyira, D.M. (2019). A review of the current municipal solid waste management practices in Johannesburg city townships. Procedia Manufacturing, 35: 1025-1031. https://doi.org/10.1016/j.promfg.2019.06.052
[18] Hayes, C. (2010). Guide for Small Community Water Suppliers and Local Health Officials on Lead in Drinking Water. IWA Publishing.
[19] Department of Environmental Affairs and Tourism. (2020). Assessment of the status of waste management service delivery and capacity at the local government level. www.environment.gov.za.
[20] Mwangomo, E.A. (2018). Potential of waste to energy in African urban areas. Advanced Recycling and Waste Management, 3: 162-173.
[21] Juwana, I., Lazuardi, S.V., Herdiansyah, H. (2024). Investigating the factor of water consumption regarding the impact and implementation of water governance in urban areas. International Journal of Environmental Impacts, 7(1): 55-64. https://doi.org/10.18280/ijei.070107
[22] Government Notice No. 1561 of 2019. (2019). National Environmental Management » Waste Act (59/2008) » Consultation on the Draft revised and updated National Waste Management Strategy. https://www.greengazette.co.za/notices/national-environmental-management-waste-act-59-2008-consultation-on-the-draft-revised-and-updated-national-waste-management-strategy_20191203-GGN-42879-01561.
[23] Darban Astane, A.R., Hajilo, M. (2017). Factors affecting the rural domestic waste generation. Global Journal of Environmental Science and Management, 3(4): 417-426. https://doi.org/10.22034/gjesm.2017.03.04.007
[24] Corrêa, R.S., Di Vita, G., Selke, S.E., Tam, E.K.L., Wilson, B.G. (2007). Waste management referees–2006. Waste Management, 27: 151-157.
[25] Municipality, E. (2015). Medium Term Revenue and Expenditure Framework 2013/2014 To 2015/2016.
[26] Afrika, M., Oelofse, S., Strydom, W., Mvuma, G., John, J. (2016). Reduce, reuse and recycle. CSIR Newsletter. http://sawic.environment.gov.za.
[27] Semenya, K. (2020). Environmental health risks associated with firewood induced volatile organic compounds in Senwabarwana Villages, Republic of South Africa. Doctoral dissertation. University of South Africa, South Africa.
[28] Ibrahim, M.I.M., Mohamed, N.A.E.M. (2016). Towards sustainable management of solid waste in Egypt. Procedia Environmental Sciences, 34: 336-347. https://doi.org/10.1016/j.proenv.2016.04.030
[29] Daley, C.E., Onwuegbuzie, A.J. (2004). Attributions toward violence of male juvenile delinquents: A concurrent mixed-methodological analysis. The Journal of Social Psychology, 144(6): 549-570. https://doi.org/10.3200/SOCP.144.6.549-570
[30] Rasmeni, Z.Z., Madyira, D.M. (2019). A review of the current MSWM practices in Johannesburg city townships. Procedia Manufacturing, 35: 1025-1031. https://doi.org/10.1016/j.promfg.2019.06.052
[31] Kuh, D., Cooper, R., Hardy, R., Richards, M., Ben-Shlomo, Y. (2013). A Life Course Approach to Healthy Ageing. OUP Oxford, City of Oxford.
[32] Leedy, P.D., Ormrod, J.E. (2023). Practical Research: Planning and Design. Pearson, London.