Maria Põldma*![]() | Kaire Torn
| Kaire Torn![]() | Lauri Saks
| Lauri Saks![]()
© 2023 IIETA. This article is published by IIETA and is licensed under the CC BY 4.0 license (http://creativecommons.org/licenses/by/4.0/).
OPEN ACCESS
The following paper is intended to characterize microlitter occurrence in resident fish, bivalves and crustaceans collected from multiple sites NE Baltic Sea-Gulf of Finland, NE Gulf of Riga (Pärnu Bay), and western Estonia (including eastern Baltic Proper, archipelago area, and western coastal area of mainland) according to regionally coordinated Helsinki Commission (HELCOM) methodology. Marine litter and microplastics in gastrointestinal tracts from 11 fish and 6 benthic invertebrate species collected during the period 2019-2020 were evaluated. Analyses of microlitter were based on the suggestions given in Guidance on Monitoring of Marine Litter in European Seas and Monitoring Micro-Litter Ingestion in Marine Fish: a harmonized protocol for Marine Strategy Framework Directive (MSFD) and Regional Sea Conventions (RSCs) areas. All species contained microlitter (over 30% of samples from all individuals, N=1332). Highest microlitter concentrations were found in perch Perca fluviatilis (44%, N=106) and blue mussel Mytilus trossulus (42%, N=241). For Harris mud crab Rhithropanopeus harrisii the percentage was 23% (N=123). Among the three litter categories found, fibers accounted for the highest percentage - 46-100% for fish, 88-91% for bivalves and 75% for crabs. On average the abundance of recorded items was as follows: 0.54 (fish), 0.47 (bivalves) and crabs (0.33) per individual. In majority of analysed bivalves (69.6%, N=675) and fish (61%, N=524) that contained microlitter one microparticle per individual was detected. In case of most fish species, higher number of microlitter was associated with larger size (0.3-5mm) of the ingested particles. Our results reveal the ubiquitous presence of microplastics or other microlitter in organisms across multiple habitats in the NE Baltic Sea. The study identifies potential bioindicator species and provides an important baseline to monitor microplastic pollution in accordance with the MSFD. Among studied species, blue mussel (M. trossulus), Baltic macoma (M. balthica), Harris mud crab (R. harrisii), perch (P. fluviatilis), flounder (P. flesus), and Baltic herring (C. h. membras) were proposed as target species for assessment of ingested litter among invertebrate and fish in NE Baltic Sea.
bivalves, crabs, fish, ingested litter, marine debris, Marine Strategy Framework Directive (MSFD), microlitter, microplastics, monitoring
Marine litter is a significant environmental issue that affects the entire globe. One of the primary concerns associated with this problem is the ingestion of litter by organisms, leading to detrimental consequences for wildlife, economies, and human health [1-5]. Microlitter is widely distributed in every sub-zone/layer (pelagic and benthic) of coastal and marine systems [6-8] and are mostly abundant in marine and coastal systems [9]. Ingestion of marine litter has been reported in various organisms ranging from invertebrates to vertebrates, including endangered species [8, 10-13]. The deposition of marine litter in the marine and coastal environment leads to the benthic environment becoming the ultimate resting place for such waste. Consequently, this contributes to an accumulation of microplastics within demersal biota, resulting in high-density concentration levels [7, 14, 15]. Benthic organisms and suspension feeders feeding on litter fragments from bottom sediments and contaminated water are also being affected. According to Moore (2008), non-selective feeders collect and ingest all the particles within a similar size range of items without sorting through filter-feeding and/or deposit feeding [16]. Ingestion of microlitter by organisms depends on several factors such as feeding mechanism, type, shape, and quantity of microlitter matter.
Adverse effects of microplastics on marine organisms can potentially arise from physical effects (such as physical obstruction or damage of feeding appendages or their digestive tract, or other physical harm) [10, 17]. Compared with other categories of debris, ingestion of microplastics, can provide a pathway facilitating the transport of harmful chemicals into marine organisms causing chemical toxicity [18, 19]. Studies have clearly demonstrated such direct particle toxicity effects of microplastics translocated from gut to body fluids into organs, cells, and even organelles of marine organisms: e.g., fish [20, 21], mussels [22-26] and plankton [27-29]. Due to the limited understanding of the harmful effects of litter, including its chemical composition, particle shape, and size, it is challenging to establish precise toxicity targets. Hence, it is recommended to assess the patterns and trends in both the quantity and makeup of microlitter that marine organisms consume. Without knowledge of retention and egestion rates of field populations, it is difficult to deduce consequences at the ecological level [30].
Considering the pressures resulting from human activities in the Baltic Sea and the widespread distribution of microlitter in its waters [31-33] and on the sea floor [34-36], many species are potentially at risk of microlitter ingestion and its impacts. So far, amount of ingested microlitter has been reported in few studies of mussel species [31, 37] and in fish in the Baltic Sea [38-40].
In addition to national action plans at country level, management of marine litter in the Baltic Sea is organized within the framework of the EU’s (European Union) Marine Strategy Framework Directive (MSFD) [41] and its related Decision [42], covering European marine waters. Assessment criteria D10C3 in Descriptor 10 “Marine Litter” of EU MSFD requires that the amount of litter and microlitter ingested by marine animals is at a level that does not adversely affect the health of the species concerned (European Commission, 2017). Proposed units of measurement for the criteria D10C3 are number of items per individual for each species in relation to size (weight or length) of the individual sampled [42] and the proportion (%) of individuals impacted by ingestion of microlitter relative to the total number of individuals in the studied population [43]. As long the existing EU-threshold values are absent, it is required to establish threshold values at Union level, or through regional or subregional cooperation [44]. To enhance monitoring of ingested litter in marine biota and facilitate the implementation process of the EU MSFD with regards to setting baselines towards achieving good environmental status (GES), there is an acute need for data that allows for the assessment of ingested litter.
Monitoring trends and measuring the efficacy of management actions requires knowledge of microlitter baseline abundance, type, and composition. It is suggested that sampling for analysis of ingested litter should be part of already established surveys. In this regard selected study locations of the current study - Gulf of Finland, NE Gulf of Riga, and western Estonia - are already covered by regular coastal monitoring programme and different surveys where samples can be easily obtained.
The objectives of the study were to i) determine the abundance and composition of microplastics in selected fish, bivalve and crustacean species in the NE Baltic Sea, ii) identify potential indicator species for microplastic pollution monitoring based on the levels of contamination.
2.1 Studied species
To allow for holistic assessment of the microlitter contamination to the coastal ecosystems of the Estonial marine areas of the Baltic Sea, organisms from several taxonomic groups were sampled. To assess the ingestion of microlitter by fish the most common fish, both from an ecosystem perspective as well as from commercial importance, were investigated. In order to elucidate the occurrence of microlitter in the digestive system of different trophic levels of fish demersal predatory feeders, such as perch (Perca fluviatilis L.), pike-perch (Sander lucioperca L.), and smelt (Osmerus eperlanus L.), benthic feeders, such as flounder (Platichthys flesus sensu lato), round goby (Neogobius melanostomus Pallas), bream (Blicca bjoerkna L.), turbot (Scophthalmus maximus L.), eelpout (Zoarces viviparus L.) and omnivorous cod (Gadus morhua L.) and pelagic-feeders, such as Baltic herring (Clupea harengus membras L.) and sprat (Sprattus sprattus L.) were sampled.
Macrozoobenthic organisms evaluated in this study consisted of four commonly found bivalves in Baltic Sea - blue mussel (Mytilus trossulus Gould), lagoon cockle (Cerstoderma glaucum Bruguière), Baltic macoma (Macoma balthica L.) and sand gaper (Mya arenaria L.). Also, omnivorous crustacean Harris mud crab (Rhithropanopeus harrisii Gould) and predatory benthic isopod crustacean Saduria entomon L. were analysed.
2.2 Sample collection
Fish samples were collected from multiple sites in NE Baltic Sea - Gulf of Finland, NE Gulf of Riga (Pärnu Bay), and western Estonia (including eastern Baltic Proper, archipelago area, and western coastal area of the mainland) according to a regionally coordinated methodology [45] (Figure 1). Bivalves were collected from Gulf of Finland and coastal sea of western Estonia between April 2019 - September 2020. Samples of the invasive species R. harrisii, which are currently present only at Pärnu Bay and adjacent area in Estonian waters, were collected during diving between May 2019 - July 2019. Mussels attached to hard substrate were collected during diving by carefully dislodging organisms by hand. Ekman bottom grab was used for sampling infaunal bivalves on soft sediments. Benthic isopod Saduria entomon were collected as a by-catch of gill nets only from Gulf of Finland in November 2019. Fish P. fluviatilis, S. lucioperca, P. flesus, S. maximus, Z. viviparus, G. morhua, N. melanostomus, O. esperlanus, C. h. membras and S. sprattus samples were collected with net series conducted from all sampling sites between April 2019 - August 2020. P. fluviatilis, S. lucioparca, B. bjoerkna and N. melanostomus samples from Pärnu Bay were collected with bottom trawl between April 2019 - June 2020. Sampling duration was kept as short as possible reducing the exposure of the animals to the fishing gear. Hauls were performed using a standard towing speed of 2-3 knots, with a standard haul duration of around 30min. Hauls were conducted at depths ranging from 5 to 9m. Gill nets were chosen for sampling fish in shallow waters and hot spots (harbour, river mouth, etc.) with fishing time of approximately 12 hours.
Figure 1. Distribution of collection sites in Estonian marine area
Note: The extent of the western Estonia is indicated with a circle
The diversity in number of analysed individuals per site depended on the abundance of the particular species in different areas according to their habitat preference. Species/size selection was optimized for regional comparison and, wherever possible, overlapping species were chosen in adjacent areas. Altogether the number of analysed individuals was ~1300 (~500 fish and ~800 benthic invertebrates) and varied between 9 and 168 per fish species and between 68 and 245 individuals per species of macrozoobenthic invertebrates (Table 1).
Table 1. Number of analysed individuals, sampling stations, sampling areas
|
Group/Species |
Individuals |
Stations |
Sampling Area |
Length (cm) Mean (s.d.) |
Weight (g) Mean (s.d.) |
|
FISH |
|
|
|
|
|
|
P. fluviatilis |
106 |
9 |
PB, GF, WE |
18.8(4.2) |
87.3(68.7) |
|
S. lucioperca |
46 |
2 |
PB |
33.4(7.5) |
368.9(218.4) |
|
B. bjoerkna |
28 |
1 |
PB |
20.9(5.3) |
147.1(106.6) |
|
P. flesus |
51 |
7 |
PB, GF, WE |
21.1(5.9) |
128.1(101.2) |
|
S. maximus |
11 |
1 |
GF |
20.9(3.3) |
184.5(80.8) |
|
Z. viviparus |
9 |
1 |
GF |
16.8(1.4) |
21.9(6.0) |
|
N. melanostomus |
168 |
14 |
PB, GF, WE |
14.0(3.3) |
49.8(32.6) |
|
G. morhua |
13 |
2 |
WE |
17.1(4.4) |
39.7(25.6) |
|
S. sprattus |
10 |
1 |
GF |
12.5(0.8) |
11.5(2.0) |
|
G. h. membras |
70 |
7 |
PB, GF, WE |
15.4(1.5) |
27.0(15.7) |
|
O. eperlanus |
12 |
2 |
GF, WE |
15.5(1.9) |
18.4(8.1) |
|
BIVALVES |
|
|
|
|
|
|
M. trossulus |
241 |
18 |
GF, WE |
1.7(0.3) |
0.1(0.1) |
|
C. glaucum |
121 |
18 |
GF, WE |
1.0(0.3) |
0.1(0.1) |
|
M. balthica |
245 |
25 |
GF, WE |
1.3(0.4) |
0.1(0.2) |
|
M. arenaria |
68 |
15 |
GF, WE |
1.2(0.7) |
0.1(0.1) |
|
CRUSTACEANS |
|
|
|
|
|
|
R. harrisii |
123 |
2 |
PB |
1.3(0.5) |
1.2(0.9) |
|
S. entomon |
10 |
1 |
GF |
5.6(0.9) |
3.4(1.5) |
Note: PB - Pärnu Bay; GF - Gulf of Finland; WE - western Estonia; and total length (cm); and total weight (g) of the specimens; s.d.: standard deviation
Table 2. Species analysed for ingested microlitter in the Estonian coastal sea
|
Species |
Total Length (cm) |
Total Weight (g) |
||||
|
Min |
Max |
Mean (s.d.) |
Min |
Max |
Mean (s.d.) |
|
|
P. fluviatilis |
10.0 |
32.3 |
18.8(4.2) |
9.3 |
416.6 |
87.3(68.7) |
|
S. lucioperca |
5.1 |
45.5 |
33.4(7.5) |
48.9 |
1225.0 |
368.9(218.4) |
|
B. bjoerkna |
12.0 |
29.1 |
20.9(5.3) |
20.0 |
383.3 |
147.1(106.6) |
|
P.flesus |
10.7 |
33.2 |
21.1(5.9) |
16.0 |
449.0 |
128.1(101.2) |
|
S. maximus |
15.5 |
26.6 |
20.9(3.3) |
72.0 |
326.0 |
184.5(80.8) |
|
Z. viviparus |
15.0 |
18.5 |
16.8(1.4) |
13.6 |
32.5 |
21.9(6.0) |
|
N. melanostomus |
5.4 |
23.6 |
14.0(3.3) |
1.61 |
160.4 |
49.8(32.6) |
|
G. morhua |
13.0 |
28.0 |
17.1(4.4) |
17.4 |
100.6 |
39.7(25.6) |
|
S. sprattus |
10.9 |
13.3 |
12.5(0.8) |
7.2 |
13.5 |
11.5(2.0) |
|
C. h. membras |
12.2 |
20.8 |
15.4(1.5) |
11.3 |
132.6 |
27.0(15.7) |
|
O. esperlanus |
12.0 |
18.1 |
15.5(1.9) |
7.2 |
37.4 |
18.4(8.1) |
|
M. trossulus |
0.28 |
3.52 |
1.7(0.3) |
0.0 |
0.9 |
0.1(0.1) |
|
C. glaucum |
0.59 |
2.13 |
1.0(0.3) |
0.0 |
1.1 |
0.1(0.1) |
|
M. arenaria |
0.62 |
2.93 |
1.3(0.4) |
0.0 |
0.1 |
0.1(0.2) |
|
M. balthica |
0.50 |
2.26 |
1.2(0.7) |
0.0 |
0.4 |
0.1(0.1) |
|
R. harrisii |
0.42 |
2.06 |
1.3(0.5) |
0.0 |
3.1 |
1.2(0.9) |
|
S. entomon |
4.78 |
6.95 |
5.6(0.9) |
1.8 |
6.1 |
3.4(1.5) |
Note: Min, max and mean total length (cm) and weight (g) are shown; s.d.: standard deviation
2.3 Sample analyses
All specimens were packed in foil directly on board and the samples were immediately transported to the laboratory and frozen at a temperature -20℃. Defrosting was performed at room temperature for microparticle extraction and analysis. Wet Weight (WW) of each individual was weighed with micro weighing scale (accuracy 0.1mg). Prior to the analyses, individual specimens were rinsed with ultrapure Milli-Q water to avoid secondary contamination of the contents. Before packing, fish were inspected for any disease and those showing signs of feeding or regurgitation were rejected. Thereafter the length and weight of each fish were measured directly on board. The total length (i.e., from the tip of the snout to the tip of the longer lobe of the caudal fin) were measured (up to the nearest mm). The gastrointestinal tract of each fish was individually extracted from the mouth to the cloacae. All fish with completely empty stomach were excluded from the analyses. Length of bivalves were measured with a digital caliper (accuracy 0.01mm). Soft tissue and cartilage of the bivalves were segregated from the shell, tissue was rinsed with Milli-Q ultrapure water before weighting. Minimum, maximum and mean total length (mm) and weight (g) of investigated species are shown in Table 2.
For further analysis, the fish gastrointestinal tracts and bivalve soft tissues were treated by adding potassium hydroxide (KOH 10%) approximately three times the total tissue sample volume to degrade natural organic matter. Samples were incubated in oven (60℃, 15min) to increase digestion speed and placed on the shaker and rotated at orbital rotational mode with a speed of 130rpm for 12-24h. Depending on the amount this treatment was repeated several times as necessary, i.e., until all organic matter was dissolved. Distilled water was added to remaining suspension and stirred. The suspension was filtered on fibre glass membrane (Whatman GF/F, 47mm, 0.45µm porosity) with a vacuum pump under airborne contamination free conditions (laminar flow). Glass funnel above the membrane was rinsed with ultrapure water after filtering each sample. The membrane was placed on a Petri dish, covered by glass top. The number and position of microlitter on the membrane was detected before opening the dish. A stereomicroscope (Olympus SZX10) paired with a camera (Olympus) was used to detect ingested microlitter. To distinguish between plastic and organic material hot needle test was used. Hot needle causes the plastic to melt and deform [46, 47]. The sex of the crustaceans was determined, and the width of the carapace was measured in laboratory. The carapace was opened under the stereomicroscope and all intestines were extracted, placed on a Petri dish, and examined visually under stereomicroscope.
Analyses were based on the suggestions given in Guidance on Monitoring of Marine Litter in European Seas [48] and Monitoring Micro-Litter Ingestion in Marine Fish: a harmonized protocol for MSFD and RSCs areas [49]. All litter items were measured and photographed. To ensure the reliability and validity of the methods, standard procedures were followed during all steps of sample analyses. To reduce observer bias, ingested litter items were regularly double-checked by a second person immediately during analyses or later by using photographs.
2.4 Airborne contamination
To reduce airborne secondary contamination and cross contamination several procedures were applied during sample collection and analyses. This included controlling contamination by working plastic-free and including blank measurements. Blank control was performed regularly at every step of analyses by (a) adding similar volume of KOH 10% as that used in the samples containing the target component in a beaker without samples, (b) placing a damp filter paper in a petri dish in the working area during the visual examination of the samples. The controls were given the same full treatment as the studied specimens to assess any airborne contamination. If the blank was contaminated, then microlitter items with similar characteristics (shape, color, polymer type) were excluded from the results as proposed by Avio et al. [47]. Moreover, to ensure limited levels of contamination during analyses the window/air conditioner was closed, and personnel reduced in the laboratory. Additional contamination originating from researchers clothing was avoided by solely wearing 100% natural fiber clothing, such as cotton. All the equipment was cleaned with ultrapure Milli-Q water before each sample analysis. Lab surfaces area were cleaned with 70% alcohol, also for microscopic inspection area was cleaned before analysing samples in petri dishes. Results of the accuracy tests confirmed that the background contamination was minimal and negligible.
2.5 Data analyses
For the ingested microlitter five indices were used in this study as follows:
(1) Total frequency of occurrence (FO%) by species and area - percentage of individuals with microlitter (microplastics and other microlitter) items detected from the gastrointestinal tract to total number of examined specimens.
(2) Average microlitter abundance - the arithmetic mean of microlitter items found from the intestinal tract of the examined individuals and species to the total number of examined specimens.
(3) Percentage number of items for size class by species. The size classes proposed by Valente et al. [50] are considered the most suitable for monitoring purpose [49] was used in current study: i) 100 - 330µm, ii) 330µm - 1mm, iii) 1 - 5mm. The size is given as the largest distance between two spots for all fragmented particles (also for clumps of fibers), for all long and elongated particles (e.g., fibers) the length of the particles is given.
(4) Percentage number of items for material and shape category by species: fiber (straight, clump, flexibility, plastic or natural); fragment (plastic, pellet, granule, film, foam, paint, metal, glass, wood) [49].
(5) Percentage number of items for color by species [49]. R programming language version 4.0.3 [51] was used for data preparation, analysis and graphics. The differences were considered significant at p<0.05. The data for the abundances of microlitter in the organisms were expressed as the mean ±s.d. Differences in the number of ingested microlitter between sites, as well as between the microlitter results yielded from the two different methods - pelagic trawl net and gill net, were investigated with T-test. If more than two groups compared, then between group differences were compared with post hoc multiple comparison test. The fish total length (TL) and wet weight (WW) were compared with abundance of ingested litter items using parametric correlation to investigate the effect of fish size to ingested microlitter quantity.
3.1 Microlitter occurrence in fish
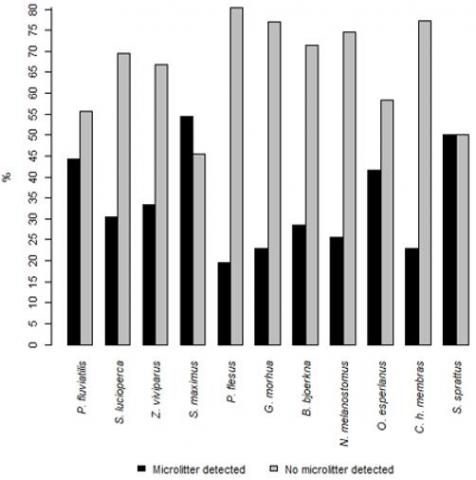
Digestive tract analysis revealed microlitter contamination in 30.5% (n=524) of all analysed fish. Microlitter was frequently detected in species S. maximus, S. sprattus, P. fluviatilis, and O. esperlanus, where more than 40% of the analysed individuals contained litter, P. flesus showed value below 20% (Figure 2). In majority only single litter item and occasionally 2 to 4 items were detected in individual fish. The average amount of microlitter values were highest in S. maximus, S. sprattus, and P. fluviatilis (Table 3).
To compare microlitter occurrence at regional level, individual counts of ingested microlitter of C. harengus membras, N. melanostomus, P. fluviatilis and Platichthys sp. were compared between different sampling regions. The occurrence of microlitter was statistically reliably higher amongst P. fluviatilis individuals from Pärnu Bay (Kruskal-Wallis H2; 106 = 22.08, p<0.00001) when compared to P. fluviatilis from other regions (post hoc multiple comparison western Estonia z=3.00, p=0.008, Gulf of Finland z=3.88, p=0.0003). No such regional differences in individual counts of ingested microlitter were detected in case of C. harengus membras (Kruskal-Wallis H2; 70 = 1.64, p=0.441), N. melanostomus (Kruskal-Wallis H2; 168 = 2.44, p=0.295) or Platichthys sp. (Kruskal-Wallis H2; 51 = 1.00, p=0.606). P. fluviatilis individuals had also statistically reliably higher microlitter counts than those found in any other fish species sampled from Pärnu Bay (Kruskal-Wallis H5; 218 = 35.42, p<0.00001; post hoc multiple comparisons z=3.15 - 4.08, p=0.024 - 0.0007, Gulf of Finland z=3.88, p=0.0003). Also, no such between-species differences were detected amongst samples from western Estonia (Kruskal-Wallis H5; 115 = 3.96, p<0.555) or Gulf of Finland (Kruskal-Wallis H5; 191 = 11.29, p<0.126).
Figure 2. Total frequency of occurrence (FO%) of microlitter (microplastics and other microlitter) items detected from the gastrointestinal tract of analysed fish
Table 3. Total frequency of occurrence (FO%) by species and area, and number of micolitter particles (N) thorough the study area
|
Group/Species |
Pärnu Bay |
Gulf of Finland FO% |
Western Estonia FO% |
Mean N |
Max N |
Study Area FO% |
|
FISH |
|
|
|
|
|
|
|
P. fluviatilis |
50.0G, 69.6T |
19.2G |
33.3G |
0.86 |
7 |
44.3 |
|
S. lucioperca |
20.0G, 33.3T |
- |
- |
0.52 |
3 |
30.4 |
|
B. bjoerkna |
28.5T |
- |
- |
0.39 |
4 |
28.5 |
|
P. flesus |
20.0G, 14.3T |
15.0G |
28.5G |
0.53 |
14 |
19.6 |
|
S. maximus |
- |
54.5G |
- |
1.00 |
6 |
54.5 |
|
Z. viviparus |
- |
33.3G |
- |
0.33 |
1 |
33.3 |
|
N. melanostomus |
22.2G, 25.0T |
22.3G |
37.9G |
0.38 |
4 |
25.5 |
|
G. morhua |
- |
- |
23.0G |
0.31 |
2 |
23.0 |
|
S. sprattus |
- |
50.0G |
- |
0.90 |
3 |
50.0 |
|
G. h. membras |
15.0G |
20.0G |
30.0G |
0.34 |
4 |
22.8 |
|
O. eperlanus |
- |
30.0G |
100G |
0.58 |
2 |
41.6 |
|
BIVALVES |
|
|
|
|
|
|
|
M. trossulus |
- |
36.8 |
46.2 |
0.61 |
10 |
41.7 |
|
C. glaucum |
- |
26.0 |
20.0 |
0.35 |
5 |
22.3 |
|
M. balthica |
- |
27.1 |
33.0 |
0.46 |
7 |
30.2 |
|
M. arenaria |
- |
4.8 |
21.2 |
0.57 |
5 |
32.3 |
|
CRUSTACEANS |
|
|
|
|
|
|
|
R. harrisii |
22.7 |
- |
- |
0.33 |
4 |
22.7 |
|
S. entomon |
- |
20.0 |
- |
0.30 |
2 |
20.0 |
Note: T - trawl net; G - gill net
Slight tendencies towards lower microlitter uptake by fish collected with gill net form Pärnu Bay (27%) compared to fish from pelagic trawl nets (37.8%), were detected. P. fluviatilis exhibited the highest rates of microlitter contamination in case of both methods, thereby showing higher percentages in individuals collected with trawl net. Similarly, microlitter uptake by S. lucioperca was lower for gill net than for trawl net. However, these differences were not statistically significant (Kruskal-Wallis H1; 53 = 2.217, p=0.137 and H1; 46 = 0.074, p=0.785 respectively). The difference in the proportion of microlitter contaminated individuals for other species was negligible between two collection methods (Table 3).
The relationship between the wet weight (WW) and the number of microlitter items detected in the gastrointestinal tract of the C. h. membras correlated positively (ANOVA F1; 15 = 12.03, p=0.004), whereas the relationship was not significant with total length (TL). However, there was no correlation with TL and WW in case of P. fluviatilis, S. lucioperca, P. flesus and N. melanostomus.
3.2 Microlitter composition in fish
The fibers represent almost 80% of the identified particles in fishes of Estonian marine area. The majority of fibers were plastic fibers (Figure 3). Colour of the fibers was mainly blue (52.6%). Plastic fragments were found in all demersal fish, except O. esperlanus and in both pelagic feeders. Also, glass and paint particles were not found from the guts of pelagic species. Diversity of litter categories was highest in P. fluviatilis, S. lucioperca and N. melanostomus. Wood and metal particles were found in small amounts in fishes.
Figure 3. Percentage (%) of total ingested litter items per category type
3.3 Microlitter size in fish
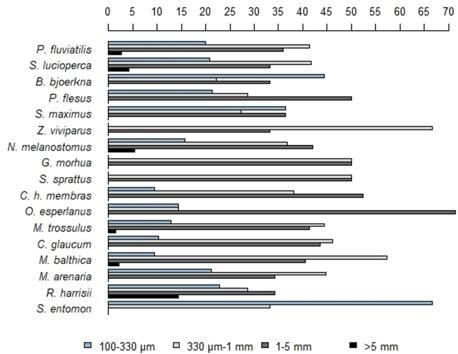
Among fish species, larger items (>1mm) were dominating regardless of the feeding type (Figure 4). Demersal fish Z. viviparus showed the significantly higher proportion of medium size litter (ranging between 330µm - 1mm) compared to other species. B. bjoerkna was the only fish species where microlitter items below 330µm were detected. Among fish species, 2.7-5.3% of the ingested litter items were determined as mesolitter (>5mm).
Figure 4. Proportion (%) of total litter items per size classes in the studied species
3.4 Microlitter occurrence in macrozoobenthic invertebrates
Microlitter was found in all investigated invertebrate species. Litter was detected in 31.3% (n=675) of the bivalve and 23.3% (n=133) of the crustacean individuals (Figure 5). The majority of analysed invertebrates (70%) comprised the one microparticle per individual, while two particles were found in 18.6% of bivalves, and more than 3 items per individual was rare. The maximum number of microlitter per individual of M. trossulus collected from eastern Baltic Proper was 10. On average, the total number of microlitter in invertebrates amounted to 0.5±0.947 items/individual while M. trossulus and M. arenaria showed the highest values (Table 3). In bivalves it amounted to 0.47±0.92 items/individual while M. trossulus and M. arenaria showed the highest values. The average amount of microlitter in crustaceans was 0.32±0.71 items/individual.
Figure 5. Total frequency of occurrence (FO%) of microlitter (microplastics and other microlitter) items detected in the bivalves and crustaceans
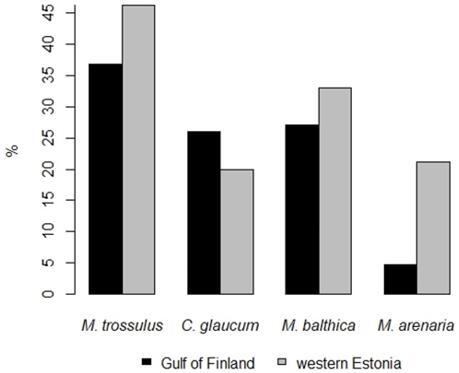
Figure 6. The total frequency of occurrence (FO%) of microlitter (microplastics and other microlitter) items detected in the bivalves collected from Gulf of Finland and western Estonia
Between species differences in total number of ingested microlitter was detected from western Estonian samples (Kruskal-Wallis H3; 354 = 16.64, p<0.001) where highest counts of litter were recorded from M. trossulus samples (Figure 6). This result was mostly associated with differences in microlitter counts between M. trossulus and C. glaucum (post hoc multiple comparison z=3.11, p=0.011, all other post hoc multiple comparisons z=0.11-0.21, p>0.05). However, no such between-species differences were detected in bivalve samples from Gulf of Finland (Kruskal-Wallis H3; 321 = 5.57, p=0.135). Litter counts from M. arenaria samples collected from the Gulf of Finland were higher than in samples originating from western Estonian (Kruskal-Wallis H1; 68 = 4.10, p=0.043) while no such regional difference was recorded with other sampled bivalve species (C. glaucum: Kruskal-Wallis H1; 121 = 0.60, p=0.438; M. balthica: Kruskal-Wallis H1; 245 = 0.77, p=0.379; M. trossulus: Kruskal-Wallis H1; 241=2.628, p=0.105).
3.5 Microlitter composition in macrozoobenthic invertebrates
Over 97% of the particles found in bivalves were fibers, of which over 90% was plastic and the rest was made of natural-based material like cotton or wool, mainly with anthropogenic origin (Figure 3). Mostly, the fibers were blue (60.9%) and red (16.5%). Non-fiber items were relatively evenly split between fragments, film, glass, and paint particles. Unlike other species, 10% of fibers found in the gut of Harris mud crab were clumped, the longest measured length of untangled fiber was 19 mm.
3.6 Microlitter size in macrozoobenthic invertebrates
Among bivalves the litter items in medium size (330µm - 1mm) were closely followed by items in size 1 - 5mm. Unexpectedly, the proportion of smallest (<330µm) detected items remained mainly below 15% (Figure 4). Both crustacean species showed different particle size proportions compared to all other studied species. The proportion of mesolitter was over 15% in the mud crab R. harrisii. Remarkably a high proportion (67%) of smallest litter (<330µm) were found in S. entomon.
Microlitter particles were recorded in all investigated species and at all sampling sites; however, high variability between the species and among the different sampling areas was observed. Analysis of the occurrence of microlitter in different fish species revealed contamination in 30.5% of the animals sampled. The occurrence of microlitter (FO%) at the regional level was highest in Pärnu Bay (36.0%, n=144), followed by western Estonia (33.1%, n=115), and Gulf of Finland (22.7%, n=191). The highest FO% was measured for P. fluviatilis from the Pärnu Bay (62.3%) and the lowest for P. flesus from Gulf of Finland and C. harengus membras from the Pärnu Bay (15%).
Previous studies have revealed highly different levels of microlitter or microplastic contamination in fish caught in offshore and mid-water trawls or gills. The concentration varies greatly for different studies i.e., 5.5% in the study of Rummel et al. [52], 11% in the study of Lusher et al. [30], 15% in the study of Alomar et al. [53], 23.3% in Giani et al. [54], 29% in Murphy et al. [55], 35% in Boerger et al. [56], and 40-87% in Anastasopoulou et al. [57]. The concentrations of microlitter and plastics found in our study were considerably high when compared to reported concentrations in offshore planktivorous fish herring and sprat collected from the northern Baltic Sea [38] or herring and cod trawled from Polish coast [40]. However, they are considered to be on the same level as what has been found in other species collected in nearshore environments [39, 58] and Caspian Sea [59]. Welden et al. [58] have demonstrated microplastic uptake in 42.5% in plaice M. squinado and in 50% in spider crab P. plastessa. Moreover, it has been shown that benthic fishes often tend to ingest more microlitter than pelagic feeders within the same environment [60, 61], but in this study such difference was not observed.
Our results showed that around 90% of all observed microlitter were fibers and majority of them constituted of plastic and most particles were found at a size class 1 - 5mm or 330µm - 1mm. According to Giani et al. [54] report for the Mediterranean Sea, 66% of microlitter found in two fish species were constituted from fibers, whereas the most common size classes were 0.5 - 1.0mm and <330µm. Abbasi et al. [8] report that in Musa Estuary, Persian Gulf, both pelagic and demersal fish ingested microplastic and recorded mean abundance ranging from 7.8 in tiger prawn to 21.8 in bartail flathead. However, much lower average abundance of microlitter was observed in the current study, where the average in fish amounted to 0.54 items and in bivalves 0.47 items per individual. In general, the majority of all studied individuals had ingested only one item. Sainio et al. [39] reported higher average amount (1.34±0.71) of particles in small coastal fish that had ingested microplastics. However, similarly to small coastal fish investigated in the current study, they also reported that the number of items varied between 1 and 5 particles per fish.
The fact that all studied bivalve species from all sites contained microlitter (31.3% of all analysed individuals) supports the previous findings made by Railo et al. [37] in the Baltic Sea and other earlier studies targeting different geographic regions, suggesting that filter feeding bivalves are efficient in accumulating microlitter [62-64]. Railo et al. [37] have shown that 66% (average 0.4 items/individual) of the blue mussel M. trossulus individuals contained microlitter, with the dominating litter types being fibres (~90% of all microlitter) and plastics made up 8% of all the analysed microlitter particles. In the current study, contamination was observed in 41.7% of M. trossulus (average 0.61 items/individual) individuals and similarly around 90% of all microlitter were fibers; however, contradictory, plastics made up majority of the microlitter.
Despite the population habitat of Harris mud crab R. harrisii in the immediate vicinity to Pärnu harbour in the Pärnu Bay, surprisingly only 22.7% of individuals contained microlitter items. For example, in Celtic Sea nearshore waters, Welden et al. [58] have showed a microplastic uptake of 50% in spider crab P. plastessa. The ingestion of plastic by the Chinese mitten crab Eriocheir sinensis from the Baltic coastal waters (Poland) and the Tagus Estuary (Portugal) revealed 13% individuals from both regions contained microplastic [65].
Due to such extreme variation between locations and target species, one-to-one comparisons between the results presented in the current study and existing studies are limited. To conclude, all investigated species ingest microlitter and can be used as a reference for future studies regarding the use of indicator species for monitoring microlitter pollution in the coast of Estonia. However, neither a target species nor an established threshold values for all the MSFD marine waters are not yet officialised. It is being proposed that suitable bioindicator species which have a wide distribution in the MSFD areas (incl. Baltic Sea) are used, such as anchovy (Engraulis encrasicolus), sprat (Sprattus sprattus), Atlantic horse mackerel (Trachurus trachurus) and Atlantic mackerel (Scomber scombrus) [49]. In this case however, only sprat would be applicable when it comes to the Estonian marine area. Moreover, all these species are pelagic and therefore, other benthic/demersal target species must be chosen at a regional level. As no single species can provide full coverage over all Europe’s marine sectors, a range of species is needed to monitor ingested litter [48]. It is also being suggested that monitoring of microlitter should include sentinel species such as filter feeders, which are known to ingest plastic particles (e.g., blue mussels) [43].
To assess MSFD criterion D10C3 we suggest following specific indicators for Estonian sea area: D10C3.1 - Amount of microlitter ingested by fish; and D10C3.2 - Amount of microlitter ingested by invertebrates. Target species were selected according to criteria set out by Matiddi et al. [49]: a) be representative of specific environmental compartments, b) have a commercial value, c) have a wide distribution in the MSFD (and RSCs) areas, d) already be described as regular litter consumers by different research studies. Selection of target species in the current study was set to represent those found within the entire Estonian sea area and fulfil the criteria on the above-mentioned list. The selected demersal fish species are perch P. fluviatilis and flounder P. flesus sensu lato and pelagic fish species baltic herring C. harengus membras and sprat S. sprattus. Sprat is also being suggested by MSFD Technical Group on Marine Litter [49] and as being widely distributed in most EU countries, and it can be important for assessment and comparison with other, and with more distant, areas. Population structure of Baltic herring is more complex in Estonian marine area, which is constituted of several sub-populations [66] and therefore potentially reflect situation better at the local scale. The selected species of filter - feeding benthic macroinvertebrates constitute the two abundant and widely distributed bivalves in Estonian coastal sea - blue mussel M. trossulus and Baltic macoma M. balthica and omnivorous Harris mud crab R. harrisii.
This study was designed primarily to assess which species would be a good matrix for future status and trends monitoring for microlitter and microplastics, aiming to be a direct and concrete contribution to the implementation of the main legislative marine litter related frameworks in the Baltic Sea region, precisely the EU Marine Strategy Framework Directive [41]. As a result of the current study, baseline values of amount and composition of microlitter in selected species are presented, which, from now on, enables to assess changes (Tables 4 and 5). In the current study insufficient amount of sprat individuals were analysed to calculate the base values and to give adequate estimation of the amount and composition of microlitter in the species. Performing targeted catches and collection of sprat from International Council for the Exploration of the Sea's (ICES) coordinated trawl surveys in the Baltic Sea are necessary to estimate the amount of microlitter in this species. It is suggested, that sampling for analysis of litter in fish should be part of already established surveys [48]. The assessment results are reported by aggregating the percentage of individuals that have ingested microlitter and the average number of microlitter items per individual. These results are then analyzed in relation to the size of the sampled individuals (weight and length) from various sites within the Estonian marine area.
Table 4. National aggregated results of the amount of microlitter (ML) items in relation to size (weight and length) of the individual sampled and proportion (%) of individuals ingested microlitter per selected macrozoobenthic organisms
|
Species |
N |
Amount of ML |
Proportion % of Individuals Ingested ML |
Proportion % of MP out of the Total of ML |
|
|
|
|
items/cm |
items/kg |
% |
% |
|
M. trossulus |
240 |
0.43 |
6645.6 |
41.7 |
89.8 |
|
M. balthica |
245 |
0.46 |
7082.9 |
30.2 |
93.8 |
|
R. harrisii |
123 |
0.26 |
708.5 |
22.7 |
77.5 |
Note: Proportion (%) of microplastic (MP) out of the total of ML is indicated
Table 5. National aggregated results of the amount of microlitter (ML) items in relation to size (weight and length) of the individual sampled and proportion (%) of individuals ingested ML per selected fish
|
Species |
N |
Amount of ML |
Proportion % of Individuals Ingested ML |
Proportion % of MP out of the Total of ML |
|
|
|
|
items/cm |
items/kg |
% |
% |
|
P. fluviatilis |
106 |
0.05 |
15.5 |
44.3 |
91.7 |
|
P. flesus |
51 |
0.03 |
10.4 |
19.6 |
88.9 |
|
C. h. membras |
70 |
0.02 |
11.9 |
22.8 |
92 |
Note: Proportion (%) of microplastic (MP) out of the total of ML is indicated
This study found evidence of substantial microlitter contamination in fish and invertebrate species from Estonian coastal waters. All species sampled contained microlitter particles, though levels varied significantly by region and species. Plastic fibers dominated the microlitter accumulated. EU MSFD requires the assessment of the amount of litter and microlitter ingested by marine animals. National knowledge and suggestions are the basis for selecting the suitable species for assessment of ingested litter through regional cooperation. Based on the current study, blue mussel (M. trossulus), Baltic macoma (M. balthica), Harris mud crab (R. harrisii), perch (P. fluviatilis), flounder (P. flesus), and Baltic herring (C. h. membras) were proposed as target species among invertebrate and fish in NE Baltic Sea. As the amount of research on the effects of ingested litter on marine animals is limited, future studies to evaluate the harmful effects on individuals need to be prioritized.
We would like to thank the staff of Estonian Marine Institute for collecting the animals by diving and sampling. We would also like to thank the crew of R/V Aurelie for collecting the fish with pelagic trawling net. Funding of the study was provided by the Environmental program of Estonian Environmental Investment Centre, project no 15448 ‘Litter ingested by marine animals - development of methodology and assessment for MSFD reporting’ and supported by the European Regional Development Fund via the Mobilitas Pluss (MOBERA12) of the Estonian Research Council.
[1] Galgani, F., Fleet, D., Franeker, J.V., Katsanevakis, S., Maes, T., Mouat, J., Oosterbaan, L., Poitou, I., Hanke, G., Thompson, R., Amato, E., Birkun, A., Janssen, C. (2010). Marine Strategy Framework Directive-task Group 10 Report: Marine Litter. Directive. Office for Official Publications of the European Communities, Italy. http://doi.org/10.2788/86941
[2] Wang, J.J., Zheng, L.X., Li, J.H. (2018). A critical review on the sources and instruments of marine microplastics and prospects on the relevant management in China. Waste Management and Reserach, 36(10): 898-911. https://doi.org/10.1177/0734242x18793504
[3] Beiras, R. (2018). Marine Pollution: Sources, Fate and Effects of Pollutants in Coastal Ecosystems. Elsevier, Netherlands, pp. 408.
[4] Campanale, C., Massarelli, C., Savino, I., Locaputo , V., Uricchio, F. (2020). A detailed review study on potential effects of microplastics and additives of concern on human health. International Journal of Environmental Research and Public Health, 17(4): 1212. https://doi.org/10.3390%2Fijerph17041212
[5] Issac, M.N., Kandasubramanian, B. (2021). Effect of microplastics in water and aquatic systems. Environmental Science and Pollution Research, 28: 19544-19562. https://doi.org/10.1007/s11356-021-13184-2
[6] Thushari, G.G.N., Senevirathna, J.D.M. (2020). Plastic pollution in the marine environment. Heliyon, 6: e04709. https://doi.org/10.1016/j.heliyon.2020.e04709
[7] Bellas, J., Martinez-Armental, J., Martinez-Camara, A., Beseda, V., Martinez-Gómez C. (2016). Ingestion of microplastics by demersal fish from the Spanish Atlantic and Mediterranean coasts. Marine Pollution Bulletin, 109:55-60. https://doi.org/10.1016/j.marpolbul.2016.06.026
[8] Abbasi, S., Soltani, N., Keshavarzi, B. (2018). Microplastics in different tissues of fish and prawn from the Musa Estuary, Persian Gulf. Chemosphere, 205: 80-87. https://doi.org/10.1016/j.chemosphere.2018.04.076
[9] Guo, X., Wang, J. (2019a). The chemical behaviors of microplastics in marine environment: A review. Marine Pollution Bulletin, 142: 1-14. https://doi.org/10.1016/j.marpolbul.2019.03.019
[10] Wright, S.L., Thompson, R.C., Galloway, T.S. (2013b). The physical impacts of microplastics on marine organisms: A review. Environmental Pollution, 178: 483-492. https://doi.org/10.1016/j.envpol.2013.02.031
[11] Werner, S., Budziak, A., van Franeker, J., Galgani, F., Hanke, G., Maes, T., Matiddi, M., Nilsson, P., Oosterbaan, L., Priestland, E., Thompson, R., Veiga, J., Vlachogianni, T. (2016). Harm Caused by Marine Litter. MSFD GES TG Marine Litter: Thematic Report Publications. Office of the European Union, Italy. http://doi.org/10.2788/690366
[12] Kühn, S., van Franeker, J.A. (2020). Quantitative overview of marine debris ingested by marine megafauna. Marine Pollution Bulletin, 151: 110858. https://doi.org/10.1016/j.marpolbul.2019.110858
[13] Pequeno, J., Antunes, J., Dhimmer, V., Bessa, F., Sobral, P. (2021). Microplastics in marine and estuarine species from the coast of portugal. Frontiers in Environmental Science, pp. 18. https://doi.org/10.3389/fenvs.2021.579127
[14] Neves, D., Sobral, P., Ferreira, J. L., Pereira, T. (2015). Ingestion of microplastics by commercial fish off the Portuguese coast. Marine Pollution Bulletin, 101: 119-126. https://doi.org/10.1016/j.marpolbul.2015.11.008
[15] Jabeen, K., Su, L., Li, J.N., Yang, D.Q., Tong, C.F., Mu, J.L., Shi, H.H. (2017). Microplastics and mesoplastics in fish from coastal and fresh waters of China. Environmental Pollution, 221: 141-149. https://doi.org/10.1016/j.envpol.2016.11.055
[16] Browne, M.A., Galloway, T.S., Thompson, R.C. (2009). Microplastic - An emerging contaminant of potential concern? Integrated Environmental Assessment and Management, 3: 559-561. https://doi.org/10.1002/ieam.5630030412
[17] Jovanović, B. (2017). Ingestion of microplastics by fish and its potential consequences from a physical perspective. Integrated Environmental Assessment and Management, 13(3): 510-515. https://doi.org/10.1002/ieam.1913
[18] Joint Group of Experts on the Scientific Aspects of Marine Environmental Protection (2015). Sources, fate and effects of microplastics in the marine environment: A global assessment. Reports and Studies. pp. 96.
[19] Sunday, N.F. (2020). Microplastics: Holistic overview of source, identification, interaction, health and environmental implications and strategies of abatement. Acta Chemica Malaysia, 5: 1. https://doi.org/10.2478/acmy-2021-0004
[20] Cedervall, T., Hansson, L.A., Lard, M., Frohm, B., Linse, S. (2012). Food chain transport of nanoparticles affects behaviour and fat metabolism in fish. PLoS ONE, 7(2): e32254. https://doi.org/10.1371%2Fjournal.pone.0032254
[21] Rochman, C.M., Hoh, E., Kurobe, T., Teh, S.J. (2013). Ingested plastic transfers hazardous chemicals to fish and induces hepatic stress. Scientific Reports, 3: 263. https://doi.org/10.1038/srep03263
[22] von Moos, N., Burkhardt-Holm, P., Koehler, A. (2012). Uptake and effects of microplastics on cells and tissue of the blue mussel Mytilus edulis L. after an experimental exposure. Environmental Science and Technology, 46(20): 11327-11335. https://doi.org/10.1021/es302332w
[23] Van Cauwenberghe, L., Claessens, M., Janssen, C.R. (2013). Selective uptake of microplastics by a marine bivalve (Mytilus edulis). Communications in Agricultural and Applied Biological Sciences, 78(1): 25-27. https://www.researchgate.net/publication/251232931_Selective_uptake_of_microplastics_by_a_marine_bivalve_Mytilus_edulis.
[24] Wegner, A., Besseling, E., Foekema, Kamermans, P., Koelmans, A.A. (2012). Effects of nanopolystyrene on the feeding behavior of the blue mussel (Mytilus edulis L.). Environmental Toxicology and Chemistry, 31(11): 2490-2497. https://doi.org/10.1002/etc.1984
[25] Browne, M.A., Dissanayake, A., Galloway, T.S., Lowe, D.M., Thompson, R.C. (2008). Ingested microscopic plastic translocates to the circulatory system of the mussel, Mytilus edulis (L.) Environmental Science and Technology, 42: 5026-5031. http://doi.org/10.1021/es800249a
[26] Ward, J., Shumway, S. (2004). Separating the grain from the chaff: Particle selection in suspension- and deposit-feeding bivalves. Journal of Experimental Marine Biology and Ecology, 300: 83-130. https://doi.org/10.1016/j.jembe.2004.03.002
[27] Bhattacharya, P., Lin, S.J., Turner, J.P., Ke, P.C. (2010). Physical adsorption of charged plastic nanoparticles affects algal photosynthesis. Journal of Physical Chemistry C, 114(39): 16556-16561. https://doi.org/10.1021/jp1054759
[28] Cole, M., Lindeque, P., Fileman, E., Halsband, C., Goodhead, R., Moger, J., Galloway, T.S. (2013). Microplastic ingestion by zooplankton. Environmental Science & Technology, 47(12): 6646-6655. http://doi.org/10.1021/es400663f
[29] Jeong, C.B., Kang, H.M., Lee, M.C., Kim, D.H., Han, J., Hwang, D.S., Souissi, S., Lee, S.J., Shin, K.H., Park, H.J., Lee, J.S. (2017). Adverse effects of microplastics and oxidative stress-induced MAPK/Nrf2 pathway-mediated defense mechanisms in the marine copepod Paracyclopina nana. Science Reports, 7: 41323. https://doi.org/10.1038/srep41323
[30] Lusher, A. (2015). Microplastics in the marine environment: Distribution, interactions and effects. Springer, 10: 245-308. http://doi.org/10.1007/978-3-319-16510-3_10
[31] Setälä, O., Magnusson, K., Lehtiniemi, M., Norén, F. (2016). Distribution and abundance of surface water microlitter in the Baltic Sea: A comparison of two sampling methods. Marine Pollution Bulletin, 110(1): 177-183. https://doi.org/10.1016/j.marpolbul.2016.06.065
[32] Tamminga, M., Hengstmann, E., Fischer, E.K. (2018). Microplastic analysis in the South Funen Archipelago, Baltic Sea, implementing manta trawling and bulk sampling. Marine Pollution Bulletin, 128(128): 601-608. https://doi.org/10.1016/j.marpolbul.2018.01.066
[33] Rothäusler, E., Jormalainen, V., Gutow, L., Thiel, M. (2019). Low abundance of floating marine debris in the northern Baltic Sea. Marine Pollution Bulletin, 149:110522. https://doi.org/10.1016/j.marpolbul.2019.110522.
[34] Urban-Malinga, B., Wodzinowski, T., Witalis, B., Zalewski, M., Radtke, K., Grygiel, W. (2018). Marine litter on the seafloor of the southern Baltic. Marine Pollution Bulletin, 127: 612-617. https://doi.org/10.1016/j.marpolbul.2017.12.052
[35] Kammann, U., Aust, M.O., Bahl, H., Lang, T. (2018). Marine litter at the seafloor - abundance and composition in the North Sea and the Baltic Sea. Marine Pollution Bulletin, 127: 774-80. https://doi.org/10.1016/j.marpolbul.2017.09.051
[36] Zablotski, Y., Kraak, S.B.M. (2019). Marine litter on the Baltic seafloor collected by the international fish-trawl survey. Marine Pollution Bulletin, 141: 448-461. http://doi.org/10.1016/j.marpolbul.2019.02.014
[37] Railo, S., Talvitie, J., Setälä, O., Koistinen, A., Lehtiniemi, M. (2018). Application of an enzyme digestion method reveals microlitter in Mytilus trossulus at a wastewater discharge area. Marine Pollution Bulletin. 130: 206-214. https://doi.org/10.1016/j.marpolbul.2018.03.022
[38] Budimir, S., Setelä, O., Lehtiniemi, M. (2018). Effective and easy to use extraction method shows low numbers of microplastics in offshore planktivorous fish from the northern Baltic Sea. Marine Pollution Bulletin, 127: 586-592. https://doi.org/10.1016/j.marpolbul.2017.12.054
[39] Sainio, E., Lehtiniemi, M., Setälä, O. (2021). Microplastic ingestion by small coastal fish in the northern Baltic Sea, Finland. Marine Pollution Bulletin, 172: 112814. https://doi.org/10.1016/j.marpolbul.2021.112814
[40] Białowąs, M., Jonko-Sobuś, K., Pawlak, J., Polak-Juszczak, L., Dąbrowska, A., Urban-Malinga, B. (2022). Plastic in digestive tracts and gills of cod and herring from the Baltic Sea. Science of the Total Environment, 822: 153333. https://doi.org/10.1016/j.scitotenv.2022.153333
[41] Directive O.E.M.S.F. (2008). Directive 2008/56/Ec of The European Parliament and of the Council of 17 June 2008 establishing a framework for community action in the field of marine environmental policy. Official Journal of the European Union, Italy. http://data.europa.eu/eli/dir/2008/56/oj.
[42] The European Commission. (2017). Commission decision (EU) 2017/848 of 17 May 2017 laying down criteria and methodological standards on good environmental status of marine waters and specifications and standardised methods for monitoring and assessment, and repealing Decision 2010/477/EU. Official Journal of the European Union. https://mcc.jrc.ec.europa.eu/documents/ComDec/Com_dec_GES_2017_848_EU.pdf.
[43] Werner S., Fischer E., Fleet D. (2020). Threshold Values for Marine Litter. EUR 30018 EN, Publications Office of the European Union, Luxembourg. http://doi.org/10.2760/192427
[44] Walmsley, S.F., Weiss, A., Claussen, U., Connor, D. (2017). Guidance for Assessments Under Article 8 of the Marine strategy framework, Integration of assessment results. European Commission, https://circabc.europa.eu/sd/a/cea61b55-06df-4e9e-9830-b0f41ca46fbe/GES_17-2017-02_Guidance_MSFDArt8_Feb2017TestVersion.pdf.
[45] HELCOM (2019). Guidelines for Coastal Fish Monitoring. https://helcom.fi/wpcontent/uploads/2020/01/HELCOM-Guidelines-for-coastal-fish-monitoring-2019.pdf.
[46] Devriese, L., van der Meulen, M., Maes, T., Bekaert, K., Paul-Pont, I., Frère, L., Robbens, J., Vethaak, A.D. (2015). Microplastic contamination in brown shrimp (Crangon crangon, Linnaeus 1758) from coastal waters of the Southern North Sea and Channel Area. Marine Pollution Bulletin, 98: 179-187. https://doi.org/10.1016/j.marpolbul.2015.06.051
[47] Avio, G., Pittura, L., d’Errico, G., Abel, S., Amorello, S., Marino, G., Gorbi, S., Regoli, F. (2020). Distribution and characterization of microplastic particles and textile microfibers in Adriatic food webs: General insights for biomonitoring strategies. Environmental Pollution, 258: 113766. https://doi.org/10.1016/j.envpol.2019.113766
[48] Joint Research Centre, Institute for Environment and Sustainability. (2013). Guidance on Monitoring of Marine Litter in European Seas. EUR 26113. Publications Office of the European Union, Luxembourg. https://doi.org/10.2788/99816
[49] Matiddi, M., Pham, C.K., Anastasopoulou, A. et al. (2021). Monitoring Micro-Litter Ingestion in Marine Fish: A harmonized protocol for MSFD and RSCs areas. MSFD TG Marine Litter 2020.
[50] Valente, T., Sbrana, A., Scacco, U., Jacomini, C., Bianchi, J., Palazzo, L., de Lucia, G.A., Silvestri, C., Matiddi, M. (2019). Exploring microplastic ingestion by three deep-water elasmobranch species: A case study from the Tyrrhenian Sea. Environmental Pollution, 253: 342-350. https://doi.org/10.1016/j.envpol.2019.07.001
[51] R Core Team (2020). R_ A Language and Environment for Statistical Computing. R_ Foundation for Statistical Computing, Vienna, Austria. https://www.r-project.org/.
[52] Rummel, C.D., Löder, M.G.J., Fricke, N.F., Lang, T., Griebeler, E.M., Janke, M., Gerdts, G. (2016). Plastic ingestion by pelagic and demersal fish from the North Sea and Baltic Sea. Marine Pollution Bulletin, 102(1): 134-141. https://doi.org/10.1016/j.marpolbul.2015.11.043
[53] Alomar, C., Compa, M., Deudero, S., Guijarro, B. (2020). Spatial and temporal distribution of marine litter on the seafloor of the Balearic Islands (western Mediterranean Sea). Deep-Sea Research, I: Oceanography Research Papers, 155: 103178. http://doi.org/10.1016/j.dsr.2019.103178
[54] Giani, D., Baini, M., Galli, M. , Casini, S., Fossi, M.C. (2019). Microplastics occurrence in edible fish species (Mullus barbatus and Merluccius merluccius) collected in three different geographical sub-areas of the Mediterranean Sea. Marine Pollution Bulletin, 140: 129-137. https://doi.org/10.1016/j.marpolbul.2019.01.005
[55] Murphy, F., Russell, M., Ewins, C., Quinn, B. (2017). The uptake of macroplastic & microplastic by demersal & pelagic fish in the Northeast Atlantic around Scotland. Marine Pollution Bulletin, 122(1-2): 353-359. https://doi.org/10.1016/j.marpolbul.2017.06.073
[56] Boerger, C., Lattin, G., Moore, S., Moore, C. (2010). Plastic ingestion by planktivorous fishes in the North Pacific Central Gyre. Marine Pollution Bulletin, 60: 2275-8. https://doi.org/10.1016/j.marpolbul.2010.08.007
[57] Anastasapoulou, A., Viršek, M.K., Varezić, D.B., Digka, N., Fortibuoni, T., Koren, S., Mandić, M., Mytilineou, C., Pešić, A., Ronchi, F., Šiljić, J., Torre, M., Tsangaris, C., Tutman, P. (2018). Assessment on marine litter ingested by fish in the Adriatic and NE Ionian Sea macro-region (Mediterranean). Marine Pollution Bulletin, 133: 841-851. https://doi.org/10.1016/j.marpolbul.2018.06.050
[58] Welden, N., Abylkhani, B., Howarth, L. (2018). The effects of trophic transfer and environmental factors on microplastic uptake by plaice, Pleuronectes plastessa, and spider crab, Maja squinado. Environmental Pollution, 239: 351-358. https://doi.org/10.1016/j.envpol.2018.03.110
[59] Bagheri, T., Gholizadeh, M., Abarghouei, S., Zakeri, M., Hedayati, A., Rabaniha, M., Aghaeimoghadam, A., Hafezieh, M. (2020). Microplastics distribution, abundance and composition in sediment, fishes and benthic organisms of the Gorgan Bay, Caspian Sea. Chemosphere, 257: 12720. https://doi.org/10.1016/j.chemosphere.2020.127201
[60] McGoran, A.R., Clark, P.F., Morritt, D. (2017). Presence of microplastic in the digestive tracts of European flounder, Platichthys flesus, and European smelt, Osmerus eperlanus, from the River Thames. Environmental Pollution, 220: 744-751. https://doi.org/10.1016/j.envpol.2016.09.078
[61] McNeish, R.E., Kim, L.H., Barrett, H.A., Mason, S.A., Kelly, J.J., Hoellein, T.J. (2018). Microplastic in riverine fish is connected to species traits. Science Reports, 8: 11639. https://doi.org/10.1038/s41598-018-29980-9
[62] Mathalon, A., Hill, P. (2014). Microplastic fibers in the intertidal ecosystem surrounding Halifax Harbor, Nova Scotia. Marine Pollution Bulletin, 81(1): 69-79. https://doi.org/10.1016/j.marpolbul.2014.02.018
[63] Vandermeersch, G., Van Cauwenberghe, L., Janssen, C.R., Marques, A., Granby, K., Fait, G., Kotterman, M.J.J., Jorge, D., Karen, B., Johan, R., Devriese, L. (2015). A critical view on microplastic quantification in aquatic organisms. Environmental Research, 143: 46-55. https://doi.org/10.1016/j.envres.2015.07.016
[64] Davidson, K., Dudas, S.E. (2016). Microplastic ingestion by wild and cultured manila clams (Venerupis philippinarum) from Baynes Sound, British Columbia. Archives Environmental Contamination and Toxicology, 71(2): 147-56. https://doi.org/10.1007/s00244-016-0286-4
[65] Wójcik-Fudalewska, D., Normant-Saremba, M., Anastácio, P. (2016). Occurrence of plastic debris in the stomach of the invasive crab Eriocheir sinensis. Marine Pollution Bulletin, 113: 306-311. https://doi.org/10.1016/j.marpolbul.2016.09.059
[66] ICES. (2020). Baltic Fisheries Assessment Working Group (WGBFAS). Scientific Reports, 2(45): 643. http://doi.org/10.17895/ices.pub.6024