Lucila Chang-Fossatti*![]() | Nathalia Tejedor-Flores
| Nathalia Tejedor-Flores![]()
© 2023 IIETA. This article is published by IIETA and is licensed under the CC BY 4.0 license (http://creativecommons.org/licenses/by/4.0/).
OPEN ACCESS
Sustainable development is growth that respects, without compromising, the needs of present and future society. Such sustainability is currently implemented in our society, which has absorbed and processed resources unconsciously for decades. The main objective of this research is to evaluate water sustainability in Panama through the Multi-Scale Integrated Analysis of Social and Economic Metabolism (MuSIASEM) or MuSIASEM scheme, which allows interrelating aspects of Panamanian society to create a metabolic pattern from 2004 to 2019. This methodology analyzes the country's economic, water and demographic variables, studying their interrelation to generate the socioeconomic metabolism. Thus, water consumption, Gross Domestic Product (GDP), and the Panamanian population were studied for the selected period. From the database, Panamanian demography has grown linearly during the period studied with a service economy mostly. Concerning the interrelation of the variables, except for the government sector, all sectors showed a correlation between the variables. This correlation reveals the influence between economic growth and water consumption. In conclusion, we emphasize the influence of the State in water sustainability, implementing measures to make efficient use of resources and enhance the economy-also the capacity of the MuSIASEM grammar as a holistic tool for such analysis.
Multi-Scale Integrated Analysis of Social and Economic Metabolism (MuSIASEM), Panama, sustainability development, water-energy-food nexus, water sustainability, water use
Sustainable development is the growth that meets the needs of the present without compromising the ability of future generations to meet their own needs [1]. Even though development was conceptualized from an economic perspective in the 20th century, the increasing study of the impact of human activity on ecosystems has generated an evolution in conceiving development towards an integral perspective [2]. Thus, the term “sustainable development” emerged in the document “Caring for the Earth”, defined as “improving the quality of human life without exceeding the carrying capacity of the ecosystems that sustain it” [3].
One way to address this problem is to implement a methodology capable of interrelating the variables associated with the use of water resources of the society under study and variables of the ecosystem itself. Accordingly, many researchers have proposed the study of these variables in the water-energy-food nexus to assess sustainability. Afterwards, the nexus gains importance in the essentiality of each component: water sustaining life, energy used to maintain society as we know it, and food as our source of supply. Consequently, these three elements interrelate and affect each other, so the study of this nexus forges a holistic view of a community's sustainability. Hence, in this research, among the different methodologies that evaluate the nexus, we will employ the Multi-Scale Integrated Analysis of Social and Economic Metabolism, or MuSIASEM scheme, to study the water component in Panama [4]. This methodology was created by Giampietro and Mayumi in 2000, which interrelates social-economic variables with environmental ones to assess sustainability [5]. Since its creation, it has been used to evaluate the metabolism and water sustainability of regions such as Yucatan (Mexico) [6], Spain [7, 8], Mauritius [9], Punjab (India) [10], Ecuador [11, 12], Israel [13], Colombia [14] and among others.
Sustainability assessment has become an increasingly crucial issue in the current global due to climate change, resource depletion, and food shortages. For this reason, this research responds to the aspiration in the Paris Agreement, where Panama committed to generating a “climate policy with measurable, verifiable and reportable indicators, to prioritize and evaluate policies throughout the national economy” [15]. In addition, it functions as a diagnostic for the water sustainability panorama in Central America, a region to which Panama belongs.
This article is presented in four sections: Section 1 describes an introduction of the topic, Section 2 contains the methodology used, Section 3 includes results and discussion, and finally and Section 4 presents the conclusions of this research.
2.1 A case of study: Panama
The present study assesses the Panamanian geography: Panama is diverse and multicultural, distinguished by dynamic economic growth sustained by a sophisticated supply of logistical and financial services [15]. Panama belongs to Central America, located south of Costa Rica and north of Colombia, in the northern hemisphere. Its territory is divided into ten provinces (Bocas del Toro, Coclé, Colón, Chiriquí, Darién, Herrera, Los Santos, Panamá, Panamá Oeste, and Veraguas) [16].
Panama has a population of approximately 4.2 million [17] and a surface area of 75,517-sq. km, generating an average annual water supply of 126,560.86-cb. mm [18]. This relation between the availability of water resources and population ranks Panama among the countries with the highest per capita water availability internationally [19]. Furthermore, Panamanian society uses this resource in different economic sectors, such as agriculture and energy generation, which has shaped Panama's social and economic structure in recent decades. Accordingly, this type of interaction is what we propose to analyze through the grammar of MuSIASEM, examining the interrelation of the variables: population, economy, and water.
Regarding water policy, Panama began to build its aqueducts and sewage systems in 1903 because of the construction of the Panama Canal by the United States, generating the first network of sanitation and water distribution in the country's main cities. Later, in 1961, the Institution of Aqueducts and Sewerage (IDAAN) was created, responsible for collecting, treating, and distributing drinking water in the national territory. On the other hand, institutions allied to IDAAN emerged, such as the Ministry of the Environment, which oversees the responsible use of resources through management laws and watershed management plans, regulation of concessions and water use, and national water resources policy, among other legislations.
Among the main obstacles that Panama faces in terms of drinking water is inadequate distribution infrastructure, which generates points of drinking water re-contamination as well as leaks and loss of supply; this condition is worsened by the absence of urban planning in the most densely populated areas of the city, which led to the creation of aqueduct networks with deficiencies in the design, causing losses in the network. Another of the country's goals is to supply the population growth of the metropolitan area since the basin that provides drinking water to the capital is the same one that gives water to the Panama Canal lock, restricting its capacity. Additionally, climate change threatens to increase droughts in the country's central area and floods in other regions, which forces the development of new supply plans for these areas vulnerable to drought and flood control in others.
As a solution, the National Strategic Plan proposes strengthening institutional development (creating the National Water Resources Authority, developing a national master plan for drinking water aqueduct systems, developing strategies for culture, awareness, sustainable watershed management, water management in agriculture, among others), increasing funding for investment in water resource projects, improving national infrastructure, guaranteeing water security and environmental sustainability to ensure social development [20]. As well as mapping areas vulnerable to climate change and managing climate change adaptation projects [15].
2.2 MuSIASEM
Among the schemes currently used for this study, we have the MuSIASEM scheme, which is an approach based on the Georgescu-Roegen bioeconomy, in which processes focus on an angle of feasibility and biophysical constraints. Accordingly, these processes are analyzed under the following aspects: (i) socioeconomic factors of production and consumption, (ii) energy and material transformation processes, (iii) demographic changes, (iv) time profiles of human distribution and land use in the different economic sectors, (v) the impact on ecosystem health resulting from the compatibility of energy and matter flows metabolized by society and the supply and disposal capacity of the ecosystems in which society is located [21].
This paper seeks to assess water sustainability in Panama in the last 16 years, recreating the socioeconomic metabolism of the country using the MuSIASEM grammar. This method has been widely applied since the 1970s for agricultural and economic systems, generally, describing the interaction of socioeconomic systems with the environment [20]. Among the existing studies, it is possible to mention several countries, such as Ecuador [11, 22], Spain [7, 8], Vietnam, Brazil, Chile, Venezuela, the Philippines, Thailand and Vietnam [23].
The MuSIASEM grammar uses an interrelationship between variables - understanding by variables, all those elements comprising an aspect of the society to be studied - which can be independent (called funds) or dependent (called flows). The funds comprise what the system is, so their function or definition remains unchanged during the timeline; it can be land, capital, or population, among others. However, the flows are the elements that vary over the study, which is transformed because of the funds. For example, in the case of Panama, each year, we have the flows whose variation or transformation are the object of study, such as the water resource and the economy (GDP). For the first flow, water is a natural resource transformed into consumption within the different economic sectors by the population or human activity (funds) to develop their activities in agriculture, industry, residential or work and generate a product. While, for the second flow, GDP, is the economic variable that enters each human activity within the paid work. This flow-fund interaction is analyzed as an input-output analysis, where the flow enters, transforms and generates products; these dynamic studies the entire flow cycle holistically, using patterns and studying their impacts [1].
2.3 Hiecharchical structure of society
Since the MuSIASEM grammar allows working with variables of different origins, it is necessary to standardize study's approach to process these variables in an appropriate structure. Therefore, a hierarchical system defines how the variables should be disaggregated. Likewise, this system is consistent with the socioeconomic system of the country under study (see Figure 1). Furthermore, this hierarchy establishes how the variables will be disaggregated and defined.
The activities covered by the sectors are as follows:
(1) Service (called EC) encompasses the trades and services economic sector. Examples: Warehouses, hotels, restaurants, public service garages, private hospitals, private schools, cooperatives, and private banks, among others.
(2) Building and manufacturing (called IND) include industrial establishments' manufacturing, assembly, and warehousing activities, such as factories, plants, construction, and workshops.
(3) Public sector (called GOV) covers the activity in institutions such as hospitals and state clinics, religious and educational buildings, libraries, sports stadiums, and others.
(4) The agricultural, energy, and mining sector consumption are not considered in the water sustainability study due to the unavailability of data. Only potable water is under study.
Figure 1. The hierarchical structure of society [9]
After defining the variables (funds and flows), we create a multilevel matrix to process the data according to levels in the hierarchy. Then, it is possible to study the viability of the metabolic pattern of the society under study by analyzing the indicators (ratio between flows and funds) since they indicate the consumption of resources by the society under study. In this assessment, given the three types of variables studied, there are two indicators (see Figure 2): First, the ratio between water use and human activity, called Water Metabolic Rate (WMR); and second, the Economic Labour Productivity (ELP), being the ratio between GDP and human activity.
Figure 2. Interaction of variables
Source: Own elaboration
In addition, the MuSIASEM grammar extends its analysis not only to determine the viability of the metabolic pattern of the society but also its sustainability with the ecosystemic metabolic pattern, which is the relationship of the society's resources. With this analysis, it is possible to determine the country's balance. However, this work only focuses on the viability of the social metabolic pattern [24].
In order to analyze the information and achieve data homogeneity, it is necessary to subdivide the variables according to the society’s activities or economic sectors. Therefore, this disaggregation generated a hierarchy of activities (see Figure 1), with society (n) as the first level and paid work (n-1, called PW) and residential activity (n-1, called HH for House Hold) as divisions. Then, Paid Work splits into two other sectors (n-2), service and government (SG) and building and manufacturing (IND). Finally, these enclose two subsectors that comprise level n-3: The commercial and government sector diverge into service (EC) and government (GOV).
In total, 4 variables of level n, 7 of level n-1, 12 of level n-2, and 8 of level n-3 are collected, for a total of 31 MuSIASEM variables (See Table 1). These were analyzed for Panama for the period 2004 to 2019, generating the database analyzed in this research. The data was obtained from the National Institute of Statistics and Census (INEC, for the Spanish acronym).
Table 1: Resumé of the variables MuSIASEM used [7]
|
Variable (Unit) |
Name and Description of the Variable |
Fund/Flow |
Calculation |
|
THA (h) |
Total human activity |
Fund |
Population×8,760 hours per year |
|
HAi (h) |
Human activity per sector i |
Fund |
People employed per sector×hours of work per week×weeks of work per sector per year HAHH = THA - HAPW |
|
GDP ($) |
Gross Domestic Product in society in one year |
Flow |
Taken directly from INEC |
|
GDPi ($) |
Gross Domestic Product per sector i, in one year |
Flow |
Taken directly from INEC |
|
ELPi ($/h) |
Economic Labour Productivity per sector i, by each sector |
Flow |
GDPi/HAi |
|
GWU (L) |
Gross water use appropriated by society, including losses and unaccounted for water |
Flow |
Taken directly from INEC |
|
NWUi (L) |
Net water consumption per sector i |
Flow |
Taken directly from INEC |
|
WMRSA (L/h) |
Water Metabolic Rate, an average of the society |
Flow |
NWUSA/HASA |
|
WMRi (L/h) |
Water Metabolic Rate per sector i |
Flow |
NWUi/HAi |
It is important to note that Panamanian labour has different schedules for the private sector than the public (government) sector. It is described as 40 hours per week for the public and 44 for the private sector. Similarly, the weeks worked per year were customized according to Panamanian law: From the 52 weeks per year, the 4 weeks of mandatory vacation and the 1.57 weeks of holidays stipulated by Panamanian law were subtracted [25]. This hierarchy decomposes the established variables, generating as shown in Table 1.
This section explains the results for all the databases analyzed. As indicated above, the database was examined over 16 years, from 2004 to 2019. The results are presented graphically, studying the behaviour of the variables over the years, indicating events and the transition of Panamanian society in its economic sectors. To better cover the analysis, we show an individual study for each level.
3.1 MuSIASEM analysis: level n
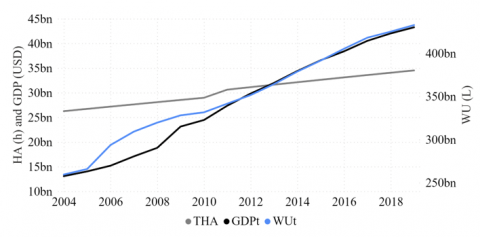
Level n, as seen in Figure 1, refers to Panama as a nation, being the target of the entire population of that country. That said, from the data obtained, we can generate Figure 3, from which we can see that water consumption - expressed in litres - increased from \$259 bn to \$432 bn, while GDP - expressed in dollars - grew from \$13 bn to \$43 bn and human activity - expressed in hours - from \$26 bn to \$34 bn. The above suggests an increasing correlation between water consumption and Panama's economic growth but no such correlation with the human activity variable. However, we can see an increase in all variables, which shows that the economy and water consumption increase with the Panamanian population's growth. Another point to highlight is the fluctuation of the variables in the year 2010, in which Panama was affected by the international economic crisis of 2009 [26], whose economy recovered in the following years, as we can see in Figure 3.
Figure 3. HA, WU and GDP interaction at level n
(Source: Own elaboration)
3.2 MuSIASEM analysis: level n-1
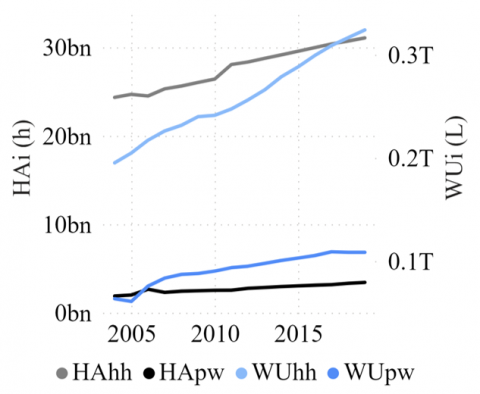
Level n-1, as seen in Figure 1, encompasses the Paid Work and Household sector. From Figure 4 (a), human activity in the paid and residential sectors increased consistently over the years, with values - expressed in dollars- from \$1.9 bn to \$3.4 bn and \$24 bn to \$31 bn, respectively. These values suggest a ratio of approximately 1/10 hours spent in the paid sector for each hour in the residential sector.
On the other hand, water consumption by the residential sector increased significantly per year, in contrast to the paid sector, which has increased slightly or remained constant for the last few years. This tendency indicates that water consumption in the residential sector is increasingly inefficient since it continues to increase more than human activity.
However, water consumption in the remunerated sector tends to lower and shows greater efficiency in resource use, especially in recent years, which tends to be constant. Regarding the fluctuation of human activity in the residential sector for the year 2011, where an increase in human activity is perceived since births increased by five times more differential increase than the previous year [27]; after this increase, the number of births per year was maintained during the period analyzed [28].
From Figure 4 (a), we can see that WMRPW has tended to a decreasing consumption, which, once again, indicates an efficient use of the resource in this sector. Contrary to WMRHH, which maintains a tendency to increase over the years at a constant rate. On the other hand, the ELPPW indicates a higher economic production every year, except in 2017, when a decline is accentuated due to the increase of HA dedicated in the service sector, which did not significantly increase their contribution to GDP.
(a) Variables and indicators at level n-1
(b) Variables at level n-2
(c) Variables and indicator at level n-2
Figure 4. Interaction of variables and indicators at levels n-1 and n-2
(Source: Own elaboration)
3.3 MuSIASEM analysis: level n-2
Level n-2 encompasses the primary and secondary production sectors and the service and government sectors. Figure 4 (b) describes the growth of HAIND and HASG - expressed in hours - from 0.4 bn and 0.7 bn to 1.5 bn and 2.8 bn, respectively. Meanwhile, GDPIND and GDPSG registered from \$1.6 bn and \$10.4 bn to \$9 bn and \$30.6 bn. On the other hand, Figure 4 (d) shows the evolution of WUIND and WUSG from 2.9 bn and 60.7 bn to 7.2 bn and 101.4 bn, correspondingly.
From Figure 4 (b, c), level n-2, it is seen that, concerning the government and service sectors, GDP growth is strongly influenced by WU and HA. Although, in recent years, WU has tended to a more constant consumption without compromising GDP growth, suggesting a more efficient use of water resources; not so for HA, which maintains its correlation – using Pearson correlation - with GDP in this sector (r=0.982 p-value=1.56e-11, given a null hypothesis for no correlation on α=0.05). Also, since 2010, water consumption has decreased without affecting economic growth for the IND sector. This phenomenon is explained by the new government management and financial policies after the economic crisis in 2009, which recovered the country's economy [29], and the first interdisciplinary plan for managing water resources was carried out [30]. As can be seen, HAIND dropped between 2014-2015 and established a similar growth as GDPIND onwards (r=0.894, p-value=0.000). While the variables WUIND and GDPIND are correlated (r=0.777, p-value=0.0003), also HAIND and GDPIND (r=0.894, p-value=0.000003) as WUIND and HAIND (r=0.872, p-value=0.00001). Industrial water consumption behaviour rose in the initial years and decreased after 2010. This WU trend is attributed to the water resources management policies above [29].
From Figure 4 (c), an increase in ELPIND and ELPSG can be seen. However, as mentioned above, the SG sector has decreased slightly in the last few years; in contrast, the IND sector is steadily increasing. On the other hand, the metabolic rate of water is decreasing in the SG sector, thus showing the efficiency in resource use. In turn, the industrial sector (IND) showed an annual increase in WMRIND until 2010, after which a decrease in WMR and a slight increase over the years was observed, probably due to the water resource plan [30].
3.4 MuSIASEM analysis: level n-3
Level n-3 comprises the primary production, building and manufacturing, service, and government sectors. We have Figure 5 (a) describing the growth of GDPPP, GDPIND, GDPEC, and GDPGOV – expressed in dollars - registered from 1.54 bn to 3.78 bn, 1.65 bn to 9.08 bn, 9.11 bn to 27.31 bn, and 1.26 bn to 3.26 bn, respectively. Also, from Figure 5 (a), HAPP, HAIND, HAEC, and HAGOV - expressed in hours - from 0.39 bn to 0.47 bn, 0.39 bn to 0.67 bn, 1.37 bn to 2.54 bn, and 0.14 bn to 0.23 bn, correspondingly. Also, WUEC, WUGOV, and WUIND – expressed in litres - from 4.30 M to 7.37 M, 2.63 M to 4.21 M, and 0.33M to 0.82 M, subsequently.
On the other hand, Figure 5 (b) shows the evolution of water indicators as follows WMREC, and WMRGOV - expressed in litres per hour - from 27.4 to 25.4, and 168.1 to 160 subsequently. Finally, the economic indicators ELPEC, and ELPGOV - expressed in dollars per hour - from 6.62 to 10.74, and 9.19 to 14.12, correspondingly.
These results suggest a high correlation between WUEC, HAEC and its GDPEC (WUEC and HAEC present an r=0.97, p-value=5.41e-10; WUEC and GDPEC r=0.982, p-value=1.05e-11; HAEC and GDPEC r =0.977, p-value=5.70e-08), but not for the other sectors, probably because others GDP continues to grow while WU tends to be higher in early years. For instance, the variables WUGOV and GDPGOV are not correlated (r=0.434, p-value=0.093), but HAGOV and GDPGOV (r=0.964, p-value=1.91e-09). The growth in the service sector is explained by policies designed to take advantage of the country's geographical position through free trade agreements and negotiations with international entities [31].
(a) Variables at level n-3
(b) Indicators at level n-3
Figure 5. Interaction of variables and indicators at level n-3 (Source: Own elaboration)
Regarding the indicators, Figure 5 (b) shows a constant increase in ELPEC, except after 2017, caused by an increase in the workforce. On the other hand, its WMR decreases continuously. Similarly, ELPIND increases drastically after 2010, probably due to state policies to face the 2009 economic crisis, contrary to WMR, which shows its efficiency by decreasing or remaining constant through the years. Finally, the government sector reflects an ELP that increases steadily over the years, contrary to its WMR, which, after increasing abruptly in 2006, tends to decrease.
As we can observe, most water consumption is for residential use, which shows the importance of efficiently managing the resource for this activity. According to the report of [18], Panama needs to reduce water loss due to leaks as well as unbilled water, so the government of Panama proposed in the study [32] to increase the coverage of drinking water services, as well as infrastructure at the micro and macro metering level, reducing leaks, as well as implementing water and sanitation studies.
On the other hand, since the Panamanian economy is mainly based on a single sector, it is essential to establish climate change adaptation and mitigation measures, especially in the country's drought and flood areas. In the study [32], it is proposed to carry out hydrometeorological monitoring studies, water balances, and tide gauges, among others, as well as civil works such as dredging, risk and disaster management programs, and strengthen institutions such as the National Civil Protection System (SINAPROC, by its initials in Spanish) in charge of responding to natural disasters.
Protecting natural resources is essential for achieving the goals proposed in its water security plan. To this end, Panama proposes in the study [20] investment projects for integrated watershed management and administration, increasing awareness and education at the local level, reforesting forested areas, strengthening water quality monitoring, and generating laboratory infrastructure at the state level.
Another aspect discussed is the interdisciplinary nature of the institutions and the need to work together in a robust inter-institutional framework to generate national results. To this end, the Panamanian government proposes the creation of the National Water Council (CONAGUA, by its initials in Spanish) to guarantee the implementation of the actions of the National Water Security Plan and the Technical Secretariat for Water Security, which will manage the technical part of the project. On the other hand, it is implementing decentralization to give voice to the basin committees and spaces open to citizens at the municipal level, among others.
These problems were studied in other Central American countries [33, 34], where re-contamination of treated water and the poor state of the distribution infrastructure is shared. In these cases, it was proposed to raise awareness and educate the population on the use of drinking water treatment systems, as well as to improve the designs and emphasize the importance of institutional support for the proper management of services since most of the populations that suffer from these problems do not have the economic power to build or maintain the infrastructure.
On the other hand, the study [35] shows the importance of an institutional system in which the opinions and needs of the communities can manage effective laws and plans for water resource management. Strong legislation that defends the user and protects the resource, together with the institution that executes it, makes possible water sustainability that respects the social and economic growth of the population.
From the results presented, it is possible to conclude some statements of the socioeconomic performance of Panama during the period studied, some of these are listed below:
(1) State policies can determine a country's economy, as Panama showed steady growth in the economic and industry sectors after a world economic crisis. These policies exploited the geographical and political characteristics of the country to strengthen its economy through free trade agreement strategies and enhance its location as an international hub for trade and business. In addition to these policies, a water resources plan was integrated to make water resources sustainable and efficient, reducing water consumption in most sectors.
(2) The Panamanian economy is sustained mainly by the service sector. Therefore, its economic contribution is correlated with human activity (r=0.941, p-value=5.70e-08), which indicates the nature of the activities and, possibly, low automation of the processes. This low automation would explain why, despite being the most prominent national economic contribution, its ELPEC indicator has decreased in recent years due to increased personnel. However, contrary to this, the industrial sector has increased its ELPIND by maintaining its workforce and implementing policies, which leads us to propose implementing new regulations for the service sector.
(3) The management, strategy, and commitment of the State are determining factors in the performance of a country's economy and resources. From this perspective, an information gap also limits possible improvements without records. Such is the case of agriculture, which does not provide water consumption records. For this reason, governments and communities are encouraged to keep a record of the supply and use of the existing resource to implement planning and sustainability strategies adequately.
(4) Comprehensive studies, such as MuSIASEM, permit the detection of changes and their impact on the population structure of the economy and resources when applied to a historical series. For example, the case of Panama shows how the population tends towards the paid sector, which may be due to social realities such as the increased cost of living that drives more people in the household to work for a salary. However, we could detect high water consumption in the residential sector, for which we suggest implementing saving or low consumption policies that decrease this demand.
(5) In general, it is possible to see a correlation between water consumption and economic growth for the sectors of the Panamanian economy, except for the government sector, for which water consumption appears to be independent of its contribution to the economy or the number of employees. Given this, a more in-depth study of this Panamanian sector is encouraged to detect key activities and create opportunities for improvement.
This research was funded by Secretaría Nacional de Ciencia, Tecnología e Innovación (SENACYT), project APY-NI-2021-51. Also, the author would like to thank her supervisor and co-author: Nathalia Tejedor-Flores, for her support.
[1] World Commission on Environment and Development, Our common future, 1987. https://idl-bnc-idrc.dspacedirect.org/server/api/core/bitstreams/a475333a-2123-4655-8e16-108d1dcd477f/content.
[2] Chang-Fossatti, L., Tejedor-Flores, N. (2022). Bibliographic review of water sustainability assessment in Central America. Ecology and the Environment, 260: 79-89. https://doi.org/10.2495/SC220071
[3] The World Conservation Union. United Nations Environment Programme. World Wide Fund For Nature. (1991). Caring for the earth: A strategy for sustainable living. Gland, Switzerland, 1-233. https://portals.iucn.org/library/efiles/documents/cfe-003.pdf, accessed on Oct. 12, 2021.
[4] Wicaksono, A., Jeong, G., Kang, D. (2017). Water, energy, and food nexus: Review of global implementation and simulation model development. Water Policy, 19(3): 440-462. https://doi.org/10.2166/wp.2017.214
[5] Giampietro, M., Mayumi, K. (2000). Multiple-scale integrated assessment of societal metabolism: Introducing the approach. Population and Environment, 22: 109-153. https://doi.org/10.1023/A:1026691623300
[6] Rodríguez-Huerta, E., Rosas-Casals, M., Hernandez-Terrones, L. M. (2019). Water societal metabolism in the Yucatan Peninsula. The impact of climate change on the recharge of groundwater by 2030. Journal of Cleaner Production, 235: 272-287. https://doi.org/10.1016/j.jclepro.2019.06.310
[7] Gómez-Villán, E., Vicente-Galindo P., Tejedor-Flores, N. (2021). Water sustainability: A case study using social and economic metabolism perspective. Ecology and the Environment, 253: 241-252. https://doi.org/10.2495/sc210211
[8] Madrid-López, C., Alcántara, V., Giampietro, M., Ramos-Martin, J. (2014). Tools for the analysis of the water exchange: Andalusia and Spain. In The Water Metabolism of Socio-Ecosystems: Epistemology, Methods and Applications. University Autònoma of de Barcelona, Spain, 180-211.
[9] Giampietro, M., Aspinall, R.J., Ramos-Martin, J., Bukkens, S.G. (2014). Resource Accounting for Sustainability Assessment: The Nexus Between Energy, Food, Water and Land Use. Routledge, England, 1-222.
[10] Madrid-López, C., Alcántara, V., Giampietro, M., Ramos-Martin, J. (2014). Quantification of the water metabolism: the case of Punjab. In The Water Metabolism of Socio-Ecosystems: Epistemology, Methods and Applications. University Autònoma of de Barcelona, Spain, 161-177.
[11] Tejedor-Flores, N., Vicente-Galindo, P., Galindo-Villardón, P. (2017). Sustainability multivariate analysis of the energy consumption of ecuador using MuSIASEM and BIPLOT approach. Sustainability, 9(6): 984. https://doi.org/10.3390/su9060984
[12] Malo-Larrea, A., Santillán, V., Torracchi-Carrasco, E. (2022). Looking inside the Blackbox: Cuenca’s water metabolism. PLOS ONE, 17(9): e0273629. https://doi.org/10.1371/journal.pone.0273629
[13] Kovacic, Z. (2014). Assessing sustainability: The societal metabolism of water in Israel. International Journal of Performability Engineering, 10(4): 387. https://doi.org/10.23940/ijpe.14.4.p387.mag
[14] Rinaldi, P., Roa-García, M.C., Brown, S. (2021). Producing energy, depleting water: The energy sector as a driver of seasonal water scarcity in an extractive frontier of the upper Orinoco watershed, Colombia. Water International, 46(5): 723-743. https://doi.org/10.1080/02508060.2021.1955327
[15] Ministry of Environment. (2020). Panama's nationally determined contribution (CDN1) First update, Ministry of Environment, Panama. https://cdn1.miambiente.gob.pa/informe/, accessed on Jul. 15, 2022.
[16] National Institute of Statistics and Census, Algunas Caracteristicas De La División Politica Administrativa En La República De Panamá, Según Provincia, Comarca Indigena Y Distrito: Año 2020. https://www.inec.gob.pa/archivos/P0579518620220531115126Algunas%20caracter%C3%ADsticas%20de%20la%20divisi%C3%B3n%20pol%C3%ADtica%20administrativa-Cartografia.pdf, accessed on Jun. 12, 2022.
[17] National Institute of Statistics and Census. (2019). Panama in numbers: Years 2015-2019, Panama. https://www.inec.gob.pa/archivos/P0705547520210831104050Panam%C3%A1%20en%20Cifras%20resumen.pdf, accessed on Apr. 20, 2022.
[18] Ministry of Environment. (2019). Water supply and use in Panama, Government of Panama, Panama. https://www.sinia.gob.pa/datos/Agua%20y%20saneamiento/Oferta%20y%20Usos%20de%20Agua%20en%20Panam%C3%A1%202019.pdf, accessed on Jan. 10, 2022.
[19] Organización de las Naciones Unidas para la Agricultura y la Alimentación. (2018). Recursos de agua dulce internos renovables per cápita (metros cúbicos). https://datos.bancomundial.org/indicator/ER.H2O.INTR.PC?end=2018&most_recent_value_desc=true&start=2018&view=map, accessed on Nov. 29, 2022.
[20] Ministry of Environment of Panama and Global Water, Plan de Acción para la Gestión Integrada de los Recursos Hídricos (PAGIRH) de Panamá (2022-2026), https://www.gwp.org/globalassets/global/gwp-cam_files/plan-de-accion-girh---panama_fin_1jun.pdf, accessed on Jun. 12, 2023.
[21] Ramos-Martin, J., Giampietro, M., Mayumi, K. (2007). On China's exosomatic energy metabolism: An application of multi-scale integrated analysis of societal metabolism (MSIASM). Ecological Economics, 63(1): 174-191. https://doi.org/10.1016/j.ecolecon.2006.10.020
[22] Falconí-Benítez, F. (2001). Integrated assessment of the recent economic history of Ecuador. Population and Environment, 22: 257-280. https://doi.org/10.1023/A:1026647829660
[23] Eisenmenger, N., Ramos Martín, J., Schandl, H. (2007). Análisis del Metabolismo energético y de materiales de Brasil, Venezuela y Chile. Revista de la Red Iberoamericana de Economia Ecológica, 6: 17-39. https://ddd.uab.cat/pub/revibec/revibec_a2007v6/revibec_a2007v6p17.pdf.
[24] Mayumi, K., Tanikawa, H. (2012). Going beyond energy accounting for sustainability: Energy, fund elements and the economic process. Energy, 37(1): 18-26. https://doi.org/10.1016/j.energy.2011.04.050
[25] Ministry of Labor, Work Code, Panama: Government of Panama, 1971 (last modified in 1995). https://www.mitradel.gob.pa/wp-content/uploads/2016/12/c%C3%B3digo-detrabajo.pdf, accessed on May 20, 2022.
[26] Sokol, J.B. (2019). Analysis of the sources of Panama's growth (slowdown, perspectives and recovery policies) (in spanish). National Competitiveness Center, Panamá. https://www.google.com/url?sa=t&rct=j&q=&esrc=s&source=web&cd=&ved=2ahUKEwic_5mfr7eBAxV6TDABHbrHBOIQFnoECAwQAQ&url=https%3A%2F%2Fcncpanama.org%2Fcnc%2Findex.php%2Finformes%2Fcategory%2F163-informes-especiales%3Fdownload%3D2191%3Aanalisis-de-las-fuentes-de-crecimiento&usg=AOvVaw3DoVuSSRCL8_NvzxnTeQAl&opi=89978449, accessed on May 15, 2022.
[27] National Institute of Statistics and Census. (2012). Live births and gross birth rate in the Republic, according to area, city, province and indigenous district of residence. Years 2007-2011., Panama. https://www.inec.gob.pa/archivos/P4921221-02.pdf, accessed on Apr. 17, 2022.
[28] National Institute of Statistics and Census. (2019). Live births and fetal death in the Republic. Years 1952-2018, Panama. https://www.inec.gob.pa/archivos/P0705547520191205084734Cuadro%201.pdf, accessed Apr. 17, 2022.
[29] Ministry of Economy and Finance, Strategic Governance Plan 2010-2014, Government of Panama, Panama. https://www.mef.gob.pa/wp-content/uploads/2020/12/Plan-Estrategico-de-Gobierno-2011-2014-1.pdf, accessed on Oct. 20, 2022.
[30] Ministry of the Environment. (2011). National integrated water resources management plan of the republic of Panama 2010-2030. Government of Panama, Panama. https://faolex.fao.org/docs/pdf/pan118989anx.pdf, accessed on Nov. 18, 2021.
[31] Japan International Cooperation Agency. (2004). Final report: The study on the integral port development plan for the Republic of Panama, https://openjicareport.jica.go.jp/pdf/11772092_03.pdf, accessed Dec. 25, 2022.
[32] Ministry of Environment of Panama. (2016). National plan for water security 2015-2050. https://www.oas.org/en/sedi/dsd/iwrm/Documentspot/Primer%20Plan%20Nacional%20de%20Seguridad%20Hidrica%20de%20la%20Republica%20de%20Panama.pdf, accessed on Nov. 27, 2021.
[33] Ermilio, J., Pattison, I., Sohail, M. (2022). Performance Monitoring and sustainable management of piped water supply infrastructure in developing communities. Journal of Water Resources Planning and Management, 148(2): 05021030. https://doi.org/10.1061/(ASCE)WR.1943-5452.0001470
[34] Cronk, R., Bartram, J. (2018). Identifying opportunities to improve piped water continuity and water system monitoring in Honduras, Nicaragua, and Panama: Evidence from Bayesian networks and regression analysis. Journal of Cleaner Production, 196: 1-10. https://doi.org/10.1016/j.jclepro.2018.06.017
[35] Cuadrado-Quesada, G. (2014). Groundwater governance and spatial planning challenges: Examining sustainability and participation on the ground. Water International, 39(6): 798-812. https://doi.org/10.1080/02508060.2014.962650