Steven Spengler* | Marvin Heskett
© 2023 IIETA. This article is published by IIETA and is licensed under the CC BY 4.0 license (http://creativecommons.org/licenses/by/4.0/).
OPEN ACCESS
The concentration of pharmaceutical compounds and nutrients present in perennial streams, springs and a lake on the island of O‘ahu, Hawai‘i were measured under drought conditions between 2020 and 2022. The combined island-wide daily release of wastewater to the environment on O‘ahu from the continued use of legacy On-Site Sewage Disposal Systems (OSDS) and from exfiltration from the 3,400-kilometer network of underground sewer lines has been estimated to be about 80 million liter per day (mld), or around 3.9% of the total island-wide groundwater flux to the ocean. The 36 streams and 11 springs sampled were located down-gradient of areas with varying densities of OSDS and sewage lines while the lake sampled (Lake Wilson) receives direct input from the wastewater treatment plant that serves Central O‘ahu. Average pharmaceutical and nutrient levels in streams and springs sampled in areas with high densities of OSDS and sewer lines were slightly higher, but not statistically different than concentration levels measured in streams and springs in areas with low densities of OSDS and low sewer line densities. The average sulfamethoxazole and carbamazepine levels measured in Lake Wilson, the only water body on O‘ahu where treated wastewater is discharged into fresh water, are three to four times higher than average levels measured in the island’s streams and springs. The presence of elevated concentrations of nitrate and silica in some streams and springs on O‘ahu predominately reflects the impact of the historical use of up-gradient lands for sugarcane cultivation rather than wastewater input. The trace levels of pharmaceuticals detected in O‘ahu streams and springs under baseflow conditions suggest that the actual combined input of wastewater to the environment from legacy OSDS and exfiltration from sewer lines is less than 20% the wastewater flux previously estimated.
baseflow, cesspools, Hawaii, Oahu, OSDS, pharmaceutical tracer, septic tanks, sewage exfiltration, springs, streams, wastewater contamination
Hawai`i was the last state in the United States to ban the construction of new cesspools. The construction of new cesspools was banned in 2015 due to concerns about water quality threats to human and coral reef health. Legislation was passed in 2017 to replace all existing cesspools in the state by 2050.
A survey completed in 2009 found that 14,600 On-Site Disposal Systems (OSDS) exist on the most densely populated Hawaiian Island, O‘ahu, mostly within one-kilometer of the coast and in residential neighborhoods [1]. These OSDS include cesspools, which account for 77 percent of the surveyed total, along with septic tanks and aerobic treatment units. Cesspools provide minimal treatment of wastewater before it percolates to the underlying groundwater aquifer. This survey estimated that 38 million liters per day (mld) of wastewater are released to the environment island-wide from OSDS, with the majority of the released sewage reaching underlying groundwater. High densities of OSDS are found throughout O‘ahu. Estimates of OSDS density and daily wastewater release volumes range from 60 units/kilometer2(km2) and 1.5 mld in leeward urban O‘ahu (Makiki), 27 units/km2 and 2.3 mld in windward O‘ahu (Waimanalo) and 20 units/km2 and 3.3 mld on the north shore of O‘ahu (Waialua). The authors of the OSDS survey asserted that the sheer numbers of OSDS in some communities on O‘ahu produces a cumulative effluent volume that is comparable to that of municipal wastewater treatment plants (WWTP) [1].
Groundwater quality on O‘ahu is also impacted by exfiltration of sewage from the island’s 3,400-kilometer web of sewer lines that convey an average of 394 mld sewage to WWTP operated by the City and County of Honolulu. The age range distribution of the sewage conveyance system is as follows: <25 years; 22.2%, 26-50 years; 18.3%; 51-75 years; 42.7%, 76-100 years; 11.8% and >100 years, 1.2%. In the urban areas surrounding Honolulu, the majority of the sewage conveyance system is over 65 years old and is beset by leaking joints and pipes due to the presence of corrosive hydrogen sulphide gasses produced by the combination of a warm tropical climate and the high sulfate content of the shallow groundwater surrounding the pipes and joints in the coastal portions of the conveyance systems. Maintenance of this aging and deteriorating sewage conveyance system is a challenge, and there is an ongoing need to replace and upgrade Hawaii’s sewer lines and force mains due to both capacity and structural integrity issues [2].
The United States Environmental Protection Agency (USEPA) reported between 12 and 49% of wastewater flows are lost due to leaking infrastructure in United States cities [3]. The system-wide amount of wastewater exfiltration from O‘ahu’s sewage system is unknown. A rough estimate of 10% system-wide exfiltration is based upon the difference in average monthly groundwater withdrawals by the water utility and the average monthly volume of wastewater treated at the WWTPs operated by the City and County of Honolulu [4]. A 10% loss suggests around 40 mld of wastewater is released to the environment from exfiltration from the sewage conveyance system, roughly the same amount of wastewater that is estimated to be released from the ongoing use of OSDS. Evidence of exfiltration from the sewage conveyance system has been observed in two coastal areas in urban Honolulu, Waikiki and Mapunapuna, based on the presence of pharmaceutical compounds in storm drains in these areas and in the Ala Wai Canal, which receives input from Waikiki storm drains [4].
The United States Geological Survey (USGS) estimates that the mean island-wide groundwater flux entering the ocean is around 2,050 mld [5]. The combined estimated island-wide release of wastewater due to the continued use of legacy OSDS and from exfiltration from the sewage conveyance system is around 80 mld, or roughly 3.9% of the total island-wide groundwater flux to the ocean. The simulated groundwater flux along O‘ahu’s shoreline varies from less than 4 mld/km in the drier and narrower portions of the island to maximum values of around 76 mld/km along the shoreline bordering Pearl Harbor [5]. based upon these previous estimates of wastewater input, chemical evidence of wastewater should be readily detected in groundwater that underlies and streams that flow through areas on O‘ahu with high OSDS and sewer line densities. The focus of the paper is to evaluate whether the combined environmental impact from legacy cesspools and sewage exfiltration can be estimated by measuring the pharmaceutical and nutrient concentrations in island streams and springs under baseflow conditions, when the water present in the streams almost exclusively originated from groundwater discharge from the surrounding watershed. Sampling was also conducted under low water-level conditions in Lake Wilson, which is the only location on O‘ahu that receives direct wastewater input from a WWTP servicing Central O‘ahu.
1.1 Characteristics of Hawaiian streamflow
Streams on O‘ahu are typically short (<6 km long) and have relatively steep gradients [6]. Rainfall runoff to O‘ahu streams tends to be flashy due to the high intensity of rainfall that often falls in the island’s interior combined with the small size of the steep drainage basins and limited channel storage present within the island’s watersheds. The permeable nature of the island’s volcanics and upland soils allow rapid infiltration of water to underlying aquifers resulting in very few streams on O‘ahu being perennial over their entire reach. The two largest perennial streams on O‘ahu, Kahana and Waikele streams, have annual median streamflow of around 1.05 cubic meters per second (cms). The majority of perennial streams on O‘ahu have annual daily median flows of less than 0.1 cms. The flashy nature of runoff and the paucity of large perennial streams precludes large-scale development of surface-water on O‘ahu and leads to near-total reliance on groundwater for water supply for the island’s roughly 1 million residents [6].
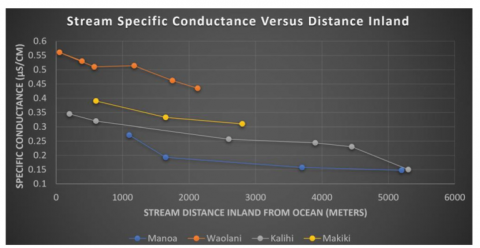
Figure 1. Increase in stream specific conductance during flow through urban O‘ahu
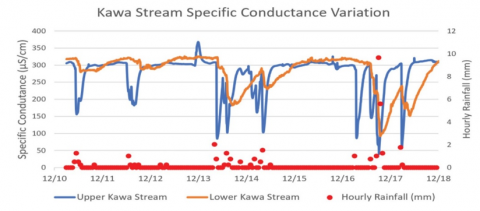
Figure 2. Variation in specific conductance in Kawa stream in response to rainfall
Perennial streamflow occurs on O‘ahu in watersheds that receive significant groundwater discharge. These include areas where erosion has incised valleys into rift zones and the stream course intersects the elevated water tables created by the nearly impermeable dikes within the rift zones of the volcano, in upland areas, and near sea level where the stream course intercepts shallow perched or basal groundwater.
Groundwater discharge to streams is known as baseflow, which becomes the dominant component of streamflow during periods of dry weather. Dike impounded groundwater is the dominant contributor to baseflow in streams on O‘ahu. Perched groundwater also contributes to stream baseflow, especially in alluvium and rocks associated with the post-erosional phase of activity encountered in valleys in the Honolulu area and in windward O‘ahu. basal groundwater can also enter the coastal sections of streams where the bottom of the stream intercepts the top of the basal lens between streambed elevations of 0 to 7.6 meters above sea level in areas where no coastal confining layer exists. Groundwater can also enter streams through springs. Springs form when a geologic structure (e.g., fault or fracture) or topographic feature (e.g., side of a hill or a valley) intersects groundwater either at or below the water table. This can discharge groundwater onto the land surface, directly into the stream, or into the ocean [7]. Under drought conditions, streamflow in windward O‘ahu streams, where flow is dominated by dike impounded groundwater discharge, can decrease to about half the median flow, while flow in perennial streams in leeward O‘ahu can decline to between 10 and 25% the stream’s median flow [8].
Streams in Hawai`i gain water along some reaches and lose water along other reaches depending on local geohydrologic conditions [7]. A gaining stream is simply one in which groundwater flows into the stream and adds to the discharge of the stream.
During periods of low flow, the quality of the groundwater controls surface-water quality. A vertical profile of samples was collected from two deep monitoring wells located in Central O‘ahu and analyzed for solutes and isotopes [9]. The upper 100 meters of the basal aquifer in Central O‘ahu was composed of water recharged from local rainfall and irrigation return water that fell or was applied over the previous few decades. Wastewater released due to the continued use of OSDS and from sewage exfiltration would also impact the upper portion of the underlying perched or basal aquifers encountered as wastewater percolates through the vadose zone. This upper portion of the basal and perched groundwater bodies is the zone that contributes groundwater to streams in their lower reaches where samples were collected during this study.
Figure 1 shows the increase in specific conductance measured in four streams in leeward O‘ahu as they flow from the mountains toward the sea. This increase in specific conductance reflects the higher concentration of dissolved chemicals (anions, cations, nutrients, pharmaceuticals, etc.) present in groundwater that discharge to these streams at lower elevations compared to the levels present from water discharging from the dike impounded rift zones, which serves as the source of baseflow in the upper reaches of the streams.
Figure 2 shows the variation in specific conductance measured in Kawa stream as a result of rainfall over an eight-day period in 2021. Kawa stream is a small (0.08 cms average annual flow), perennial spring fed stream in windward O‘ahu. The upper monitoring site was located just downstream of the upper springs which supply baseflow to the stream, while the lower monitoring site was located one-kilometer downstream. Flow in this stream becomes dominated by groundwater input within a day or two after moderate rainfall events based on the rapid recovery in specific conductance to spring conductance values (~300 µS/cm).
1.2 Anthropogenic markers of sewage contamination-carbamazepine, sulfamethoxazole and caffeine
Carbamazepine, sulfamethoxazole and caffeine are known as emerging contaminants, which describes pollutants that have been detected in water bodies, may have ecological or human impact, and typically are not regulated under current environmental laws. These compounds are also known as micropollutants because they are typically present in trace quantities (part per trillion to billion levels) in the environment. These micropollutants enter the environment during our daily routines as we consume, flush away, or wash these compounds down the sink. Carbamazepine, caffeine and sulfamethoxazole represent the most frequently detected pharmaceuticals in treated wastewater [10]. As a result, these compounds are increasingly used as anthropogenic markers of sewage contamination.
Carbamazepine is a commonly prescribed anticonvulsant, pain relief and bipolar disorder treatment drug. Sulfamethoxazole is an antibiotic prescribed to treat common bacterial infections including urinary tract infections, middle ear infections, bronchitis and diarrhea. Caffeine is a naturally occurring stimulant found in coffee, soda, tea, chocolate and energy drinks. Carbamazepine, caffeine and sulfamethoxazole were the first, third and sixth (62.3%, 56.1%, 40.7%) most commonly detected pharmaceutical compounds in 1,052 river samples collected from 104 countries worldwide in a recently published global-scale study [11]. Caffeine was detected in river samples collected from every continent while carbamazepine was detected in rivers on all continents except Antarctica and sulfamethoxazole on all continents except Antarctica and Oceania (Australia and New Zealand). The common detection of carbamazepine and sulfamethoxazole is attributed to their conservative behavior in the environment with carbamazepine being somewhat more persistent. The common detection of caffeine is due the high levels and ubiquitous nature of its consumption. The average concentrations of carbamazepine, sulfamethoxazole and caffeine measured in streams worldwide were 85, 262 and 1,510 nanograms per liter (ng/L), respectively [11].
The relative stability of carbamazepine and sulfamethoxazole enables detection at larger distances from sewage release sites while caffeine serves as a better tracer for detecting recent, proximal releases of sewage or grey water, given its ephemeral nature and higher initial concentration levels in released untreated wastewater.
1.3 Pharmaceutical concentrations in sewage in Hawaii
Researchers at the University of Hawaii measured the concentration of caffeine in sewage in the main sewer line exiting Manoa Valley on O‘ahu to range from 5,000 to 103,400 parts per trillion (ppt, ng/L), with the highest flux of caffeine (2.4 milligrams/second) exiting the valley between 8 and 11 AM [12]. The Safe Drinking Water branch of the State of Hawaii Department of Health (HDOH) conducted two rounds of sampling of raw wastewater influent at four WWTP and also collected 13 samples of treated wastewater effluent generated at 13 WWTP facilities that produce reclaimed water throughout the State of Hawai‘i [13]. LC-MS-MS methods were used to analyze these samples. Carbamazepine was not detected in the wastewater influent; likely due it being masked by other constituents present in the wastewater during analysis.
Table 1. Carbamazepine, Sulfamethoxazole and Caffeine concentrations in Septic Tanks and WWTP Effluent and Influent in Hawai‘i
|
Source |
Carbamazepine (parts per trillion) |
||||
|
Mean |
Median |
Max. Detect |
Count |
Detect Frequency |
|
|
Septic Tanks |
745 |
707 |
1,735 |
26 |
100% |
|
WWTP lnfl uent1 |
ND |
ND |
ND |
8 |
0% |
|
WWTP Effl uent 1 |
113 |
110 |
220 |
23 |
65% |
|
Source |
Sulfamethoxazole (parts per trillion) |
||||
|
Mean |
Median |
Max. Detect |
Count |
Detect Frequency |
|
|
Septic Tanks |
1,630 |
1,550 |
4,240 |
10 |
100% |
|
WWTP Influent1 |
986 |
940 |
2 , 20 0 |
8 |
100% |
|
WWTP Effluent1 |
1,068 |
395 |
5,400 |
16 |
100% |
|
Source |
Caffeine (parts per trillion) |
||||
|
Mean |
Median |
Max. Detect |
Count |
Detect Frequency |
|
|
Septic Tanks |
23 , 614 |
13 , 250 |
83 , 200 |
16 |
100% |
|
WWTP lnfl uent1 |
98,238 |
108,000 |
150,000 |
8 |
100% |
|
WWTP Effl uent 1 |
152 |
33 |
1 , 200 |
23 |
96% |
|
ND=Not Detected due to dilution of sampl e during analysis and peak int erference. |
|||||
|
1Oahu WWTP lnfluent/Efffluent Data from HDOH [11] |
|||||
During the current study, samples were collected from septic tanks at various beach parks on the island of O‘ahu and analyzed for carbamazepine (26 samples), caffeine (20 samples) and sulfamethoxazole (10 samples) using an Enzyme Linked Immunosorbent Assay (ELISA) immunoassay method. Table 1 summarizes the carbamazepine, sulfamethoxazole and caffeine concentrations measured in the septic tanks along with levels measured by HDOH in influent and effluent to Hawaii WWTPs. Using the average concentrations of carbamazepine measured in septic tanks and the average of the sulfamethoxazole and caffeine concentrations measured in the septic tanks and in WWTP influent, the mean concentration of carbamazepine, sulfamethoxazole and caffeine in Hawaii wastewater is around 745, 1,300 and 61,000 ppt, respectively. The mean concentration of ammonia, nitrate (NO3-N) and total phosphate measured during this study in wastewater collected from septic tanks (eight samples) located at a busy public beach park used by a representative cross section of island residents and tourists was 80, 13 and 47 milligrams per liter (mg/l), respectively.
1.4 Pharmaceutical levels measured in coastal urban settings of Honolulu
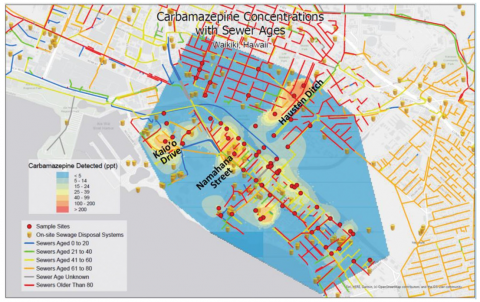
Figure 3. Contoured maximum carbamazepine concentrations in storm drains in the tourist and residential Waikiki and McCully/Moiliili areas
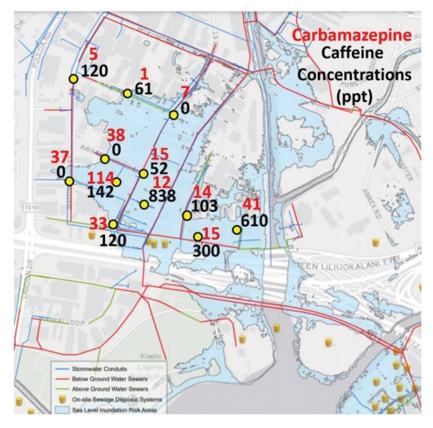
Figure 4. Carbamazepine and caffeine concentrations in storm drains in the industrial Mapunapuna area
A 2022 study measured the spatial distribution of carbamazepine and caffeine concentrations present in the dense network of storm water manholes located in the coastal tourist destination of Waikiki and in the adjacent inland McCully-Moiliili residential areas between November 2020 and December 2021 [4]. Samples were also collected from storm drains in the coastal industrial area of Mapunapuna. In the coastal areas sampled, wastewater contaminated groundwater seeps into the stormwater conveyance pipes and mixes with the tidally driven water that enters the storm drain system from the Ala Wai Canal, which separates the tourist and residential areas in Waikiki. The concentration levels and spatial distribution of detection of these two anthropogenic biomarkers were successfully used to identify areas of ongoing sewage exfiltration in Waikīkī and surrounding residential communities [4]. The impacted groundwater aquifers in the coastal Waikiki and Mapunapuna areas are composed of calcareous and volcanogenic sediments locally referred to as caprock which confine the water in the underlying volcanic rock aquifers. The flux of groundwater through these caprock aquifers is significantly less than fluxes in the underlying basal aquifers, which contributed baseflow to the streams sampled during this study. Figure 3 shows the contoured maximum carbamazepine concentrations measured in storm drain and canal sites sampled (red dots) in the Waikiki and McCully/Moiliili areas while Figure 4 shows the maximum carbamazepine and caffeine concentrations measured in storm drains (yellow dots) in the industrial area of Mapunapuna. The average carbamazepine and caffeine concentrations measured in Waikiki and Mapunapuna storm drains was 31.7 and 2,940 ppt, and 20.0 and 196 ppt, respectively. The concentrations of carbamazepine and caffeine indicate an average wastewater fraction of up to 4.8% to 2.7% in Waikiki and Mapunapuna storm drains, respectively.
Thirty six streams and 11 springs on O‘ahu were sampled under low baseflow conditions between November 2020 and September 2022 during periods of extended drought. Streamflow was typically less than the 10th percentile of daily discharge recorded for the sampled stream by the USGS on the day of sampling. Low flow conditions were considered optimal for detection of a wastewater signature from OSDS use and sewage exfiltration to minimize dilution from baseflow entering the streams from the undeveloped, uncontaminated mountainous interior of the island. Samples were collected from the lower reaches of the streams to maximize the amount of groundwater contribution to the stream from the surrounding urban portions of the watershed in the mid to lower reaches of the stream course.
Two initial rounds of sampling were conducted island-wide in November 2020 and November 2021 during which each stream and spring were sampled twice roughly one week apart. The November 2020 round of samples were analyzed for carbamazepine while the November 2021 round samples were analyzed for carbamazepine and caffeine. Carbamazepine was detected at trace and estimated levels in three springs (Waimanalo Seep, Ulupo Heiau spring and Waimano spring) during the November 2020 sampling. As a result, these springs were repetitively sampled up to August 2022 to determine whether these compounds’ presence was persistent or transient in these springs.
The island of O‘ahu experienced pronounced drought-like conditions between early January 2022 to September 2022. Stream and spring samples collected during 2022 were analyzed for all three pharmaceutical compounds (carbamazepine, caffeine and sulfamethoxazole) and for nutrients (ammonia, nitrate and phosphate) and silica. An initial round of sampling from Lake Wilson was conducted in November 2021 followed by additional sampling in March and April 2022 when water levels in the lake had reached near record lows due to the ongoing drought in the first half of 2022. Figure 5 shows the location of the stream, spring and lake samples collected during this study in relation to OSDS density and the island sewer network.
Figure 5. Location of streams, springs and lake samples analyzed during this study
The streams and springs sampled were located down-gradient of areas with varying densities of OSDS and sewage lines while Lake Wilson receives direct wastewater input from the WWTP that serves Central O‘ahu. Areas of varying densities of OSDS on O‘ahu were divided into four OSDS density range categories: less than 4 units per km2; 4 to 15 units per km2; 15 to 40 units per km2; greater than 40 units per km2. The USEPA has designated areas with an OSDS density of greater than 15 units per km2 as regions where there is a significant potential for causing unacceptable groundwater contamination [1]. Areas with OSDS densities of greater than 40 units/km2 are shaded in orange and red in Figure 5 along with the location of the island’s sewer conveyance system (black lines).
The stream, spring and lake samples were analyzed for general water quality parameters (temperature, specific conductance, salinity, dissolved oxygen, pH and turbidity) in the field using a Hydrolab Quanta and frozen shortly after collection. ELISA test kits manufactured by Eurofins were used to measure the concentration of carbamazepine, sulfamethoxazole and caffeine, typically in batches of 80 samples. The concentrations of the pharmaceutical compounds were classified as either detected, estimated, trace or non-detect. Detected concentrations were above the concentration of the lowest calibration standard (25 ppt for carbamazepine and sulfamethoxazole and 175 ppt for caffeine). Estimated concentrations were between roughly half the lowest calibration standard (12 ppt for carbamazepine and sulfamethoxazole and 85 ppt for caffeine) and the lowest calibration standard. Trace concentrations were between the zero-calibration standard and half the lowest calibration standard. Non-detect samples had measured absorbances greater than the zero standards.
Nitrate, ammonia, phosphate and silica concentrations were determined using colorimetric methods on unfiltered samples. Nitrate concentrations were measured using the cadmium reduction method while ammonia concentrations were measured using the Nessler method. Phosphate concentrations were measured using an adaptation of the Ascorbic Acid method. Silica concentrations were measured using an adaptation of USEPA Method 370.1.
Thirty six streams and 11 springs located down-gradient of areas with varying densities of OSDS and sewage lines on the island of O‘ahu were sampled over a two-year period. A minimum of four samples were analyzed for pharmaceuticals and nutrients from all streams and springs. Caffeine was present in 80% and 94% of the streams and springs sampled above detected (175 ppt) and estimated (80 ppt) concentration levels, respectively. Sulfamethoxazole was present in 6%, 15% and 15% of the streams and springs sampled above detected (25 ppt), estimated (12 ppt) and trace (>1 ppt) concentration levels, respectively. Carbamazepine was present in 3%, 5% and 42% of the streams and springs sampled above detected (25 ppt), estimated (12 ppt) and trace (>1 ppt) concentration levels, respectively. Trace levels of caffeine (>80 ppt), carbamazepine and sulfamethoxazole (12 ppt) were measured in 70%, 23% and 6% of the samples collected, respectively.
Table 2 summarizes the average pharmaceutical and nutrient concentrations measured in streams and springs located in the following four categories of contributory land use: (1) areas with high densities of cesspools and high densities of sewer lines; (2) areas with high densities of cesspools and low densities of sewer lines; (3) areas with low densities of cesspools and high densities of sewer lines; and (4) areas with low densities of cesspools and low densities of sewer lines. Table 2 also includes the pharmaceutical and nutrient data collected from Lake Wilson and its two outlets (Kaukonahua Stream and Wahiawa Ditch).
Table 2. Pharmaceutical and nutrient concentrations in O‘ahu Streams, Springs and Lake Wilson
|
# Pharm Analysls |
Caffeine (ppt) |
Sulfamethoxazole (ppt) |
Carbamazeplne (ppt) |
Nitrate (mg/L) |
Ammonia (mg/L) |
Phosphate (mg/L) |
Silica (mg/L) |
|
Stream and Springs: High Density Cesspool / High Density Sewer Contributory Area |
|||||||
|
268 |
398±502 |
1.5±7.0 |
2.1±7.2 |
0.63±1.26 |
0.12±0.18 |
0.42±0.29 |
25±13 |
|
Stream and Springs: High Density Cesspool / Low Density Sewer Contributory Area |
|||||||
|
79 |
129±155 |
0.0±0.0 |
0.2±0.5 |
0.31±0.74 |
0.06±0.11 |
0.42±0.30 |
35±18 |
|
Stream and Springs: Low Density Cesspool / High Density Sewer Contributory Area |
|||||||
|
167 |
248±678 |
0.4±2.3 |
0.5±1.3 |
0.63±0.88 |
0.06±0.03 |
0.73±0.64 |
34±16 |
|
Stream and Springs: Low Density Cesspool / Low Density Sewer Contributory Area |
|||||||
|
50 |
181±188 |
1.7±5.0 |
0.0±0.0 |
0.19±0.73 |
0.09±0.11 |
0.24±0.24 |
29±7 |
|
All Stream and Spring Samples Combined |
|||||||
|
564 |
298±524 |
1.0±5.1 |
1.3±5.3 |
0.54±1.10 |
0.08±0.15 |
0.52±0.49 |
30±15 |
|
Samples from Lake Wilson and Outlet Streams (Kaukonahua) and Ditch (Wahiawa) |
|||||||
|
142 |
250±420 |
2.4±6.1 |
5.7±9.1 |
0.01±0.05 |
0.08±0.10 |
0.30±0.77 |
8±3 |
Figure 6 shows the average caffeine concentrations measured in the streams and springs sampled during this study in relation to areas of high OSDS and sewer line densities.
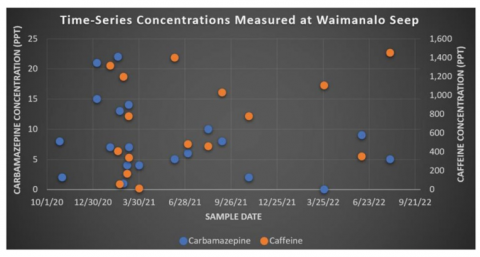
Three springs (Waimanalo seep, Ulupo Heiau and Waimano spring) contained trace or estimated concentration levels of carbamazepine during the two rounds of reconnaissance sampling conducted in November 2020. The Waimanalo seep had the most consistently detectable concentrations levels of carbamazepine and caffeine of the three springs repetitively sampled. Figure 7 shows the persistent nature of and variability in concentration levels of carbamazepine and caffeine in the Waimanalo Seep over the 23-month period sampled. Waimanalo Seep is located in a narrow portion of the island with relatively low coastal groundwater flux rates.
Nitrate, ammonia and phosphorus can be indicators of the presence of wastewater since these nutrients are enriched in wastewater. The average concentration of nitrate, ammonia and total phosphate measured in wastewater collected from septic tanks was 13, 80 and 47 mg/l, respectively. However, nitrate is not unique to wastewater and on O‘ahu its presence in groundwater fed streams may reflect historical use of fertilizers, especially in areas formerly used for sugarcane cultivation [14]. High concentrations of nitrate (30 to 80 mg/kg) are adsorbed on positively charged iron and aluminum oxide particles in the subsoil and saprolite beneath pineapple and sugarcane cultivation areas of central O‘ahu at depths between 6 to 20 meters [15]. Infiltration percolating through the soils and saprolite underlying lands formerly used for sugar cultivation provides a continuous input of nitrate to the underlying basal groundwater aquifers.
The historic use of phosphorus fertilizers has not significantly affected groundwater quality on O‘ahu because phosphate is retained in the aluminum and iron minerals in the soils [7]. Most of the silica in stream water is derived from leaching of volcanic rocks and soil. Rainfall has silica concentrations of less than 1 mg/l and infiltrating water will dissolve the silica present in volcanic rocks and soils leading to silica concentrations in the basal aquifer of between 15 to 40 mg/l [16]. Groundwater concentration levels of above 40 mg/l silica are associated with areas impacted by return irrigation water [14].
Figure 6. Average caffeine concentrations measured in streams and springs
Figure 7. Carbamazepine and caffeine concentrations in Waimanalo Seep
Figure 8. Nitrate concentrations measured in O‘ahu streams and springs
Figure 9. Silica concentrations measured in O‘ahu streams and springs
The spatial distribution of nitrate and silica concentrations measured in streams and springs during this study is shown in Figures 8 and 9. These figures show the general spatial correlation between nitrate and silica level with areas currently or historically used for large-scale agriculture. During this study, the average concentration of nitrate and silica in streams and springs located in watersheds where large-scale agricultural activities were conducted was 0.78 and 40 mg/l, compared to concentration levels of 0.40 and 24 mg/l measured in streams and springs located in areas where no large-scale agricultural activity occurred.
The concentrations of pharmaceutical compounds measured in O‘ahu streams and springs are very low. The mean concentrations of carbamazepine, sulfamethoxazole and caffeine measured in O‘ahu streams and springs (1.3, 0.9 and 298 ng/L, Table 2) were five to three hundred times lower than average levels measured in streams worldwide (85, 262 and 1,510 ng/L) [11]. Many of the streams sampled during the worldwide sampling effort receive direct input of either treated or untreated sewage. Direct release of wastewater to surface water does not occur on O‘ahu except in Lake Wilson which receives around 5.4 mld of tertiary-level treated wastewater from the Wahiawa WWTP. This direct input of wastewater to the lake led to slightly higher average levels of carbamazepine and sulfamethoxazole being present in the lake (5.7 and 2.4 ng/L, Table 2) than average levels measured in O‘ahu streams and springs. Samples were collected from Lake Wilson and its two outlet streams when water levels were quite low, but the volume of water in the lake at the time of sampling was still around 4.5 billion liters. The large volume of water in the lake explains the relatively low concentration levels of pharmaceutical compounds measured in the lake.
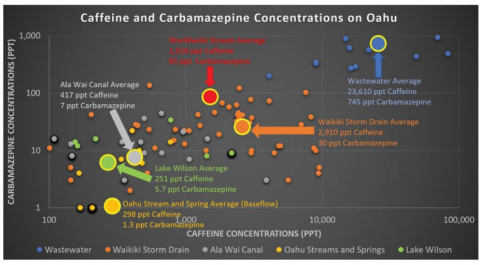
Figure 10 compares the carbamazepine and caffeine concentrations (in log-log scale) measured in wastewater collected from septic tanks on O‘ahu, in Waikiki storm drains, in the Ala Wai Canal, in Lake Wilson and in O‘ahu streams and springs to the worldwide average measured in 1,052 streams sampled in 104 countries on all seven continents [11].
Figure 10. Caffeine and carbamazepine concentrations on O‘ahu. Note the log-log scale
Figure 11. USGS modeled island-wide groundwater flux and streams and springs with highest average measured caffeine concentrations
The measured concentration of pharmaceuticals and nutrients in streams and springs were not statistically different in contributory watersheds with high densities of OSDS and sewer lines from watersheds with low densities of OSDS and sewer lines (Table 2). The OSDS survey estimated wastewater flux in various areas on O‘ahu ([1], Table b-1). The estimated wastewater flux in four areas on O‘ahu where streams were sampled (Makiki, Haleiwa, Waimanalo and Waialua) were 1.25, 1.55, 1.94 and 2.77 mld. The USGS recently prepared a steady-state numerical groundwater-flow model of O‘ahu that simulated groundwater discharge along the coastline of O‘ahu [5]. based on the simulated coastal groundwater flux in the Makiki, Haleiwa, Waimanalo and Waialua areas, the percentage of wastewater in the groundwater in these areas should be 4.6%, 2.2%, 12% and 4%, respectively. However, based on the average pharmaceutical levels in the streams and springs in these areas, the fraction of wastewater in the streams in the Makiki, Haleiwa, Waimanalo and Waialua areas is estimated to be around 2.6%, 0.7%, 3.2% and 0.7%, respectively. These calculations suggest that the actual environmental impact from cesspools in these areas is between 20 to 50% of the wastewater flux estimated based on the assumptions used in the OSDS survey, not including any impact from sewage exfiltration that may be occurring in these areas. The spatial relationship between elevated nitrate concentrations in streams and former sugar lands (Figure 8) indicate the elevated nitrate levels originated from legacy agricultural activities rather than from cesspools and sewage exfiltration. This conclusion is supported by the elevated silica levels measured in streams that flow through former sugar lands.
Figure 11 is a generalized map of simulated groundwater discharge to the ocean in the calibrated numerical groundwater model produced by the USGS [5]. The eight streams and springs that had an average caffeine concentration greater than 300 ppt (based on a minimum of six analyses) are also shown on this figure. Kaukonahua Stream and Wahiawa Ditch samples reflect discharge from Lake Wilson. This figure clearly shows the large differences in groundwater flux simulated to discharge along the shoreline of O‘ahu. The streams and springs where the highest average concentration levels of caffeine were detected during this study were located in areas with relatively low simulated coastal groundwater fluxes, suggesting that in portions of the island with high groundwater fluxes to the coast, wastewater entering the groundwater from cesspools and from exfiltration from sewage conveyance lines is effectively diluted to very low or non-detectable concentration levels.
These findings are consistent with results obtained by HDOH in a community on the island of Hawai`i with high OSDS densities (up to 440 OSDS/square kilometer) and high groundwater flux [13]. Despite the high density of OSDS in the area, the average nitrate concentration measured in groundwater was low (0.2 mg/L) and the measured nitrate levels did not show the expected increase along the groundwater flow paths toward the ocean. The authors suggested that that the actual wastewater contribution from cesspools may be lower than the 750 liter per day per bathroom flux used in the state-wide OSDS assessment [1].
This study found that the current impact to water quality on O‘ahu from legacy cesspools and from wastewater exfiltration from the sewage conveyance systems is significantly less than previously estimated based on OSDS density and estimates of system wide sewage exfiltration. The average concentration of caffeine measured in streams and springs under baseflow conditions was 18% the average measured in streams worldwide, while the levels of carbamazepine and sulfamethoxazole were only 1.4% and 0.6% of the worldwide average. The presence of elevated nitrate concentrations in some streams and springs on O‘ahu is predominately related to legacy agricultural activities rather than from ongoing wastewater releases.
Appendix A contains the average pharmaceutical (caffeine, sulfamethoxazole, carbamazepine), nutrient (nitrate, ammonia, phosphate) and silica concentrations measured in the streams, springs, lake and septic tanks sampled during this study. The streams and springs are ordered based on the estimated density of cesspools and sewer lines present in the contributory watershed of the stream or spring sampled. The last column in the appendix describes whether the contributory watershed was historically used for large-scale agricultural purposes.
Average Pharmaceutical (Caffeine, Sulfamethoxazole and Carbamazepine) and Nutrient Concentrations in Septic Tanks and Lake Wilson and in Streams and Springs Located in Areas of Varying Densities of Cesspools and Sewer Lines.
|
Appendix A |
|
|||||||||
|
Location |
# of Immuno-Assay Analyses |
Caffeine (ppt) |
Sulfa. (ppt) |
Carb. (ppt) |
Nitrate (NO3-N) (ppm) |
Ammonia (NH4) (ppm) |
Phosphate (ppm) |
Silica (ppm) |
Large-Scale Ag? |
|
|
Wastewater Source |
||||||||||
|
Septic Tanks |
26 |
23,614 |
1,630 |
745 |
13.1 |
85.5 |
44.9 |
NM |
NA |
|
|
High Density Cesspool / High Density Sewer Contributory Area |
||||||||||
|
Waimanalo Seep |
42 |
762 |
0.0 |
7.1 |
0.7 |
0.22 |
0.41 |
4 |
NO |
|
|
Makiki Stream |
18 |
621 |
18.0 |
1.4 |
0.4 |
0.08 |
0.75 |
22 |
NO |
|
|
Inoaole Stream |
8 |
515 |
0.0 |
1.8 |
0.0 |
0.42 |
1.57 |
– |
YES |
|
|
Loi Kalo Spring |
16 |
345 |
0.0 |
0.0 |
0.0 |
0.08 |
0.34 |
39 |
NO |
|
|
Waolani Stream |
31 |
256 |
0.0 |
5.3 |
0.6 |
0.11 |
0.54 |
23 |
NO |
|
|
Kalauao Stream |
9 |
238 |
0.0 |
0.2 |
0.3 |
0.03 |
0.37 |
48 |
NO |
|
|
Heeia Stream |
4 |
236 |
0.0 |
– |
0.4 |
0.03 |
0.12 |
29 |
YES |
|
|
Manoa/Palolo Stream |
26 |
232 |
4.7 |
0.3 |
0.2 |
0.08 |
0.34 |
20 |
NO |
|
|
Kahawai Stream |
26 |
200 |
0.0 |
0.1 |
2.6 |
0.15 |
0.30 |
36 |
YES |
|
|
Ie Ie Park Spring |
18 |
198 |
0.0 |
0.0 |
0.8 |
0.06 |
0.46 |
48 |
NO |
|
|
Kalihi Stream |
21 |
196 |
0.0 |
2.2 |
0.5 |
0.05 |
0.40 |
17 |
NO |
|
|
Kunawai Spring |
8 |
157 |
0.0 |
0.3 |
0.0 |
0.07 |
0.65 |
30 |
NO |
|
|
Ahuimanu Stream |
10 |
130 |
0.0 |
0.0 |
0.1 |
0.03 |
0.17 |
25 |
NO |
|
|
Kahaluu Stream |
11 |
63 |
0.0 |
0.0 |
0.2 |
0.03 |
0.22 |
27 |
NO |
|
|
Nuuanu Stream |
5 |
0 |
0.0 |
0.0 |
0.1 |
0.08 |
0.30 |
15 |
NO |
|
|
Pauoa Stream |
7 |
– |
– |
0.0 |
0.0 |
0.05 |
0.70 |
20 |
NO |
|
|
Waialae Nui Stream |
4 |
– |
– |
0.0 |
0.2 |
0.62 |
0.19 |
– |
NO |
|
|
Kaupuni Stream |
0 |
– |
– |
– |
0.0 |
0.03 |
0.31 |
– |
YES |
|
|
High Density Cesspool / Low Density Sewer Contributory Area |
||||||||||
|
Waihee Stream |
4 |
272 |
0.0 |
– |
0.0 |
0.02 |
0.24 |
27 |
YES |
|
|
Anahulu Stream |
12 |
168 |
0.0 |
0.0 |
1.2 |
0.06 |
0.43 |
37 |
YES |
|
|
Paukauila Stream |
9 |
167 |
0.0 |
0.0 |
0.5 |
0.20 |
0.67 |
45 |
YES |
|
|
Waimanalo Stream |
17 |
141 |
0.0 |
0.2 |
0.2 |
0.06 |
0.23 |
31 |
YES |
|
|
Loko Ea Fishpond |
12 |
70 |
0.0 |
0.0 |
2.9 |
0.04 |
0.30 |
48 |
YES |
|
|
Kiikii Stream |
9 |
0 |
0.0 |
0.0 |
1.5 |
0.25 |
0.66 |
35 |
YES |
|
|
Haaula Seep |
4 |
– |
– |
0.0 |
– |
– |
– |
– |
NO |
|
|
Kaunala Seep |
12 |
– |
– |
0.3 |
0.0 |
0.49 |
0.29 |
2 |
NO |
|
|
Anahulu River Spring |
0 |
– |
– |
– |
2.5 |
0.03 |
0.92 |
69 |
YES |
|
|
Low Density Cesspool / High Density Sewer Contributory Area |
||||||||||
|
Ulupo Heiau Spring |
17 |
670 |
0.0 |
2.5 |
1.2 |
0.03 |
1.96 |
33 |
NO |
|
|
Pukele Stream |
4 |
304 |
0.0 |
0.0 |
0.8 |
0.16 |
0.40 |
19 |
YES |
|
|
Waimano Stream |
30 |
295 |
3.0 |
2.2 |
0.4 |
0.08 |
0.45 |
43 |
NO |
|
|
Waipahu Spring |
23 |
235 |
0.0 |
0.2 |
0.7 |
0.08 |
0.78 |
47 |
YES |
|
|
Kapakahi Stream |
26 |
215 |
0.0 |
0.3 |
0.3 |
0.11 |
0.82 |
52 |
YES |
|
|
Kaneohe Stream |
8 |
173 |
0.0 |
0.3 |
0.8 |
0.03 |
0.22 |
22 |
NO |
|
|
Waikele Stream |
8 |
172 |
0.0 |
0.0 |
1.0 |
0.02 |
0.66 |
48 |
YES |
|
|
Kalauoa Spring |
9 |
128 |
0.0 |
0.0 |
0.0 |
0.01 |
0.78 |
43 |
NO |
|
|
Keaahala Stream |
14 |
128 |
0.0 |
0.3 |
0.1 |
0.02 |
0.25 |
28 |
NO |
|
|
Kawa Stream |
23 |
88 |
2.3 |
0.5 |
0.7 |
0.04 |
0.53 |
17 |
NO |
|
|
HECO Spring |
5 |
86 |
0.0 |
0.0 |
0.0 |
0.00 |
0.70 |
– |
NO |
|
|
Moanalua Stream |
0 |
|
|
|
0.1 |
0.11 |
0.51 |
22 |
NO |
|
|
Maunawili Stream |
0 |
– |
– |
– |
0.4 |
0.05 |
0.29 |
23 |
NO |
|
|
Low Density Cesspool / Low Density Sewer Contributory Area |
||||||||||
|
Waiawa Stream |
11 |
228 |
0.0 |
0.0 |
0.0 |
0.16 |
0.21 |
21 |
YES |
|
|
Kapaa Stream |
19 |
168 |
2.1 |
0.0 |
0.1 |
0.21 |
0.51 |
27 |
NO |
|
|
Kahana Stream |
18 |
0 |
|
0.0 |
0.1 |
0.03 |
0.02 |
22 |
NO |
|
|
Kahuku Stream |
2 |
– |
– |
0.0 |
0.0 |
0.03 |
0.86 |
48 |
YES |
|
|
Honouliuli Stream |
0 |
– |
– |
– |
0.7 |
0.07 |
0.30 |
25 |
YES |
|
|
Kahana Iki Stream |
0 |
– |
– |
– |
0.0 |
0.05 |
0.21 |
31 |
NO |
|
|
Samples from Lake Wilson and Outlet Streams (Kaukonahua) and Ditch (Wahiawa) |
||||||||||
|
Kaukonahua Stream |
16 |
730 |
9.7 |
1.5 |
0.0 |
0.13 |
2.63 |
7 |
NO |
|
|
Wahiawa Ditch |
22 |
326 |
2.8 |
4.9 |
0.0 |
0.09 |
0.22 |
8 |
NO |
|
|
Lake Wilson |
104 |
214 |
1.9 |
10.9 |
0.0 |
0.08 |
0.19 |
8 |
NO |
|
|
COMbINED |
142 |
251 |
2.4 |
5.7 |
0.0 |
0.08 |
0.30 |
8 |
NO |
|
[1] Whittier, R.B., El-Kadi, A.I. (2009). Human and Environmental Risk Ranking of Onsite Sewage Disposal Systems. Report prepared for the Hawaii Department of Health Safe Drinking Water branch, December 2009.
[2] American Society of Civil Engineers (ASCE). (2019). 2019 Hawaii Infrastructure Report Card. Retrieved from www.infrastructurereportcard.org/hawaii
[3] Amick, R.S., Burgess, E.H. (2000). Exfiltration in Sewer Systems. EPA/600/R-01/034, December 2000.
[4] Spengler, S.R., Heskett, M. (2022). Identification of sewage exfiltration in coastal areas through the monitoring of drugs and stimulant concentrations in urban storm drains. WIT Transactions on the Built Environment, 208: 67-79. https://doi.org/10.2495/ST210061
[5] Izuka, S.K., Rotzoll, K., Nishikawa, T. (2021). Volcanic Aquifers of Hawaii-Construction and calibration of numerical models for assessing groundwater availability on Kaua‘i, O‘ahu, and Maui: U.S. Geological Survey Scientific Investigations Report 2020-5126, 63. https://doi.org/10.3133/sir20205126
[6] Hunt, C.D. (1996). Geohydrology of the island of O‘ahu, Hawai`i. U.S. Geological Survey Professional Paper; 1412–b.
[7] Oki, D.S., Brasher, A. (2003). Environmental setting and the effects of natural and humanrelated factors on water quality and aquatic biota, O‘ahu, Hawai`i. U.S. Geological Survey Water-Resources Investigations Report 03-4156.
[8] Cheng, C.L. (2016). Low-flow characteristics for streams on the Islands of Kaua‘i, O‘ahu, Moloka‘i, Maui, and Hawaii, State of Hawaii: U.S. Geological Survey Scientific Investigations Report 2016-5103, 36.
[9] Voss, C.I., Wood, W.W. (1993). Synthesis of geochemical, isotopic and groundwater modelling analysis to explain regional flow in a coastal aquifer of Southern O‘ahu, Hawai`i. In Mathematical models and their applications to isotope studies in groundwater hydrology. IAEA-TECDOC-777.
[10] Reyes, N.J.D.G., Geronimo, F.K.F., Yano, K.A.V., Guerra, H.B., Kim, L.H. (2021). Pharmaceutical and Personal Care Products in Different Matrices: Occurrence, Pathways, and Treatment Processes. Water, 13: 1159. https://doi.org/10.3390/w13111159
[11] Wilkinson, J.L., Boxall, A.B., Kolpin, D.W., Leung, K.M., Lai, R.W., Galbán-Malagón, C., Teta, C. (2022). Pharmaceutical pollution of the world’s rivers. Proceedings of the National Academy of Sciences, 119(8): e2113947119. https://doi.org/10.1073/pnas.2113947119
[12] Shelton, J.M., Kim, L., Fang, J., Ray, C., Yan, T. (2011). Assessing the severity of rainfall-derived infiltration and inflow and sewer deterioration based on the flux stability of sewage markers. Environmental Science & Technology, 45: 8683-8690. https://doi.org/10.1021/es2017523
[13] Hawaii Department of Health (HDOH). (2019). 2018 Groundwater Status Report. Appendix H: Assessing the Presence and Potential Impacts of Pharmaceutical and Personal Care Products (PPCPs) on Groundwater and Drinking Water.
[14] Visher, F.N., Mink, J.F. (1964). Ground-water resources in southern O‘ahu, Hawaii. U.S. Geological Survey Water-Supply Paper 1778, 133.
[15] Deenik, J.L. (1997). Liming effects on nitrate adsorption in soils with variable charge clays and implications for ground water contamination: M.S. thesis, University of Hawaii at Manoa, 140.
[16] Davis, S.N. (1969). Silica in Streams and Ground Water in Hawaii. Water Resources Research Center Technical Report No. 20, January 1969.