Tadaharu Ishikawa* | Ryosuke Akoh | Hiroshi Senoo![]()
© 2023 IIETA. This article is published by IIETA and is licensed under the CC BY 4.0 license (http://creativecommons.org/licenses/by/4.0/).
OPEN ACCESS
Rain runoff exceeding river channel capacities has been increasing in Japan. Although excess runoff events are still local and not very frequent, this trend is thought to be growing due to global climate change, and the government is discussing the need for flexible disaster mitigation measures by allowing river overflow to enter floodplains. However, the framework for formulating facility design based on this policy has not yet been established. Nevertheless, civil engineers of the early modern age developed flood control systems to avoid catastrophic flooding in important areas by inducing deliberate and safe river overflows without knowledge of modern hydraulics. This paper discusses the flood control strategy common in early modern times using numerical case studies with a shallow water model on three typical types of flood control systems. The results suggest that civil engineers at that time understood the natural flow tendency during flooding based on floodplain topography measurements together with flood trace inspections, allowing them to deal with excess runoff.
early modern times of Japan, flood control strategy, intentional river overflow, numerical simulation
In Japan, due to the water disaster prevention policy established in 1964, which requires discharging floodwater quickly to the sea by continuous levee systems, embankments have been under construction for several decades along 109 state-managed A-rank rivers. However, although the target flood scale in the 1964 policy assumed a flood return period of 100 and 200 years [1], recent research indicates the achievement of a return period of only 50 years on average [2]. Therefore, rain runoff that exceeds the river channel capacity (hereafter referred to as excess runoff) has been increasing in Japan, causing flood damage somewhere in the country almost every year [3]. Although the excess runoff is still local and infrequent in each river basin, from a broader perspective, this trend is thought to be growing rapidly due to global climate change. Considering the above situation, the Japanese government announced a new flood control policy that emphasizes the need for flexible disaster mitigation measures in floodplains accepting river overflow [4]. However, a framework for facility design planning based on this policy has not yet been established.
In early modern times in Japan, referred to as the Edo period (about 250 years from the beginning of the 17th century), the large continuous embankments that are common today could not be built. Civil engineers of the day often adopted a discontinuous levee system that dispersed flood impact in the floodplain by inducing deliberate river overflow. The problems faced by civil engineers in the Edo period seem to have been the same as those currently faced, that is, how to deal with excess runoff by allowing river overflow. Therefore, in this paper, after briefly introducing a case analysis of three hydraulic engineering projects in the Edo period conducted by the author [5-7], the common flood control strategies in those days are described and their application to solving today’s problems are summarized.
2.1 Study sites
The three study sites are shown in Figure 1. Each site has a different type of flood control facility, as shown in Table 1. They are described briefly in Sections 3–5, and further details can be found in the references indicated in the table.
Figure 1. Study sites
Table 1. List of case studies
|
No. |
River name |
Prefecture |
Facility type |
Reference |
|
(1) |
Asahi riv. |
Okayama |
Flood bypass |
[5] |
|
(2) |
Sumida riv. |
Tokyo |
Detention basin |
[6] |
|
(3) |
Kurobe riv. |
Toyama |
Open levees |
[7] |
2.2 Methodology
An ordinary two-dimensional shallow flow equation was converted into a finite difference equation using the finite volume method with an unstructured triangular mesh system, taking the flow rate over the levees into account using the formula for a broad crested weir. All of the equations are given in Akoh et al. [8]. Because of the absence of data on floodplain topography in the Edo period, a digital elevation model with a spatial resolution of 5 m provided by the Geospatial Information Authority of Japan was used. Large-scale topographic changes such as embankments for highways and railways that occurred in the 20th century were removed by interpolation from the surroundings. Assumptions made for the flood hydrographs are described in Sections 3–5 for each site.
3.1 Overview of flood control facilities
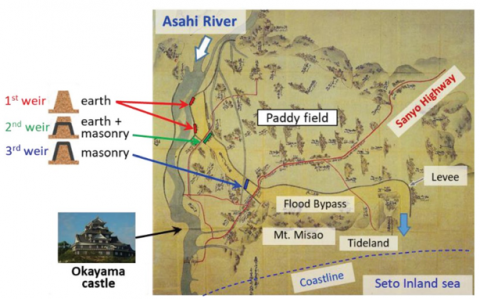
Figure 2 is a pictorial map drawn in the late 17th century showing an overview of the Okayama Alluvial Plain, which was formed by the Asahi River. The terrain generally slopes toward the south, and in pre-Edo times, the Asahi River diverged toward the south. In the early 17th century, branch streams were collected into one channel near Okayama Castle on the west side of the plain, and the old stream channels were converted for irrigation use. However, because frequent floods hindered the development of the castle town, the feudal clan government constructed a large-scale flood bypass toward the south, which discharged floodwaters to the Seto Island Sea from the east side of Mt. Misao.
Figure 2. Pictorial map of the Okayama Alluvial Plain in the 17th century
The construction process for the flood bypass was as follows [9]: In 1669, two portions of the Asahi River embankment, depicted as the first weir on the map, were lowered to induce river overflow. This earthen weir was intended to be washed away immediately after flood overtopping. A part of the backup levee behind the first weir was a spillway referred as the second weir, and was a masonry structure with an earthen cap to stably fix the location of overtopping, thereby stopping flood dispersion. In 1670, a continuous embankment with a relative height of 2–3 m was constructed to form the outline of the floodway. Overflow water from the second weir was channeled into the floodway. The land in the floodway was generally used as paddy fields, and flashboard facilities were installed to close the levee openings to road traffic only during floods. A third weir of masonry was built in the floodway in the same year, but its function is not clear at present because of its destruction by a large flood in the 19th century.
3.2 Results of numerical flow simulation
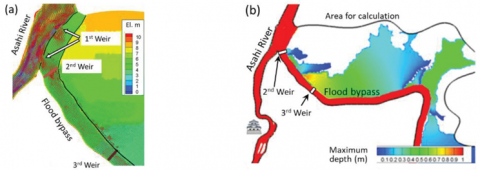
After the construction of the flood bypass, while the frequency of flooding in the castle town decreased, it increased in the rural areas to the east. This “flood relocation” seems to have been intentional, as shown in Figure 3. Figure 3(a) shows the flow conditions near the head of the floodway in a large flood with a return period of about 12 years. The earthen first weir had already washed out, and the flood intruded into the flood bypass through the two openings. The flow direction is rectified by the second weir toward the bypass channel. Note that levee overtopping was induced upstream from the third weir.
Figure 3(b) shows the maximum inundation depth distribution in the floodplain. The red part is the water channel. The inundation water is drained to the Seto Inland Sea via the eastern part of Mt. Misao. Excluding the vicinity of the third weir, the inundation depth on the paddy area is 0.7 m or less, and most of it is 0.5 m or less, so it is unlikely that the paddy fields were destroyed by flooding.
Figure 3. Flow field of Asahi River flooding: (a) head of flood bypass, (b) inundation depth on the floodplain
Table 2. Hydraulic effect of food control stages
|
Stage |
Flood peak discharge |
Flood return period |
|
1st |
2400 m3/s 2800 m3/s |
6.1 years 8.7 years |
|
2nd |
3200 m3/s |
12.2 years |
From eight numerical simulations with different inflow conditions, it was speculated that the inundation safety of the castle town was improved in two stages. The first stage was due to the decrease in the flow rate of the Asahi River by branching the flow to the flood bypass, and the second stage was due to the flow rate decrease by overflow to the flood plain on the eastern side. Table 2 summarizes the hydraulic effects of each stage. The flood return period corresponding to the river flow rate is estimated from the probability plot of the annual maximum flow rate in the last 70 years. This result showed that the flood bypass was not just a flood branching facility, but a mechanism to relocate the flood from the castle town to the eastern rural areas.
In fact, the eastern peasants petitioned the local government to strengthen the flood bypass embankment, but the government did not accept this and instead provided tax exemptions. Because the 17th century was a time when the development of commerce and industry in the castle town became economically important, it is considered that the construction of the flood bypass was a part of the new policy of economic balancing between the castle town and the agriculture area. Because Okayama Castle itself was located on a hill and the castle town in the west was in a lowland, it is probable that the target of the flood control of Asahikawa was not Okayama Castle but the castle town. Moreover, as can be seen from the tax exemption for the eastern rural areas, the lives of farmers were not neglected.
4.1 Overview of flood control facilities
In 1603, the political centre of Japan moved from the Kansai Area, comprising Kyoto and Osaka, to Edo (now Tokyo), which was a new city built starting in 1590. After developing the waterway transportation network in the 17th century, Edo became Japan’s largest economic, cultural, and consumption centre. after the edo administration disappeared due to political changes in 1868, edo was renamed tokyo, and in 1871 the new administration established tokyo as the capital.
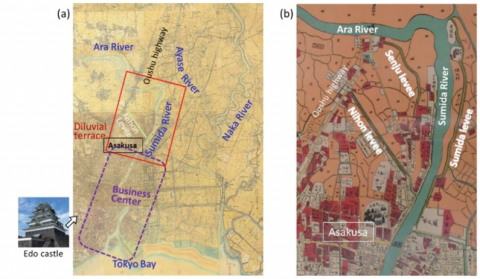
Figure 4(a) shows the first accurate map of Tokyo based on modern surveying, done in 1886 when the city’s structure and land use had not yet changed substantially since the Edo period. Edo Castle and the ruling class dwellings were located on the diluvial terrace on the west side. The townspeople’s residential areas were on the alluvial lowlands on the east side. Large-scale trading companies and warehouses were established on the banks of the Sumida River, which runs south toward Edo (Tokyo) Bay. To protect this area from flood damage, a large levee system was built in the upper reaches of the Sumida River, as shown in Figure 4(b), the area of which is marked with a red rectangle in Figure 4(a). Three levees were arranged in a funnel shape to dam up the floodwater from the upper reaches of the Sumida River, called the Ara River. The Nihon Levee, located apart from the river channel, was the most important among the three, and therefore, the overall flood control works are called the “Nihon levee system” hereafter. The large, irregular plots upstream of the Nihon levee represent paddy fields. The finely divided plots around the Asakusa area show the urban area at the north-eastern end of Edo. The Nihon levee was built to a height of 3 m in 1621 and was removed in 1927.
It should be noted that the Ayase River joins the Sumida River on the upper right of Figure 4(b). As shown in Figure 4(a), a canal connects the Ayase River to the Naka River, flowing east toward Tokyo Bay. These waterway connections were mainly used for water transport but may have served as drainage channels during floods.
4.2 Results of numerical flow simulation
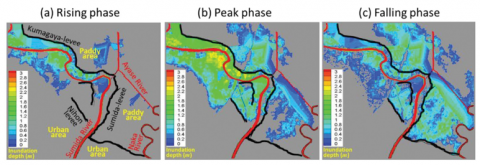
The flood hydrograph used for numerical simulation is based on flooding observed in June 2007, with the runoff water volume preserved and the peak discharge compressed to 2,500 m3/s. The reason for this is that before the levee construction in the second half of the 20th century, the flood hydrograph reaching the Edo area was smoothed by the inundation in the upper reaches of the Ara River. The figure of 2,500 m3 /s was described in the 1911 River Improvement Plan.
Figure 5 shows the inundation depth distribution at three phases of flooding. At the peak of the flood, the floodplain on the upstream side is full, but the water depth just upstream of the Nihon levee is about 2 m, and the embankment of 3 m was sufficient. The inundation water flowed into the paddy fields on the north and east sides through the opening at the point of contact with the Ayase River, and was finally discharged to Edo Bay via the Naka River. It was a kind of flood bypass, in other words.
Figure 4. Flood control facility of Sumida River: (a) first modern map of Tokyo (1886), (b) Nihon levee in a pictorial map (1859)
Figure 5. Inundation depth distribution in the Nihon levee system
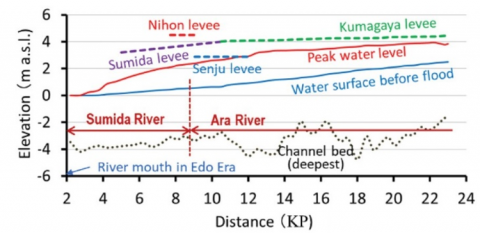
Figure 6. Longitudinal water surface profile in Nihon levee system
The Nihon levee had another flood control function. Figure 6 shows the longitudinal shape of the river. The KP on the horizontal axis is the distance (in kilometres) from the current river mouth. The river mouth in the Edo period was located at 2 KP. The coloured dotted lines indicate the levee crowns at that time. The solid lines in light blue and red are the water surface profiles before and at the flood peak, respectively, obtained by numerical simulation. At the flood peak, the Nihon levee raises the water surface about 2 m, but the water level at the river mouth is constant, so a very large water surface slope occurs. As a result, the flow rate in the Sumida River increases greatly.
The configuration described above indicates that the Nihon levee was not a dike to block the flood flow, but was a facility to induce a water level rise to improve the drainage efficiency of the Sumida River and to disperse the flood toward the Naka River.
5.1 Overview of flood control facilities
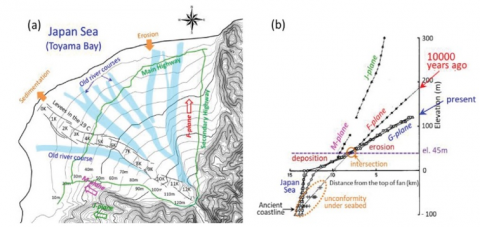
The Kurobe River is a torrent river that originates in a mountain range about 3,000 m above sea level and flows to the Japan Sea through a canyon about 80 km long. A large amount of sediment discharged from the canyon forms the Kurobe Alluvial Fan with a radius of 13 km, an average gradient of 1/100 and an apex angle of 50°. The current alluvial fan is a dissected fan formed by the rise in sea level after the Last Glacial Period, the uplift of the mountain range and the subsidence of Toyama Bay. Fragments of the Pleistocene fan remain on both sides (see Figure 7).
Because the river diverged into many streams on the alluvial fan and the position of the main channel was not stable, it was difficult to pass through the alluvial fan until the beginning of 19th century. The sky-blue bands in the figure show the traces of main river courses before the 19th century. The black solid lines along the current river channel are the levee positions measured near the end of the 19th century under the guidance of an engineer from the Netherlands. The system comprises many discontinuous levees. It should be noted that the levees overlap at the levee openings on the downstream side, while those on the upstream side are simple openings without overlap.
5.2 Results of numerical flow simulation
The flood hydrograph used for numerical simulation is based on that of the maximum flood observed in 1969, and it was compressed to a peak discharge of 3,000 m3 /s, corresponding to a 10-year return period, which was determined based on the records of river overflow from the mid-19th century.
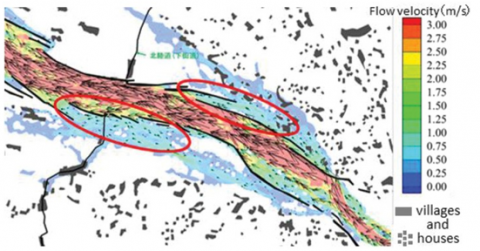
Figure 8 is a flow velocity field at the middle river reach obtained from the calculation results, where the colour represents the absolute value of the flow velocity and arrows represent the velocity vector. It can be seen that the inundation water flows down the old river channels outside of river banks at a slower speed than the main stream and returns to the river channel from the downstream levee openings.
From the above results, it is considered that the amount of water exceeding the capacity of the main river channel was intentionally discharged through the upstream levee openings into the old river traces; that is, the old river channels were used for flood bypass (see Figure 9). Because the flood duration in the Kurobe River is short, it was possible to drain the flood water into that river channel after the flood peak by using the speed difference between the flood flow and the river channel flow.
Figure 7. Topography of Kurobe Alluvial Fan: (a) contour map and (b) radial section
Figure 8. Flow velocity field near the flood peak at the middle Kurobe River reach
Figure 9. Flood control by the open levee system
During the Edo period, although no academic equivalent to modern hydraulics existed, the civil engineers empirically understood the basic principle of water flow, such as “the flow intensity depends on the ground surface slope”. In addition, geodesy technology, including the plate table, level surveying, and geometric analysis, had already been developed, and measurement of topography in areas with few obstacles was possible with considerable accuracy. Therefore, it is considered that the engineers at that time could predict the flood flow based on the micro-topography and the ground surface conditions (e.g., old river channel traces and surface soil conditions). In this section, accordingly, their common thinking in the flood control strategy at that time is discussed based only on the topography and the ground surface conditions.
6.1 Asahi River
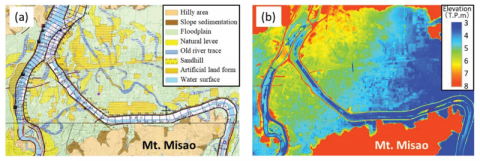
Figure 10 shows the landform classification and the ground elevation map for the Okayama Alluvial Plain, the range of which is almost the same as that in the pictorial map in Figure 2.
Figure 10. Topography of the Okayama Alluvial Plain: (a) land-form classification and (b) ground elevation
From Figure 10(a), it can be seen that many old river channel traces exist on the eastern floodplain, although they have been partially cut by recent artificial land-forming. Because the overall topography shown in Figure 10(b) descends to the southeast side, it is considered that a portion of large floods from the Asahi River overflowed near the head of the flood bypass, spread over the alluvial plain slope and flowed around the east side of Mt. Misao to reach the sea.
Therefore, it can be said that discharging a flood volume exceeding the channel capacity of Asahi River to the “old inundation route” was a reasonable flood control method that fit the natural topography. In addition, it is considered that to mitigate the damage from flooding on the east farming villages of the alluvial plain caused by the intentional river overflow, the flood flow was unified into the flood bypass channel. To prevent further large flooding exceeding the flood bypass capacity, the inundation area was restricted to the southern part of the alluvial plain due to the intentional overflow from the third weir, as shown in Figure 2.
6.2 Sumida River
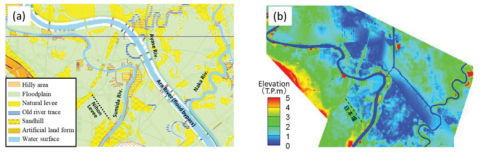
Figure 11 shows the landform classification and the ground elevation for the northeast area of Tokyo, the range of which corresponds to the north half of Figure 4(a). Figure 11(a) shows the Arakawa Flood Bypass built in the early 20th century, while in Figure 11(b), it was eliminated by interpolating from the elevation on both sides of the waterway.
The landform classification map shows that there is a wide natural levee and some recent artificial land forms above it, just outside of the channel bend of Sumida River. The elevation map shows that the ground between the Sumida River and Naka River has an eastward slope. Because the natural levee was made by sand deposition caused by river overflow, these maps indicate that some flooding from the Sumida River flowed toward the Naka River during and before the Edo period.
Figure 11. Topography of the northeast area of Tokyo: (a) land-form classification and (b) ground elevation
Based on these topographical characteristics and the numerical simulation results shown in Figure 5, it is considered that the civil engineers in the Edo period intentionally raised the water level of the Sumida River by means of the Nihon levee to discharge some of the flooding of Sumida River into the old inundation route toward the Naka River.
It should be noted that the location of the Arakawa Flood Bypass, which was planned in 1911 and completed in 1930, corresponded closely to the course of the historic inundation flow route (see Figure 11(a)). This was because the route was the best for discharging flood waters from the Ara River toward Tokyo Bay smoothly.
6.3 Kurobe River
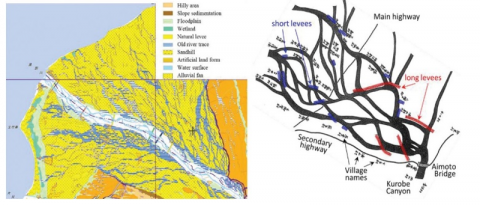
Figure 12 shows the land-form classification for the Kurobe alluvial fan and a pictorial map depicting the Kurobe River in the middle of the Edo period. The original 1785 pictorial map was rotated to align the top with the direction of north. In Figure 12(a), almost the entire alluvial fan is covered with the old river channel. Therefore, if excess flooding passed through the old, unmodified inundation channel, the villages on the entire alluvial fan surface would receive substantial flood damage. Therefore, in the early stage of levee construction, the direction of flooding was restricted by levees near the top of the alluvial fan.
Figure 12. Topography of the Kurobe Alluvial Fan: (a) land-form classification and (b) Kurobe River and levee system from a pictorial map drawn in 1785
In the pictorial map, the levees at that time are indicated with thin lines, and they are coloured in Figure 12(b) for easy viewing. Red means a relatively long embankment and blue means a short embankment. The relatively long levees were located mainly upstream to block the branch streams to restrict the spread of the flood. It is thought that among the remaining few streams, the central channel was used as the main river channel and the channels adjacent to the central channel were used as flood bypasses for excess water from the main river channel.
Although the configurations of the three flood control facility cases in the Edo period described in the previous sections are different from each other, the point common to these was that the part of a flood exceeding the river channel capacity was intentionally discharged to old inundation routes by preparing some structures to control the river overflow and the inundation flow safely and efficiently.
During the time when building rigid continuous levees was not possible, civil engineers planned to let the excess volume of flood flow as naturally as possible rather than building structures to force the flood to remain in the river channel. From their experience of flooding that was more frequent than at present, they probably recognized that the natural floodplain becomes the territory of rivers during large floods.
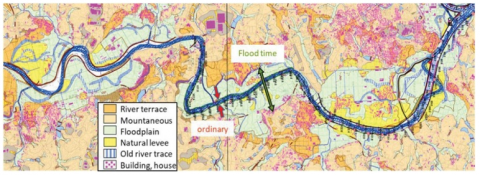
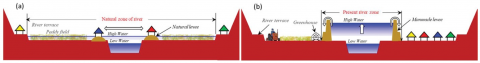
Figure 13 shows the landform classification for the upper basin of a large river in Japan. Floodplains (light green) and natural levees (yellow) are terrains formed by the flooding of rivers, which means that the width of a river in its natural state can be far larger during a flood than that during ordinary flow conditions. Therefore, in this area, houses (pink) are located on high land with no flood risk and on the natural levee with a relatively large relative height, and most of the floodplain is used as paddy fields. This way of living, which respects the river’s natural sovereignty over floodplains, basically has not changed in rural areas since the Edo period. Figure 14(a) shows a cross section of the river shown in Figure 13.
In recent years, the situation in the middle and lower river reaches has changed significantly with the construction of strong continuous embankments. Figure 14(b) shows the cross section of a river in an area where development is in progress. The 1964 River Act defined the river zone as the width between the land side slope toes of both manmade levees. Although this definition of the river zone originally meant the administrative boundary between public and private lands, everyone started using the private land on floodplains as they like, forgetting the river’s natural sovereignty there.
Rivers naturally expand their width as the flow rate increases, as shown in Figure 14(a). When a river current is constrained by embankments, the water level rises as the flow rate increases as shown in Figure 14(b), sometimes causing levee overtopping. Even in modern times, the height of embankments is always limited, and the risk of levee overtopping is increasing due to global climate change. In other words, we are facing the same kinds of problem faced by civil engineers in the Edo period, who could not build embankments high enough to contain a flooded river.
Figure 13. Example of landform classification and residence distribution in the upper basin of a large river
Figure 14. Typical river cross sections: (a) nearly natural state and (b) after levee building
Therefore, the first step in future flood control planning is to know how rivers naturally overflow and how floodwaters naturally flow. The next step is, while respecting the nature of the river, to find a compromise with rivers, that is, to control the flow in the floodplain to some extent to limit flooding damage. Civil engineers in the Edo period found a compromise based on careful topographic surveys and their experience with floods. In contrast, we will be able to find a compromise more easily by numerical flow simulation based on digitized topography using powerful computers.
[1] Ministry of Land, Infrastructure, Transport and Tourism (MLIT). (n.d.). River Planning [Brochure]. Retrieved from https://www.mlit.go.jp/river/pamphlet_jirei/kasen/jiten/yougo/11.htm.
[2] MLIT. (2008). Evaluation of hydraulic safety using aerial laser surveying [Research Report]. Retrieved from http://www.nilim.go.jp/lab/rcg/newhp/seika.files/lp/abst.html.
[3] MLIT. (n.d.). Reports of water related disaster, 2015–2020 [Webpage]. Retrieved from https://www.mlit.go.jp/river/pamphlet_jirei/suigai_report/index.html.
[4] MLIT. (2021). River Basin Disaster Resilience and Sustainability by All, Japan’s New Policy on Water-related Disaster Risk Reduction [Brochure]. Retrieved from https://www.mlit.go.jp/river/kokusai/pdf/pdf21.pdf.
[5] Ishikawa, T., Akoh, R. (2016). Estimation of flood risk management in 17th century on Okayama Alluvial Plain, Japan, by numerical flow simulation. International Journal of Safety and Security Engineering, 6: 455-465.
[6] Ishikawa, T., Akoh, R. (2019). Assessment of flood risk management in lowland Tokyo areas in the seventeenth century by numerical flow simulation. Environmental Fluid Mechanics, 19: 1295-1307. https://doi.org/10.1007/s10652-018-9616-6
[7] Ishikawa, T., Senoo, H. (2021). Hydraulic evaluation of the levee system evolution on the Kurobe alluvial fan in the 18th and 19th centuries. Energies, 14: 4406. https://doi.org/10.3390/en14154406
[8] Akoh, R., Ishikawa. T., Kojima, T., Tomaru, M., Maeno, S. (2017). High-resolution modeling of tsunami run-up flooding: A case study of flooding in Kamaishi city, Japan, induced by the 2011 Tohoku tsunami. Natural Hazards and Earth System Sciences, 17(11): 1871-1883. https://doi.org/10.5194/nhess-17-1871-2017
[9] MLIT, Okayama River Management Office. (2015). Brief history of Hyakkenn River [Brochure].