Peri Namazzadeh | Ramil I. Hasanov* | Ilham Mammadov | Shafa H. Aliyeva | Sima Mahmudova
© 2026 The authors. This article is published by IIETA and is licensed under the CC BY 4.0 license (http://creativecommons.org/licenses/by/4.0/).
OPEN ACCESS
This study assesses the ecological condition of the Caspian Sea, the world’s largest enclosed inland water body, and evaluates technological and policy measures for its protection. A structured synthesis of scientific literature, monitoring reports, and secondary environmental datasets covering 2010–2026 was conducted using the Driving Forces-Pressures-State-Impacts-Responses (DPSIR) framework as a descriptive structure to organize reported links between anthropogenic activities, environmental pressures, and ecosystem condition. A semi-quantitative Environmental Risk Score (ERS) was calculated for six major stressors. Hydrocarbon-related pollution emerged as the most severe threat (ERS = 25), followed by industrial and agricultural wastewater (ERS = 20), plastic and microplastic contamination (ERS = 16), biodiversity loss (ERS = 15), hydrological alteration (ERS = 12), and sea-level variability (ERS = 9). Reported microplastic abundances in southern coastal sediments ranged from 25 to 330 items per kilogram, although such values are site- and method-specific. Four management strategies-smart sensor networks, unmanned aerial vehicle (UAV)-based monitoring, biomonitoring, and nature-based filtration (constructed wetlands and coastal vegetation buffers) were comparatively evaluated. Smart sensor networks achieved the highest mean effectiveness score (4.25/5.00), followed by UAV-based monitoring (4.00), biomonitoring (3.75), and nature-based filtration (3.25). Sensitivity tests showed the leading rankings to be largely stable. A conceptual scenario comparison for 2025–2035 suggests that fragmented management may accelerate ecological deterioration, whereas an integrated, technology-supported framework could improve water quality, biodiversity, and coastal resilience. The findings advocate a transition from reactive, source-specific pollution control toward coordinated, evidence-based, ecosystem-scale management of the Caspian Sea.
Caspian Sea, anthropogenic pollution, Driving Forces-Pressures-State–Impacts-Responses framework, microplastics, ecological risk assessment, biomonitoring
The Caspian Sea is the largest enclosed body of water on Earth, covering approximately 371,000 km² and bordering five littoral states: Azerbaijan, Russia, Kazakhstan, Turkmenistan, and Iran. Beyond its considerable hydrocarbon and fisheries resources, the basin sustains a distinctive assemblage of endemic species and provides transport, industrial, and recreational value that underpins the socio-economic development of the surrounding region [1]. Because the sea has no natural outlet to the world ocean, pollutants that enter the basin cannot be flushed or diluted through oceanic exchange; instead, they tend to accumulate within the water column, sediments, and biota over extended periods, a property that magnifies the ecological consequences of even moderate anthropogenic loading.
Over the past several decades, expanding hydrocarbon extraction, industrial and agricultural intensification, coastal urbanization, and climate-driven hydrological change have combined to place sustained pressure on the Caspian ecosystem. Discharges of industrial and municipal effluent, petroleum hydrocarbons, heavy metals, and plastic debris have been linked to declining water quality, contracting habitat availability, and measurable reductions in the abundance of sensitive taxa, most notably sturgeon and the Caspian seal (Pusa caspica) [2]. Superimposed on these anthropogenic pressures, basin-wide climatic change is altering evaporation and precipitation patterns and contributing to long-term fluctuations in sea level, with consequent effects on coastal geomorphology, wetland habitat, and near-shore economic activity [3].
Addressing these interlinked problems requires more than isolated, single-source interventions. Because pollution pathways, hydrological processes, and species ranges cross national boundaries, effective protection of the Caspian Sea depends on coordinated environmental monitoring, harmonized legal and regulatory mechanisms, and joint management action among the five coastal states, as also noted in national institutional materials cited here as background only [4]. Existing Caspian assessments mostly address single stressors, sub-basins or sectors and rarely link a transparent stressor ranking to measurable indicators and management options; this study addresses that gap within one Driving Forces-Pressures-State-Impacts-Responses (DPSIR)-based framework. Against this background, the present study pursues three objectives: first, to synthesize and systematize the principal ecological problems affecting the Caspian Sea and their underlying anthropogenic and climatic drivers; second, to quantify the relative severity of these problems using a transparent, semi-quantitative risk-scoring approach; and third, to evaluate a set of technologically supported management strategies capable of mitigating the identified risks. The resulting analysis is intended to provide a scientifically grounded basis for prioritizing environmental management measures and for informing regional cooperation on the long-term ecological sustainability of the Caspian Sea.
This study adopts a structured literature-synthesis design combined with a semi-quantitative risk-assessment and scenario-comparison methodology. No new field sampling was undertaken; instead, findings from peer-reviewed studies, institutional monitoring reports, and regional environmental datasets published between 2010 and 2026 were compiled, cross-checked, and integrated to characterize ecological trends across the Caspian basin. This was not a formal systematic review; sources were selected purposively, and one earlier basin-wide pollution-load assessment was retained.
2.1 Data sources and analytical framework
Evidence was drawn from foundational and regional studies on marine litter and microplastic dynamics [5-8], global policy assessments of plastic debris [9], groundwater-related contamination on the Absheron Peninsula [10], and coastal geomorphological change assessed through remote sensing and Geographic Information System (GIS) [11], a non-peer-reviewed report used as background only. To organize these heterogeneous sources into a coherent descriptive structure, the DPSIR framework was applied. This framework links the socio-economic activities that generate environmental pressure (Driving Forces), the resulting physical and chemical loading on the ecosystem (Pressures), the observed condition of environmental quality (State), the ecological and socio-economic consequences of that condition (Impacts), and the policy or technical measures adopted in response (Responses). DPSIR is used here as a descriptive organizing structure; it does not by itself establish causality between drivers and observed ecological change.
2.2 Semi-quantitative ecological risk assessment
Because the reviewed sources reported ecological outcomes using non-comparable methodologies and units, a semi-quantitative ERS was constructed to allow relative comparison among stressor categories. Each of six principal environmental stressors identified through the literature synthesis-oil and gas pollution, industrial and agricultural wastewater, plastic and microplastic pollution, biodiversity loss, hydrological change, and sea-level variability-was rated independently on two five-point ordinal scales (1 = very low, 5 = very high): a severity score, reflecting the intensity of documented ecological impact, and an occurrence score, reflecting the frequency with which the stressor was reported across the reviewed literature. Occurrence thus measures evidence frequency, not true frequency in the sea, and may favor well-studied stressors. Rubric for severity: 1 = no measurable effect; 2 = localized, reversible; 3 = localized, persistent; 4 = sub-basin scale or sensitive taxa affected; 5 = basin-wide or population-level effects. Rubric for occurrence: 1 = isolated reports; 2 = one locality; 3 = one sub-basin; 4 = two of the three sub-basins; 5 = all three sub-basins and national or regional assessments. The ERS was then calculated as the product of these two ratings:
ERS = Severity × Occurrence
A higher ERS value indicates greater cumulative ecological significance and, correspondingly, higher priority for management intervention. This scoring approach does not yield an absolute measure of ecological damage; rather, it provides a transparent, reproducible method for ranking stressors relative to one another based on the weight of current evidence. The multiplicative form follows the likelihood × consequence logic of risk matrices; additive and geometric-mean aggregation gave the same order (one tie under the additive form). Robustness was tested by changing each score by ±1 in turn (20 admissible perturbations) and comparing rankings with Spearman’s ρ.
2.3 Comparative evaluation of management strategies
Four candidate environmental management strategies were identified from the reviewed literature as having demonstrated applicability to semi-enclosed coastal and marine systems: smart sensor networks (continuous water-quality monitoring), UAV-based monitoring (coastal and surface surveillance), biomonitoring (using aquatic indicator species), and nature-based filtration (constructed wetlands and coastal vegetation buffers); these four labels are used throughout. Each strategy was scored on four evaluation criteria-pollution detection capability, spatial monitoring coverage, response speed, and long-term ecosystem-recovery potential-using a five-point scale (1 = very low, 5 = very high) informed by the performance characteristics reported for each technology in the reviewed monitoring literature. A score of 5 denotes a continuous, operational capability in comparable systems, 3 a partial or periodic one and 1 none; no expert panel was used, so scores are indicative of author judgments. An overall effectiveness score was calculated as the arithmetic mean of the four criterion scores for each strategy. Because equal weighting is an assumption, stability was tested with ±1 score changes and 10,000 random weight sets.
2.4 Scenario comparison
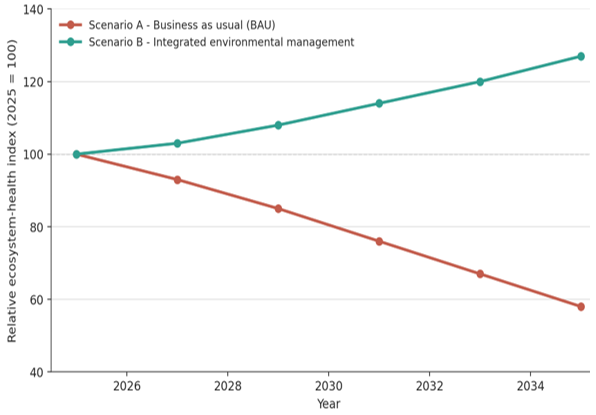
To illustrate the potential divergence in ecological trajectory associated with current versus improved management practice, two qualitative development scenarios were constructed for the period 2025–2035: a Business-as-Usual (BAU) scenario, in which existing fragmented and reactive management continues, and an Integrated Environmental Management scenario, in which the framework proposed in Section 2.3 is implemented. These scenarios were developed as a structured, evidence-informed comparison of plausible directions of ecological change rather than as a quantitative predictive model; the relative ecosystem-health trajectories are illustrative projections intended to visualize the qualitative direction and approximate magnitude of divergence between the two pathways, not statistically fitted forecasts. Decision rules: an index set to 100 in 2025 falls by 7–9 points per two-year step under BAU (pressures persist without new controls) and rises by 3–7 points per step under the integrated scenario (smaller early gains reflect deployment time); values are author-assigned and uncalibrated.
3.1 Anthropogenic drivers and the Driving Forces-Pressures-State-Impacts-Responses structure of ecological change
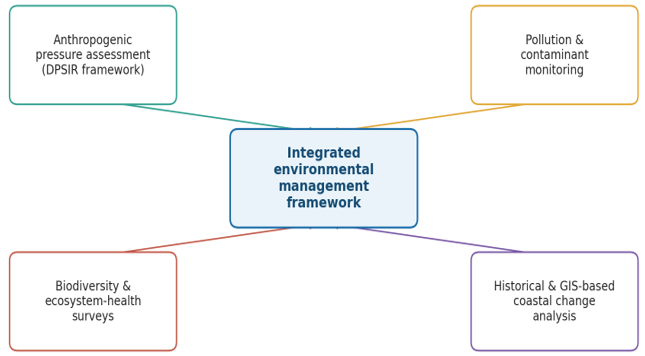
Table 1 summarizes the DPSIR structure derived from the literature synthesis. The analysis indicates that hydrocarbon extraction, industrial and agricultural expansion, urban wastewater generation, and transport activity constitute the principal driving forces behind ecological pressure in the Caspian basin. These driving forces are associated in the reviewed literature with direct pressures-oil and chemical discharge, nutrient and heavy-metal loading, and plastic waste input-that are linked to changes in the physicochemical and biological state of the ecosystem and to reported impacts on biodiversity, water quality, and coastal socio-economic activity. Figure 1 illustrates the essential directions of the study.
Figure 1. Main research directions integrated in this study
Table 1. Assessment of the ecological status of the Caspian Sea based on the Driving Forces-Pressures-State-Impacts-Responses (DPSIR) framework (compiled by the authors from DPSIR model)
|
DPSIR Component |
Description |
Illustrative Examples and Measurable Indicators in the Caspian Basin |
|
Driving Forces |
Socio-economic activities generating environmental pressure |
Oil and gas extraction; industrial production; agriculture; urbanization; shipping and transport; indicators: oil output, coastal population, irrigated area, shipping traffic |
|
Pressures |
Physical and chemical loads exerted on the ecosystem |
Petroleum hydrocarbon discharge; industrial and municipal wastewater; agrochemical runoff; plastic waste input; indicators: river-borne N, P, metal and hydrocarbon loads (t yr⁻¹), plastic input, rate of sea-level fall |
|
State |
Resulting condition of environmental quality |
Elevated heavy-metal and hydrocarbon concentrations; reduced dissolved oxygen; microplastic presence in sediment and biota; indicators: TPH, PAH and metal levels in sediment (mg kg⁻¹), dissolved oxygen (mg L⁻¹), microplastics (items kg⁻¹), shoreline position |
|
Impacts |
Ecological and socio-economic consequences |
Declining sturgeon and Caspian seal populations; reduced fisheries yield; degraded coastal habitat; indicators: seal and sturgeon abundance, benthic species richness, catch per unit effort, wetland area lost |
|
Responses |
Policy, technical, and management measures |
National monitoring programs; proposed smart sensor networks, unmanned aerial vehicle (UAV)-based monitoring, biomonitoring, and nature-based filtration; indicators: monitoring-station density, share of treated wastewater, marine protected area coverage |
3.2 Principal pollutant categories
The literature synthesis identified five principal categories of pollutants affecting the Caspian ecosystem, summarized in Table 2 together with their major sources and documented ecological effects. Reported concentrations are site- and method-specific and were not pooled across studies.
Table 2. Main pollutant categories identified in the Caspian Sea ecosystem
|
Pollutant Category |
Principal Sources |
Documented Ecological Effects |
|
Petroleum hydrocarbons |
Offshore platforms, pipelines, tanker transport, onshore refining |
Surface oil layers restrict gas exchange; chronic toxicity of aromatic hydrocarbons reduces fish populations [12] |
|
Heavy metals |
Industrial effluent, urban runoff, sediment resuspension |
Bioaccumulation in tissues; sediment contamination along southern and southeastern coasts [13, 14] |
|
Nutrients and agrochemicals |
Agricultural runoff, untreated municipal wastewater |
Eutrophication; disruption of nitrogen and phosphorus cycling [15] |
|
Plastics and microplastics |
Coastal urban centers, riverine transport, fishing activity |
Ingestion by plankton and fish; sediment abundance of 25–330 items kg⁻¹ in 17 surface samples from the southern (Iranian) coast, identified by density separation with Scanning Electron Microscopy coupled with Energy-Dispersive X-ray Spectroscopy (SEM-EDS) and Raman spectroscopy [16] |
|
Domestic and industrial wastewater |
128 registered watercourses discharging into the Azerbaijani sector alone |
Organic loading, pathogen input, and localized hypoxia near major outfalls [17] |
3.3 Riverine pollution loading
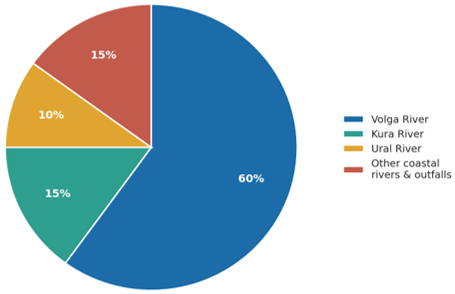
River discharge represents the dominant pathway by which pollutants enter the Caspian Sea. An earlier institutional (grey-literature) assessment by the Caspian Environment Programme estimated that rivers deliver 80–97% of the total input of each major pollutant except oil (about 60% of the oil load), and that the Volga alone carries more than 80–90% of river-borne pollutants [18]; these figures are cited as context and were not used to derive the ERS scores. Municipal and industrial wastewater generated in Armenia and Georgia enters the sea via the Kura River, while discharges from Baku, Sumgayit, Makhachkala, Astrakhan, Turkmenbashi, Rasht, and Anzali constitute the principal urban point sources along the coastline. Figure 2 gives an indicative, author-estimated apportionment of combined river-borne pollutant load, not a measured budget; its 60% Volga share is lower than the CEP estimate and is therefore conservative.
Figure 2. Indicative (author-estimated) share of total riverine pollution input to the Caspian Sea
3.4 Major environmental problems and their ecological impacts
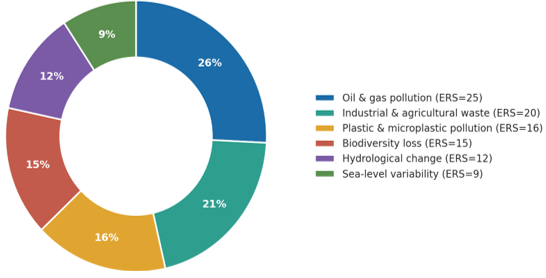
Six interrelated categories of environmental pressure were found to be jointly associated with ecological degradation in the Caspian Sea, and these constituted the categories scored in the ERS (Figure 3). Table 3 summarised these pressures at the ecosystem level. For the three pollution-related pressures, contaminant-specific sources and effects were reported separately in Table 2, so Table 3 was restricted to their aggregate, system-wide consequences. The remaining three pressures were biological or physical rather than chemical in nature and therefore fell outside the scope of Table 2.
Figure 3 shows that oil and gas pollution contributed the largest share of the total ERS (26%), followed by industrial and agricultural waste (21%).
Figure 3. Relative distribution of major environmental pressures in the Caspian Sea (share of total Environmental Risk Score (ERS))
Table 3. Ecosystem-level environmental pressures in the Caspian Sea, as scored in the Environmental Risk Score (ERS)
|
Pressure Type |
Environmental Pressure |
Ecosystem-Level Consequence |
|
Pollution (contaminant detail in Table 2) |
Oil and gas industry pollution |
Degradation of the coastal soil–water balance |
|
Industrial and agricultural waste |
Food-web accumulation of heavy metals, phenols, and pesticides, disrupting the ecological balance between the northern and southern basins |
|
|
Plastic and microplastic pollution |
Transfer of particles up the food chain, with cumulative biological effects [19] |
|
|
Biological |
Biodiversity loss and ecosystem degradation |
Declining populations of endemic species (e.g., Caspian seal) driven by overfishing, habitat degradation, and pollution |
|
Physical and hydrological |
Sea-level change and coastal deformation |
The observed decline, accelerating since the late 2010s, is drying wetlands and shallows, driving shoreline retreat and contracting seal and sturgeon habitat. A further 5–10 m fall could reduce existing marine protected area coverage by up to 94% [20] |
|
Climate change and hydrological imbalance |
Rising temperatures increase evaporation and alter salinity and precipitation patterns, destabilising coastal habitats |
3.5 Semi-quantitative ecological risk assessment
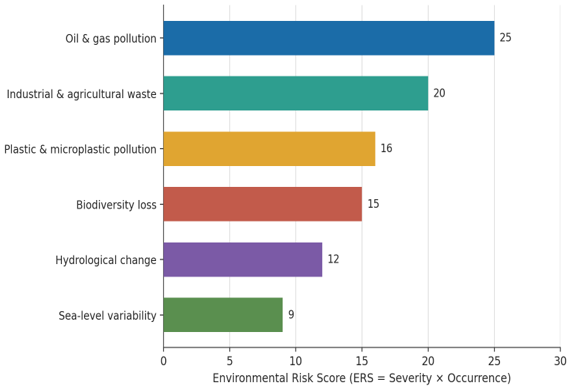
Table 4 and Figure 4 present the results of the semi-quantitative ERS assessment. Oil and gas pollution received the highest score (ERS = 25), reflecting both its high documented severity and its frequent identification across the reviewed literature as the dominant, long-standing source of contamination in the basin [21]. Industrial and agricultural wastewater ranked second (ERS = 20), consistent with continuous nutrient, pesticide, and heavy-metal transport via the Volga, Kura, and Ural river systems.
Table 4. Semi-quantitative ecological risk assessment of key environmental stressors
|
Environmental Stressor |
Severity (1–5) |
Occurrence (1–5) |
ERS (Severity × Occurrence) |
|
Oil and gas pollution |
5 |
5 |
25 |
|
Industrial and agricultural wastewater |
5 |
4 |
20 |
|
Plastic and microplastic pollution |
4 |
4 |
16 |
|
Biodiversity loss |
5 |
3 |
15 |
|
Hydrological change |
4 |
3 |
12 |
|
Sea-level variability |
3 |
3 |
9 |
Figure 4. Ecological risk scores of major stressors in the Caspian Sea
Plastic and microplastic pollution (ERS = 16) and biodiversity loss (ERS = 15) followed closely, reflecting the emerging but rapidly intensifying nature of plastic contamination and the compounding effects of habitat fragmentation and overfishing on endemic species [2, 20]; a recent non-peer-reviewed synthesis [22] reports similar patterns and is cited as context only. Hydrological change (ERS = 12) and sea-level variability (ERS = 9) received comparatively lower scores, although both are reported in the reviewed literature to interact with, and potentially amplify, the effects of anthropogenic pollution over time. The low sea-level score reflects effects documented in the reviewed literature, much of which predates evidence of accelerated decline; with severity 5, its ERS would be 15, so the score is likely conservative. In the sensitivity test, oil and gas pollution remained highest or joint-highest in all 20 perturbations; the two leading stressors held their positions in 19 of 20, and Spearman’s ρ never fell below 0.90.
3.6 Comparative evaluation of proposed management strategies
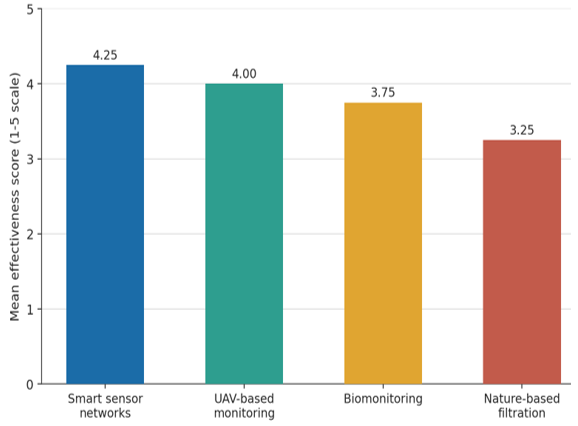
Table 5 and Figure 5 summarize the comparative evaluation of the four proposed management strategies. Smart sensor networks achieved the highest overall effectiveness score (4.25/5.00), driven by their capacity for continuous, real-time measurement of dissolved oxygen, pH, and chemical parameters, which supports early detection of pollution events [23].
Table 5. Comparative evaluation of proposed environmental management strategies (1–5 scale)
|
Management Strategy |
Pollution Detection |
Monitoring Coverage |
Response Speed |
Long-Term Recovery Potential |
Overall Effectiveness Score |
|
Smart sensor networks |
4 |
4 |
5 |
4 |
4.25 |
|
UAV-based monitoring |
4 |
5 |
4 |
3 |
4.00 |
|
Biomonitoring |
3 |
4 |
3 |
5 |
3.75 |
|
Nature-based filtration |
2 |
3 |
3 |
5 |
3.25 |
Figure 5. Overall effectiveness score of proposed environmental management strategies
UAV-based monitoring ranked second (4.00/5.00), offering high spatial accuracy for detecting oil spills, plastic accumulation, and coastal erosion over large areas [24]. Biomonitoring using aquatic indicator species scored 3.75/5.00, providing reliable evidence of long-term, cumulative ecological impact even though it does not yield immediate pollution alerts. Nature-based filtration scored lowest among the four strategies (3.25/5.00) but had the highest long-term recovery potential; the low overall effectiveness score reflects weak detection and coverage under equal weighting. Under ±1 score changes, no reversal occurred (7 of 28 changes produced a tie for first). Across 10,000 random weight sets, smart sensors ranked first in 61% of cases and nature-based filtration last in 83%; doubling the recovery weight placed biomonitoring above UAV monitoring.
3.7 Scenario comparison, 2025-2035
Table 6 and Figure 6 compare the two development scenarios described in Section 2.4. Under the BAU scenario, continued fragmented management is expected to be associated with further declines in water quality, endemic biodiversity, and coastal stability as pollution loading and climate-driven hydrological change continue largely unchecked. Under the Integrated Environmental Management scenario, combined implementation of smart sensor networks, UAV-based monitoring, biomonitoring, and nature-based filtration is assumed to shift the same indicators toward improvement over the 2025–2035 period.
Table 6. Comparative analysis of Caspian ecosystem scenarios, 2025–2035
|
Indicator |
Scenario A: Business-as-Usual |
Scenario B: Integrated Environmental Management |
|
Water quality trend |
Continued deterioration |
Progressive improvement |
|
Biodiversity status |
Further decline in endemic species |
Stabilization and gradual recovery |
|
Pollution load |
Sustained or increasing |
Reduction |
|
Ecosystem resilience |
Weakening |
Strengthening |
|
Coastal stability |
Increasing erosion and flood risk |
Improved management of coastal change |
Figure 6. Conceptual comparison of ecosystem-health trajectories under two management scenarios, 2025–2035 (author-assigned, uncalibrated index values)
The findings of this synthesis reinforce the view that ecological degradation in the Caspian Sea is not attributable to a single pollution source; the reviewed evidence associates it with the cumulative and interacting effects of hydrocarbon extraction, industrial and agricultural discharge, plastic contamination, biodiversity loss, and climate-driven hydrological change. The closed nature of the basin substantially limits natural dilution and flushing of pollutants, so that contaminants entering the system through any one of these pathways tend to persist and accumulate rather than dissipate, a dynamic that helps explain why relatively moderate discharge volumes can produce disproportionately large and long-lasting ecological effects [25].
The ecological risk assessment indicates a clear management hierarchy, with oil and gas pollution and industrial-agricultural wastewater together accounting for the largest share of cumulative risk. This result is consistent with prior assessments identifying offshore drilling, pipeline operations, and river-borne nutrient and heavy-metal transport as the longest-standing and most severe pressures on the basin. It is also broadly consistent with earlier institutional river-load estimates (Section 3.3), which were not used in scoring. Because hydrological change and sea-level decline are documented mostly as drivers or projections, their lower scores partly reflect the distribution of research effort. At the same time, the comparatively high risk score attributed to plastic and microplastic pollution, despite its shorter documented history relative to oil contamination, signals an emerging threat whose persistence and capacity for bioaccumulation warrant closer monitoring attention in future assessments [26].
The comparative evaluation of management strategies suggests that no single technology is sufficient to address the Caspian Sea's environmental problems in isolation. Smart sensor networks and UAV-based monitoring offer strong detection and coverage capability but do not, by themselves, restore ecological function; biomonitoring and nature-based filtration provide longer-term ecological insight and habitat restoration but respond more slowly to acute pollution events. These findings support an integrated framework in which real-time technological monitoring is combined with ecosystem-based restoration measures, allowing early warning capability to be paired with the ecological recovery function that restoration provides.
The scenario comparison further indicates that the trajectory of ecological change in the Caspian Sea over the next decade will depend substantially on whether current, largely reactive management practices continue or are replaced by a coordinated, technologically supported framework. While these scenarios are illustrative rather than predictive, they are consistent with the broader literature suggesting that delayed or fragmented intervention in closed marine systems tends to produce compounding, and increasingly difficult to reverse, ecological decline. This underscores the importance of timely investment in monitoring infrastructure and of strengthening the regional cooperation mechanisms among the five Caspian littoral states that such investment requires.
This study has several limitations that should be considered when interpreting its findings. The analysis relies primarily on secondary data drawn from published literature and institutional monitoring reports rather than on original field sampling, which constrains the spatial and temporal resolution of the underlying evidence base. The severity and occurrence ratings used in the ERS, and the criterion scores used in the strategy comparison, are semi-quantitative expert judgments informed by the reviewed literature rather than measurements derived from a single standardized protocol, and should therefore be interpreted as indicative rankings rather than precise, statistically validated estimates. Similarly, the 2025-2035 scenario projections are qualitative, evidence-informed illustrations of plausible directions of ecological change rather than outputs of a calibrated predictive model. Future research incorporating long-term in-situ monitoring, remote-sensing time series, and hydrodynamic or machine-learning-based modeling would help to refine and validate the risk rankings and management priorities proposed here. Sources were selected purposively rather than by systematic search, and monitoring standards and sampling frequencies differ among the littoral states, limiting comparability. A few non-peer-reviewed and web-based sources [4, 11, 18, 22] were retained for background context only; no ERS score, strategy score, or ranking relies exclusively on them. Sensitivity tests show that the leading priorities are robust, whereas lower ranks are not.
This study has synthesized current evidence on the ecological condition of the Caspian Sea and applied a structured, semi-quantitative framework to assess the relative severity of the principal environmental stressors affecting the basin. The synthesis indicates that oil and gas pollution, industrial and agricultural wastewater, plastic and microplastic contamination, biodiversity loss, and climate-driven hydrological change are reported to act cumulatively, rather than independently, in eroding the ecological stability of the Caspian ecosystem, with oil and gas pollution identified as the single highest-priority stressor, a result that remained stable in the sensitivity analysis.
The comparative evaluation of management strategies indicates that combining real-time technological monitoring-smart sensor networks and UAV-based monitoring-with ecologically grounded interventions such as biomonitoring and nature-based filtration provides a reasonable basis for prioritizing environmental management; identifying an optimal pathway would require cost-effectiveness analysis, formal multi-criteria decision analysis and field validation. The 2025–2035 scenario comparison reinforces this conclusion, suggesting that continuation of current, fragmented management practices risks accelerating ecological decline, whereas coordinated implementation of an integrated management framework could improve water quality, biodiversity outlook, and coastal resilience over the coming decade.
The principal scientific contribution of this study lies in the integration of the DPSIR framework with a transparent risk-scoring method, a comparative strategy evaluation, and a forward-looking scenario analysis into a single, unified assessment of the Caspian Sea ecosystem. This integrated approach offers a practical, evidence-based foundation for prioritizing environmental management measures and for supporting the regional cooperation among the Caspian littoral states that will ultimately determine the long-term ecological future of the sea.
[1] Aliyev, E.M., Kerimov, V.Y., Lobanov, Y.A. (2024). Environmental impact assessment in the Caspian region [in Russian]. Proceedings of Higher Educational Establishments. Geology and Exploration, 66(2): 124-140. https://doi.org/10.32454/0016-7762-2024-66-2-124-140
[2] Lattuada, M., Albrecht, C., Wilke, T. (2019). Differential impact of anthropogenic pressures on Caspian Sea ecoregions. Marine Pollution Bulletin, 142: 274-281. https://doi.org/10.1016/j.marpolbul.2019.03.046
[3] Hasani, M., Sakieh, Y., Dezhkam, S., Ardakani, T., Salmanmahiny, A. (2017). Environmental monitoring and assessment of landscape dynamics in the southern coast of the Caspian Sea through intensity analysis and imprecise land-use data. Environmental Monitoring and Assessment, 189: 163. https://doi.org/10.1007/s10661-017-5883-9
[4] Ministry of Ecology and Natural Resources of the Republic of Azerbaijan. (2026). Ecological problems and pollution sources of the Caspian Sea. https://www.eco.gov.az/az/fealiyyet-istiqametleri/xezer-denizi/ekoloji-problemleri-ve-cirklenme-menbeleri.
[5] Bergmann, M., Gutow, L., Klages, M. (2015). Marine Anthropogenic Litter. Springer, pp. 1-447. https://doi.org/10.1007/978-3-319-16510-3
[6] Galloway, T.S., Cole, M., Lewis, C. (2017). Interactions of microplastic debris throughout the marine ecosystem. Nature Ecology & Evolution, 1: 0116. https://doi.org/10.1038/s41559-017-0116
[7] Gall, S.C., Thompson, R.C. (2015). The impact of debris on marine life. Marine Pollution Bulletin, 92(1-2): 170-179. https://doi.org/10.1016/j.marpolbul.2014.12.041
[8] Iniguez, M.E., Conesa, J.A., Fullana, A. (2016). Marine debris occurrence and treatment: A review. Renewable and Sustainable Energy Reviews, 64: 394-402. https://doi.org/10.1016/j.rser.2016.06.031
[9] UNEP. (2016). Marine plastic debris and microplastics–Global lessons and research to inspire action and guide policy change. United Nations Environment Programme, Nairobi. https://wedocs.unep.org/20.500.11822/7720.
[10] Ismailov, N.M., Alieva, S.R. (2019). Potential role of groundwater in pollution of coastal water of the Caspian Sea by organic pollutants. Arid Ecosystems, 9(3): 202-208. https://doi.org/10.1134/S2079096119030053
[11] Sadigov, R., Jafarova, S. (2020). Historical analysis of the Caspian Sea and ecological assessment of its current state using remote sensing (in Azerbaijani). https://www.researchgate.net/publication/364081687.
[12] Khuduzade, A.I., Gasimova, E.E. (2019). Ecological condition of the areas contaminated with oil and oil products on the Absheron Peninsula. European Journal of Natural History, 2: 12-16. https://world-science.ru/en/article/view?id=33959.
[13] Bastami, K.D., Bagheri, H., Kheirabadi, V., et al. (2014). Distribution and ecological risk assessment of heavy metals in surface sediments along southeast coast of the Caspian Sea. Marine Pollution Bulletin, 81(1): 262-267. https://doi.org/10.1016/j.marpolbul.2014.01.029
[14] Bastami, K.D., Neyestani, M.R., Shemirani, F., Soltani, F., Haghparast, S., Akbari, A. (2015). Assessment of heavy metal contamination in relation to sediment characteristics in surface sediments of the southern Caspian Sea. Marine Pollution Bulletin, 92: 237-243. https://doi.org/10.1016/j.marpolbul.2014.12.035
[15] Costantini, M.L., Agah, H., Fiorentino, F., et al. (2021). Nitrogen and metal pollution in the southern Caspian Sea: A multiple approach to bioassessment. Environmental Science and Pollution Research, 28: 9898-9912. https://doi.org/10.1007/s11356-020-11243-8
[16] Mehdinia, A., Dehbandi, R., Hamzehpour, A., Rahnama, R. (2020). Identification of microplastics in the sediments of southern coasts of the Caspian Sea, north of Iran. Environmental Pollution, 258: 113738. https://doi.org/10.1016/j.envpol.2019.113738
[17] Ismaylov, N.M., Najafova, S.I., Gasimova, A. (2015). Absheron industrial region: Environmental stress factors. Arid Ecosystems, 5(3): 194-200. https://doi.org/10.1134/S2079096115030075
[18] Caspian Environment Programme. (2003). Rivers: Pollution loads to the Caspian Sea. Caspian Regional Thematic Centre for Pollution Control, Baku. https://archive.iwlearn.net/caspianenvironment.org/pollution/rivers.htm.
[19] Zettler, E.R., Mincer, T.J., Amaral-Zettler, L.A. (2013). Life in the "plastisphere": Microbial communities on plastic marine debris. Environmental Science & Technology, 47(13): 7137-7146. https://doi.org/10.1021/es401288x
[20] Court, R., Lattuada, M., Shumeyko, N., et al. (2025). Rapid decline of Caspian Sea level threatens ecosystem integrity, biodiversity protection, and human infrastructure. Communications Earth & Environment, 6: 261. https://doi.org/10.1038/s43247-025-02212-5
[21] Nemirovskaya, I.A. (2016). Hydrocarbons in the modern sediments of the Caspian Sea. Water Resources, 43(1): 111-120. https://doi.org/10.1134/S009780781506007X
[22] Karimi Baghmaleki, M. (2026). Biodiversity dynamics and ecological stressors in the Caspian Sea: Integrating pollution, climate change and microbial interactions. Zenodo (CERN European Organization for Nuclear Research). https://doi.org/10.5281/zenodo.18134169
[23] Adu-Manu, K.S., Tapparello, C., Heinzelman, W., Katsriku, F.A., Abdulai, J.D. (2017). Water quality monitoring using wireless sensor networks: Current trends and future research directions. ACM Transactions on Sensor Networks, 13(1): 4. https://doi.org/10.1145/3005719
[24] Yang, Z.Y., Yu, X.Y., Dedman, S., et al. (2022). UAV remote sensing applications in marine monitoring: Knowledge visualization and review. Science of the Total Environment, 838: 155939. https://doi.org/10.1016/j.scitotenv.2022.155939
[25] Lahijani, H.A.K., Ghaffari, P., Leroy, S.A.G., et al. (2024). A note on the silent decline of the Caspian environment. Marine Pollution Bulletin, 205: 116551. https://doi.org/10.1016/j.marpolbul.2024.116551
[26] Yang, H.R., Chen, G.L., Wang, J. (2021). Microplastics in the marine environment: Sources, impacts, consequences and microbial degradation. Toxics, 9(2): 41. https://doi.org/10.3390/toxics9020041