Arif Parabi* | Siti Noor Linda Taib | Raudhah Ahmadi | Alsidqi Hasan | Ashraf Dhowian Parabi | Nazeri Abdul Rahman | Astisza Syahla Ludmilla Parabi
© 2026 The authors. This article is published by IIETA and is licensed under the CC BY 4.0 license (http://creativecommons.org/licenses/by/4.0/).
OPEN ACCESS
This study quantifies subsurface carbon stocks and microstructural characteristics of tropical peat beneath the urban districts of North and Southeast Pontianak, West Kalimantan, Indonesia. Urban encroachment in this context denotes residential housing expansion into the peatland margin, identified from land-use records as the dominant land-use disturbance driver in both districts. A grid-based coring program (23 points in North Pontianak, 14 in Southeast Pontianak) measured peat depth, Von Post humification class, bulk density, and organic matter content following ASTM standards. Peat thickness ranged from 1.25–3.25 m in Southeast Pontianak and 2.00–4.30 m in North Pontianak, with hemic peat (H4–H5) covering 98.5% of the 23.12 km² extent. Carbon stocks, calculated by depth and maturity class using GIS-based Thiessen (Voronoi) zonation, totalled 3.34 Mt C (0.85 Mt C in Southeast Pontianak, 2.49 Mt C in North Pontianak), with mean carbon densities of approximately 1,468 and 1,438 t C·ha⁻¹, respectively, placing both districts in the high-to-extremely-high range on Indonesian peat benchmarks. Hemic peat stored over 96% of district-level carbon in Southeast Pontianak and over 99% in North Pontianak. Scanning Electron Microscopy coupled with Energy-Dispersive X-Ray Spectroscopy (SEM-EDX) analysis of a single representative North Pontianak specimen revealed a dual-porosity fibrous network and carbon-dominated composition (64.75 mass% C, 33.66 mass% O), confirming genuine, low-mineral-content peat rather than validating the district-scale bulk carbon stock estimates. Carbon stock estimates depend on bulk density, loss on ignition (LOI)-derived organic carbon fractions, and peat depth measurements; however, district-level uncertainty bounds have not been quantified. Pontianak’s urban peatlands hold large, hydrologically sensitive carbon stocks that establish a baseline relevant to groundwater and land-use monitoring, though quantifying the CO₂ emissions this development risks releasing would require additional data on drainage depth, oxidation rate, and land-use change trajectory not measured here.
bulk density, loss on ignition, peat humification, Pontianak, soil carbon stock, tropical peatland, urban land use, Von Post scale
Tropical peatlands store an estimated 88.6 Pg of carbon (range 81.7–91.9 Pg), of which approximately 68.5 Pg (77%) is concentrated in Southeast Asia—a disproportionate share relative to their areal extent [1-3]. Intact peatlands function as persistent net carbon sinks [4, 5] but once drained or burned rapidly become major greenhouse gas sources [6], with current CO₂ emissions from drained Southeast Asian peatlands reaching approximately 355 Mt CO₂·yr⁻¹ [7, 8]. Indonesia holds approximately 21 million hectares—roughly 80% of the Southeast Asian total—with estimated carbon stocks of 13.6–40.5 Gt C across Sumatra, Kalimantan, and Papua [9-11]; accurate sub-national peat carbon inventories from sites undergoing active urban development remain scarce, despite their importance for understanding carbon dynamics under land-use pressure [12]. Borneo (Kalimantan) hosts some of the world’s most carbon-rich peat swamp forests [13]; in West Kalimantan, Pontianak City—directly underlain by tropical peat of variable depth—faces continuous residential housing expansion that disturbs peat stratigraphy, alters drainage, and accelerates oxidative carbon loss [14, 15], yet district-level carbon stock data remain sparse. Throughout this paper, “urban encroachment” denotes the expansion of residential housing into the peatland margin—identified from land-use records as the dominant disturbance driver in both study districts—rather than industrial, agricultural, or drainage-canal development. “Carbon reserves,” as used in the title, likewise denotes in-situ subsurface carbon stocks derived from volumetric calculation of peat depth and carbon density, rather than economically extractable reserves in the resource-economics sense.
Carbon stock quantification in tropical peat relies on three primary parameters: bulk density, organic carbon concentration via loss on ignition (LOI) with the Van Bemmelen conversion factor, and deposit thickness [16-20]. In urban peat environments where drainage-induced compaction causes bulk density to deviate from pristine references, a specimen-level check of material identity against direct elemental measurements is a useful complement [21, 22]. Scanning Electron Microscopy coupled with Energy-Dispersive X-Ray Spectroscopy (SEM-EDX) addresses this by revealing fibrous peat’s dual-porosity architecture—macropores between fibre elements and micropores within the fibre matrix—and providing quantitative elemental composition that confirms genuine, low-mineral-content peat for a representative specimen, without itself validating LOI-derived organic fractions at district scale [23-26]. Translating point-based field measurements of peat depth, groundwater level, and carbon density into continuous district-scale surfaces requires a spatial interpolation method suited to the sampling density and objectives of the study. Prior studies in Indonesian peatlands have applied fitted geostatistical interpolators—ordinary kriging outperforming inverse-distance weighting (IDW) and machine-learning alternatives for peat thickness and carbon-stock mapping in one case [27]—while a second study mapped peat thickness and groundwater level directly along geophysical survey transects, without an intervening spatial interpolation step [28], and a third applied kriging-based peat-thickness modelling [29]. This study instead adopts a Thiessen (Voronoi) proximity-polygon zonation for all three mapped layers (peat depth, groundwater level, and carbon density), detailed with its supporting citation in Section 2.4: each sample point defines a discrete zone of influence extending to the midpoint between it and its nearest neighbours, with the point’s measured value applied uniformly across that zone. This approach was selected over geostatistical alternatives such as kriging or IDW because it is a deterministic method that requires no parameters to be fitted or tuned to the data—unlike kriging’s variogram model or IDW’s power exponent and search radius. Any analyst working from the same point dataset will reproduce an identical Thiessen zone map, with no model-selection step introducing additional, unreported uncertainty.
Despite substantial literature on Indonesian peat carbon stocks at regional and provincial scales, to the best of our knowledge, a critical research gap persists: integrated, district-level assessments that combine SEM-EDX microstructural characterisation with field-calibrated, GIS-based spatial carbon mapping for rapidly urbanising coastal peat environments. Existing studies have predominantly focused on natural peat swamp forests and agricultural conversion areas in Riau Province, Central Kalimantan, and Papua, with insufficient attention to urban peat settings, where ongoing land development continually modifies carbon stock dynamics [30]. The North Pontianak (Pontianak Utara) and Southeast Pontianak (Pontianak Tenggara) districts represent an underrepresented yet scientifically significant study domain at the active frontier of urban expansion over the tropical peatlands of Borneo. This study is distinct from the authors’ related recent work on the same delta: Parabi et al. [14] addressed clean-water infrastructure design under peat-soil constraints, whereas Parabi et al. [15] delineated peatland extent and land-use change through geospatial demarcation. Neither prior study quantified below-ground carbon stocks, performed SEM-EDX microstructural characterisation, or produced carbon-density maps, which constitute the dataset and analytical contribution reported here. To address this gap, the present study pursues three objectives: (1) to quantify below-ground carbon stocks (MgC·ha⁻¹) in both districts through field-based peat core sampling and laboratory carbon analysis; (2) to characterise the microstructure and elemental composition of peat specimens using SEM-EDX analysis; and (3) to generate GIS-based spatial carbon stock distribution maps as a decision-support tool for urban spatial planning. To the best of our knowledge, the study thereby delivers the first district-level, multi-analytical carbon stock baseline for urban peatlands in Pontianak City, provides SEM-EDX-based confirmation of material identity at the micro-scale for a representative specimen, and produces GIS carbon density maps directly applicable to urban spatial planning in Kalimantan Barat Province.
2.1 Study area and sampling methodology
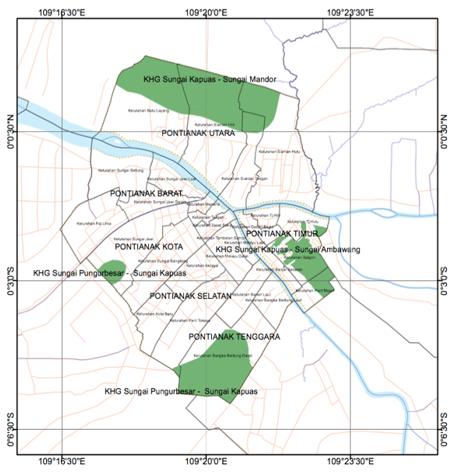
The study covered two districts of Pontianak City, West Kalimantan, Indonesia—North Pontianak (Kecamatan Pontianak Utara) and Southeast Pontianak (Kecamatan Pontianak Tenggara)—located at 0°02′24″ N, 109°20′22″ E astride the equator at the Kapuas–Landak River confluence, underlain by Holocene tropical peat of variable thickness. North Pontianak features active urban expansion over intact to semi-degraded peatlands, while Southeast Pontianak shows transitional development over disturbed residual peat swamps. Sampling points were georeferenced by GNSS and mapped onto a Badan Informasi Geospasial (BIG) base map for GIS integration. The location and spatial extent of the two study districts are shown in Figure 1.
Figure 1. Peatland distribution map of North and Southeast Pontianak Districts, West Kalimantan
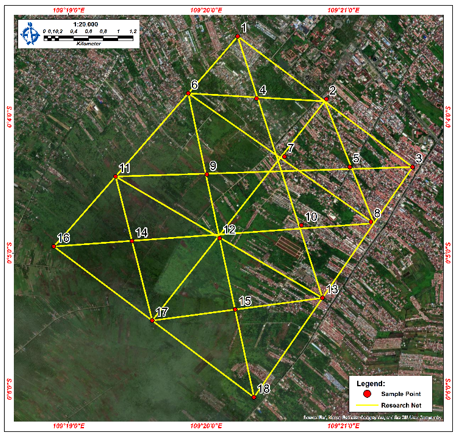
Figure 2. Soil sampling point coordinates–North Pontianak District
Figure 3. Soil sampling point coordinates–Southeast Pontianak District
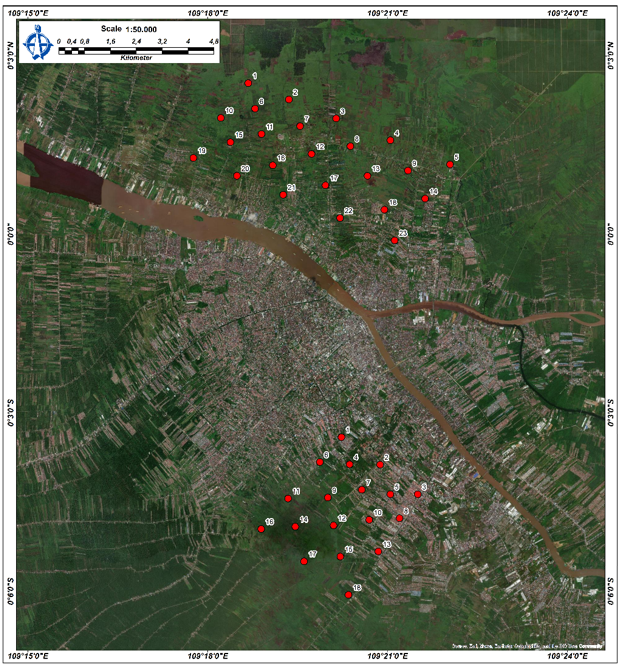
Sampling used a systematic grid based on the Ministry of Agriculture’s peatland map [31] (1:250,000, refined to 1:50,000), with points georeferenced via Google Earth. Grid points were laid out at a nominal 250 m spacing across each district’s confirmed peatland extent, with in-field relocation to the nearest accessible ground where a plotted point coincided with a building, paved surface, or other built structure, so that no station was sited inside a built-up area. Peat depth was profiled to the organic–mineral boundary using a Hand Auger (Handbor, 10.00 m capacity); disturbed samples were taken per maturity layer for Von Post and ASTM D4427 classification, while undisturbed samples were extracted in sealed PVC pipes (0.50–1.00 m depth) to preserve in situ properties. In total, 23 points were sampled in North Pontianak District and 14 in Southeast Pontianak District—a density proportional to each district’s confirmed peatland area (1,732.16 ha versus 579.80 ha; Section 3.1) rather than a fixed target per district—with WGS 1984 coordinates imported into the GIS environment for spatial interpolation and carbon stock mapping. The coordinates of the sampling points in North Pontianak and Southeast Pontianak Districts are presented in Figures 2 and 3, respectively.
2.2 Physical properties and organic content testing
Laboratory testing was performed in triplicate per sampling point and depth interval, following ASTM standards for highly organic soils, to obtain peat classification parameters (ASTM D4427) and quantitative index values for carbon stock estimation. Natural moisture content was determined per ASTM D2216; specific gravity (Gs) by pycnometer (ASTM D854); unit weight, dry unit weight, and void ratio analytically from undisturbed core specimens. Organic matter content was determined by LOI per ASTM D2974 (combustion at 440 ℃, 4 hours). Peat classification followed ASTM D4427 (organic content ≥ 75%, ash < 25% dry weight); fibre content (ASTM D1997) and Von Post humification degree (H1–H10 squeeze test) were assessed for maturity classification; soil pH was measured per ASTM D4972. Total organic carbon (%C) was derived from LOI using the Van Bemmelen conversion (reflecting the stoichiometric C-to-OM ratio in tropical peat with minimal mineral contamination) [32]:
$\% C_{\text {organic}}=\frac{\% \mathrm{OM}}{1.724}$ (1)
where, %OM is the organic matter content (%) determined by LOI and 1.724 is the Van Bemmelen conversion factor. Bulk density (ρ)—the primary parameter driving carbon stock calculations—was determined gravimetrically from ring samples (diameter 8 cm, height 10.8 cm). Each sample was weighed in the field immediately upon extraction, before transport, to record the in-situ wet mass and ring volume prior to any shrinkage or moisture loss; it was then oven-dried at 70 ℃ to constant mass, and dry density was computed as dry mass/ring volume (g·cm⁻³). Expected values increase with decomposition maturity: fibric 0.11–0.12, hemic 0.14–0.16, and sapric 0.18–0.21 g·cm⁻³. Geotechnical results from North Pontianak [15] confirmed ASTM D4427 peat classification at study sites, providing the basis for the district-level organic-content screening reported in Table 1.
2.3 Scanning Electron Microscopy coupled with Energy-Dispersive X-Ray Spectroscopy analytical instrumentation
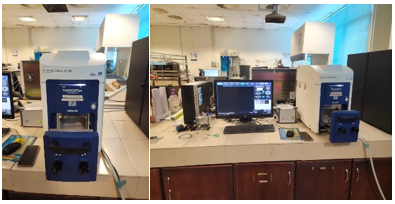
SEM-EDX analyses were conducted using a Hitachi TM4000 Tabletop SEM (0–30 kV) (Figure 4). Specimens were oven-dried and gold-palladium sputter-coated prior to analysis. Imaging was performed at 500× and 1000× to characterise pore structure and fibre morphology; elemental composition (mass% and atom%) was recorded simultaneously via the integrated EDX detector. A single, deliberately selected representative specimen from North Pontianak was analysed under these instrument parameters (n = 1, one EDX spectrum). This specimen was chosen precisely because the cored peat material was visually homogeneous in colour, fibre texture, and degree of decomposition across sampling points, making it a reliable indicator of material identity for the sampled peat body; consistent with this scope, the result is reported as confirmatory evidence of genuine, low-mineral-content peat rather than as a statistical basis for district-scale inference. Southeast Pontianak specimens were not characterised by SEM-EDX in this study.
Figure 4. Scanning Electron Microscopy (SEM) instrument
2.4 Carbon stock calculation and spatial mapping procedure
Below-ground carbon stocks were calculated following Wahyunto et al. [33] as applied in Septian et al. [32], stratified by peat maturity class (fibric, hemic, sapric) to capture systematic variation in bulk density and organic carbon concentration with progressive humification. The fundamental formula applied at each homogeneous peat layer is:
$C_{\text {stock}}=A \times \rho_b \times \% C_{\text {organic}} \times D$ (2)
where, A is land area (m²), ρb is bulk density (t·m⁻³), %Corganic is organic carbon fraction (decimal), and D is peat layer depth (m) summed to the mineral boundary for total borehole carbon stock. Carbon stock and carbon density values reported in Section 3 are calculated to full arithmetic precision from Eq. (2) so that district totals and the depth-versus-maturity reconciliation check (Section 3.6) remain independently verifiable; this precision reflects calculation exactness given the input values, not measurement precision. Narrative summary figures elsewhere in this manuscript are rounded conservatively, consistent with the order of measurement uncertainty implied by the propagation framework defined in the Limitations (Section 3.8), rather than by a calculated district-level uncertainty bound.
In the final step, validated point-based carbon stocks were exported to GIS for district-scale aggregation. Rather than an interpolated continuous surface, each sample point was assigned a Thiessen (Voronoi) proximity polygon [34]—a zone of influence extending to the midpoint between it and its nearest neighbouring points—for peat depth, maturity class, and carbon density alike; no kriging, IDW, or other distance-weighted interpolation algorithm was applied at any stage—for either peat depth or carbon density—and consequently no variogram model, cross-validation statistic, or data transformation (e.g., log or normal-score, sometimes used to address skewness in geostatistical interpolation) was required, since each zone’s value is assigned directly from its representative point measurement rather than estimated. Because each Thiessen zone already carries a single representative point value, it is homogeneous by construction, so the earlier Homogeneous Land Unit (HLU) overlay step is unnecessary and has been removed. Each of the 37 sampling points (23 in North Pontianak, 14 in Southeast Pontianak; Section 2.1) therefore defines exactly one Thiessen zone, giving 37 zones in total — one homogeneous unit per point, with no separate delineation rule, class-combination criterion, or minimum mapping unit to specify, since homogeneity follows directly from single-point zone construction rather than from overlaying independently classified layers. Zone extent is accordingly set by the point pattern itself (each zone’s boundary is the perpendicular bisector to its nearest neighbouring points) and is bounded below by the nominal 250 m sampling grid spacing used in the field design (Section 2.1), with locally smaller zones only where in-field relocation (also Section 2.1) placed two points closer together to avoid a built structure. Peat depth, Von Post maturity class, bulk density, and LOI-derived organic carbon content are measured directly at each sample point and assigned to its Thiessen zone with no interpolation. For district-level reporting, the 37 zones are further stratified by depth class (Section 3.5) and, independently, by Von Post maturity class (Section 3.6); within each stratum, the area-weighted mean bulk density, organic carbon fraction, and depth of its constituent zones are applied to that stratum’s total Thiessen-derived area via Eq. (2), and district carbon stock is the sum of these stratum-level totals, with final results expressed in both t C and t·ha⁻¹. Because the two classification schemes group the same 37 zones into different strata, their district totals are expected to diverge by a bounded amount even though every zone’s underlying point measurement and the total classified area are identical between the two schemes; this divergence is reported and interpreted as an internal cross-check in Section 3.6, rather than as evidence of interpolation, smoothing, or an overlay step, none of which is used at any stage. The corresponding measurement-level uncertainty and its propagation into the reported carbon stock totals are addressed in the Limitations (Section 3.8). Groundwater level was mapped from a network of eight manual piezometric stations (1.00 m deep, 5-inch PVC boreholes within the peat body, rather than a canal), monitored continuously from 1 January to 31 December 2024 with dry-season (February 2024) and rainy-season (November 2024) reference readings, following Permen LHK No. P.15/MENLHK/SETJEN/KUM.1/2/2017, using the same deterministic Thiessen zonation as peat depth and carbon density—no kriging, IDW, or other interpolation algorithm was applied to groundwater level either. This network covers North Pontianak only, and groundwater level is reported here purely as descriptive hydrological context for that district: no specific water-table reading or vertical datum is presented, because no such reading is relied upon anywhere in the carbon-stock calculation, which is decoupled from groundwater level entirely. Carbon stock spatial mapping was implemented in QGIS 3.28. Georeferenced borehole carbon density values (MgC·ha⁻¹) were projected to UTM Zone 49S (WGS 1984) and assigned to Thiessen zones as described above. The resulting zone map was clipped to district boundaries, classified into three carbon-density classes with physically motivated cutoffs—Low (<1,200 t C·ha⁻¹), Moderate (1,200–1,600 t C·ha⁻¹), and High (>1,600 t C·ha⁻¹), derived from natural breaks in the study’s own class-level carbon-density means—rather than an arbitrary quantile scheme, then overlaid with drainage, land-use, and peat depth layers, and produced to BIG national cartographic standards.
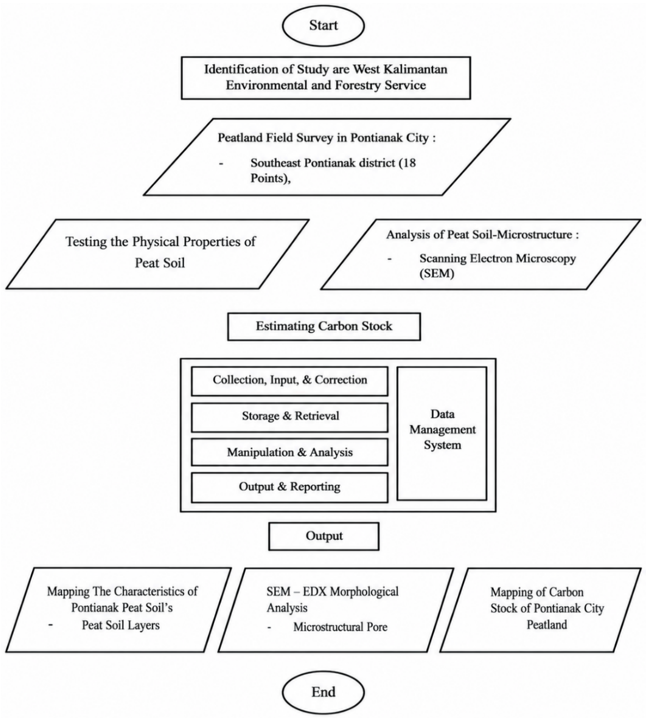
The five-phase workflow—study area identification, field survey and sampling, laboratory and SEM-EDX testing, GIS-based carbon stock estimation, and output mapping—is summarised in Figure 5.
Figure 5. Research flowchart
3.1 Field investigation and soil sampling results
Field verification across four candidate districts confirmed a continuous peat layer traced by hand auger to the organic–mineral boundary—in North Pontianak (1,732.16 ha) and Southeast Pontianak (579.80 ha) only; no comparable peat layer was identified in Pontianak City or East Pontianak, which were accordingly excluded from further sampling. Sampling density was scaled to each district’s confirmed peatland area, yielding 37 georeferenced stations (23 North, 14 Southeast) for peat depth profiling, in situ pH, Von Post humification assessment, and laboratory determination of organic content. Table 1 reports these organic content results by district: North Pontianak, consistent with its intact-to-semi-degraded peat setting (Section 2.1), returns a mean of 87.59% with approximately 96% of points meeting the ASTM D4427 ≥75% threshold, whereas Southeast Pontianak—already characterised in Section 2.1 as transitional development over disturbed residual peat swamps—returns a lower and more variable mean of 63.60%, with approximately 67% of points meeting the threshold. This organic-content pattern is consistent with, rather than a departure from, the disturbed peat setting Southeast Pontianak was selected to represent.
Table 1. Organic content and peat classification results across candidate districts
|
No |
District |
Sampling Points |
Average Organic Content (%) |
Peat Classification |
|
1 |
Pontianak City |
13 |
6.41 |
Not peat (OC < 75%) |
|
2 |
Southeast Pontianak |
14 |
63.60 |
Partial peat–approx. 67% of points ≥ 75% |
|
3 |
East Pontianak |
18 |
13.86 |
Not peat (OC < 75%) |
|
4 |
North Pontianak |
23 |
87.59 |
Peat–approx. 96% of points ≥ 75% |
3.2 Peat depth investigation results
Peat depth was profiled at each station using a hand auger (10 m capacity) to the organic–mineral boundary, sampling each maturity horizon; results appear in Table 2, with the resulting extent compared against preliminary IMDGNP estimates in Table 3.
North Pontianak depths ranged from 2.00–4.30 m (Table 2; one individual auger point recorded 1.05 m and is treated as a local outlier rather than the district range boundary), dominated by the Deep class (1,597.42 ha) per Government Regulation No. 57/2016 (>3.00 m = ecosystem protection; ≤3.00 m = agricultural productivity). Southeast Pontianak depths ranged from 1.25–3.25 m, with no Very Deep deposits, a shallower profile reflecting proximity to urban drainage and consequent peat subsidence through oxidative decomposition.
Table 2. Peat layer depth range and ecosystem function by district
|
No. |
District |
Sampling Points |
Peat Layer Depth (m) |
Ecosystem Function |
|
1 |
Southeast Pontianak |
14 |
1.25–3.25 |
Agricultural productivity |
|
2 |
North Pontianak |
23 |
2.00–4.30 |
Ecosystem protection & productivity |
Table 3. Areal distribution of peat depth classes by district
|
District |
Moderate (ha) |
Deep (ha) |
Very Deep (ha) |
Total (ha) |
|
Southeast Pontianak |
151.43 |
428.37 |
0 |
579.80 |
|
North Pontianak |
8.10 |
1,597.42 |
126.62 |
1,732.16 |
3.3 Von Post humification assessment and peat maturity
Von Post humification results for all stations, assessed at successive depth intervals, are summarised by each district's predominant class in Table 4, with station-level variation detailed below.
All stations in both districts predominantly yielded H4–H5 classification (hemic peat, fibre content 33–67%, ASTM D1997), denoting slightly to moderately decomposed peat. Of 23 North Pontianak stations, 20 are hemic, 2 sapric, and 1 fibric; of 14 Southeast Pontianak stations, 11 are hemic, 2 fibric, and 1 sapric. Hemic peat accounts for 98.5% of the combined 2,311.96 ha extent, making it the primary driver of below-ground carbon stocks. Thiessen (Voronoi) zonation of these per-point maturity classifications, following the same procedure described in Section 2.4, yielded the maturity-class areal extents in Table 5.
Table 4. Von Post scale of humification examination results (predominant classification by district)
|
No. |
District |
No. of Test Points |
Von Post Scale |
Maturity Class |
|
1 |
Southeast Pontianak |
14 |
H-4, H-5 |
Hemic |
|
2 |
North Pontianak |
23 |
H-4, H-5 |
Hemic |
Table 5. Areal extent of peat maturity (fibre content) classes by district
|
District |
Fibric (ha) |
Hemic (ha) |
Sapric (ha) |
Total (ha) |
|
Southeast Pontianak |
6.07 |
557.86 |
15.87 |
579.80 |
|
North Pontianak |
6.80 |
1,718.36 |
7.00 |
1,732.16 |
3.4 Scanning Electron Microscopy coupled with Energy-Dispersive X-Ray Spectroscopy morphological analysis of peat soil
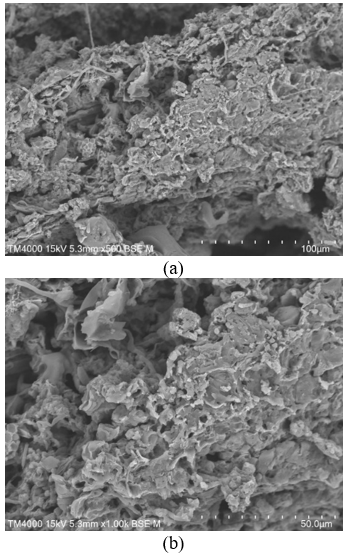
SEM micrographs at 500× and 1000× (Figure 6) reveal a dual-porosity architecture in North Pontianak peat—macropores between fibre elements and micropores within the fibre matrix—consistent with hemic classification. This interpretation is limited strictly to pore morphology and elemental composition: the macropore/micropore differentiation reflects the fibrous, partially decomposed structure characteristic of hemic peat, consistent with the Von Post humification class assigned in the field. No dissolved organic carbon (DOC) measurements were made in this study, so no inference is drawn from pore structure to DOC concentration or hydraulic transport behaviour; the bulk organic carbon density used in the carbon stock calculation is derived independently from LOI measurements (Section 2.2), not from this SEM pore-structure observation. EDX elemental composition results are presented in Table 6.
Figure 6. Scanning Electron Microscopy (SEM) micrographs of North Pontianak peat soil at (a) 500× and (b) 1000× magnification
Table 6. Elemental composition of North Pontianak District peat soil by Scanning Electron Microscopy coupled with Energy-Dispersive X-Ray Spectroscopy (SEM-EDX) analysis
|
No |
Symbol |
No. Atom |
Element |
Mass (%) |
Atom (%) |
|
1 |
C |
6 |
Carbon |
64.7523 |
71.4402 |
|
2 |
O |
8 |
Oxygen |
33.6602 |
27.8792 |
|
3 |
Al |
13 |
Aluminium |
0.4775 |
0.2345 |
|
4 |
Si |
14 |
Silicon |
0.5599 |
0.2642 |
|
5 |
Ca |
20 |
Calcium |
0.5501 |
0.1819 |
3.5 Carbon stock based on peat depth classification
Below-ground carbon stocks were stratified by peat depth class (Moderate, Deep, Very Deep) per Government Regulation No. 57/2016, using the bulk density, organic carbon fraction, and layer thickness values described in Research Methods. Table 7 presents the resulting carbon stock and density by depth classification, and Figure 7 maps this depth-based carbon stock classification spatially across both districts.
Table 7. Carbon stock and carbon density by peat depth classification
|
District |
Depth Class (cm) |
Area (km²) |
Carbon Stock (t C) |
Carbon Density (t C·ha⁻¹) |
|
Southeast Pontianak |
100–200 (Moderate) |
1.51 |
111,536.85 |
736.1 |
|
Southeast Pontianak |
200–400 (Deep) |
4.28 |
739,452.49 |
1,726.7 |
|
Southeast Pontianak Total |
100–400 |
5.80 |
850,989.34 |
1,467.7 |
|
North Pontianak |
100–200 (Moderate) |
0.08 |
7,953.51 |
981.3 |
|
North Pontianak |
200–400 (Deep) |
15.97 |
2,271,541.51 |
1,422.6 |
|
North Pontianak |
400–800 (Very Deep) |
1.27 |
211,380.19 |
1,669.0 |
|
North Pontianak Total |
100–800 |
17.32 |
2,490,875.49 |
1,438.0 |
|
Combined |
- |
23.12 |
3,341,864.83 |
1,445.5 |
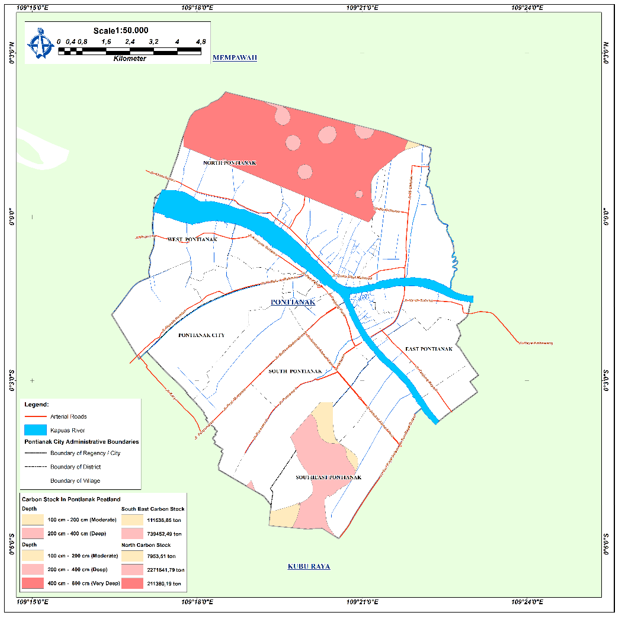
Figure 7. Spatial mapping of carbon stock based on peat depth classification
Deep peat (200–400 cm) is the principal carbon reservoir in both districts, with carbon densities (approximately 1,727 t C·ha⁻¹ Southeast; 1,423 t C·ha⁻¹ North) substantially exceeding the moderate-depth class; very deep deposits in North Pontianak (126.62 ha) reach approximately 1,669 t C·ha⁻¹. Combined totals of 850,989 t C (Southeast) and 2,490,875 t C (North) yield 3,341,864 t C at a mean density of approximately 1,446 t C·ha⁻¹ over 23.12 km²—near the 1,552.53 t C·ha⁻¹ reported by Septian et al. [32] for Jambi and well above degraded-soil values—confirming that Pontianak’s urban peatlands hold climatically significant carbon stocks; translating this stock size into an actual emissions risk, and any consequent groundwater or land-use management priority, would require further data on drainage depth, oxidation rate, and land-use change trajectory not measured in this study.
3.6 Carbon stock based on peat maturity classification
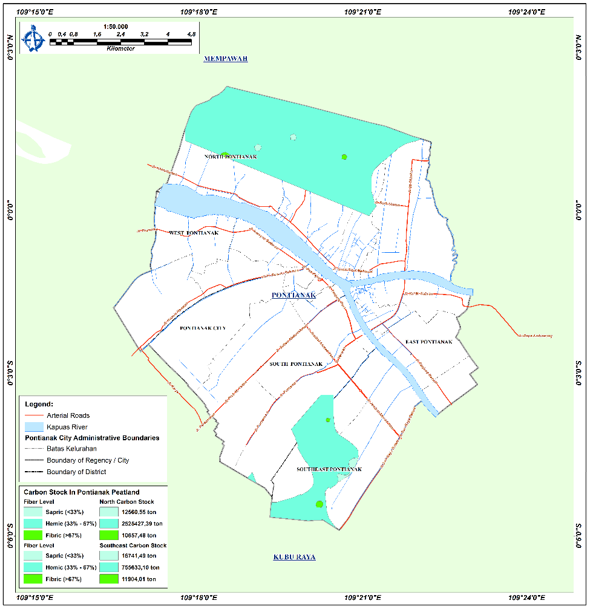
Maturity-based totals are 7.84% lower than depth-based estimates in Southeast Pontianak, 2.32% higher in North Pontianak, and 0.27% lower combined (Table 8)—a bounded discrepancy we report as an internal cross-check between the two classification schemes, not as confirmation of agreement between them. Both schemes classify the same 37 Thiessen zones over the same total area in each district (579.80 ha Southeast, 1,732.16 ha North) and draw on the same underlying point-level bulk density, organic carbon content, and depth measurements; the depth-based scheme groups zones by physical depth threshold per Government Regulation No. 57/2016, while the maturity-based scheme groups the same zones by Von Post humification class, so a given zone can be grouped with different stratum-mates under each scheme (for example, a zone classified Deep by depth may sit alongside different neighbouring zones than when it is classified Hemic by maturity). Because each stratum’s carbon stock is calculated from its own area-weighted mean bulk density, organic carbon fraction, and depth (Section 2.4) rather than from each zone’s exact individual value, a change of stratification axis changes which zones are averaged together and therefore changes the resulting stratum-level and district totals, even though both schemes classify an identical total area from identical point data. The larger discrepancy in Southeast Pontianak (7.84%) relative to North Pontianak (2.32%) is consistent with Southeast Pontianak’s smaller sample (14 versus 23 points) and its lower, more variable organic content (Table 1; Section 3.1), both of which make its stratum-average properties more sensitive to which zones fall into which group under each classification scheme. Table 9 breaks down carbon stock by maturity class: hemic peat dominates maturity-based carbon storage in both districts, contributing approximately 96% of Southeast Pontianak’s 784,279 t C and 99% of North Pontianak’s 2,548,645 t C, with fibric and sapric classes each under 4%. Figure 8 maps this maturity-based carbon-density classification spatially across both districts.
Figure 8. Spatial mapping of carbon stock based on peat maturity classification
Table 8. Reconciliation of depth-based and maturity-based carbon stock totals
|
District |
Depth-Based Total (t C) |
Maturity-Based Total (t C) |
Difference (%)a |
|
Southeast Pontianak |
850,989 |
784,279 |
−7.84 |
|
North Pontianak |
2,490,875 |
2,548,645 |
+2.32 |
|
Combined |
3,341,864 |
3,332,924 |
−0.27 |
Table 9. Below-ground carbon stock by peat maturity class
|
District |
Maturity Class |
Area (km²) |
Carbon Stock (t C) |
|
Southeast Pontianak |
Fibric |
0.061 |
11,904.01 |
|
Southeast Pontianak |
Hemic |
5.579 |
755,633.10 |
|
Southeast Pontianak |
Sapric |
0.159 |
16,741.49 |
|
Southeast Pontianak Total |
- |
5.799 |
784,278.60 |
|
North Pontianak |
Fibric |
0.068 |
12,560.55 |
|
North Pontianak |
Hemic |
17.184 |
2,525,427.39 |
|
North Pontianak |
Sapric |
0.070 |
10,657.48 |
|
North Pontianak Total |
- |
17.322 |
2,548,645.42 |
|
Combined |
- |
23.121 |
3,332,924.02 |
3.7 Spatial distribution of organic carbon
Figure 9 maps the spatial distribution of organic carbon content (%C) across both districts. Mean %C of approximately 53% in both Southeast and North Pontianak—statistically indistinguishable between districts at this precision—after Van Bemmelen conversion matches published Indonesian benchmarks (49–57%), confirming that district-level stock differences are driven primarily by deposit depth and spatial extent rather than carbon concentration.
Figure 9. Spatial distribution of organic carbon content
3.8 Implications for spatial planning and study limitations
Beyond the carbon stock totals reported in Sections 3.5–3.7, three further aspects govern how these results should be interpreted and applied: material identity, planning implications, and study limitations. SEM-EDX analysis of a single representative North Pontianak specimen confirmed the material identity of the tested peat: a dual-porosity fibre network and a carbon-dominated elemental composition (64.75 mass% C, 33.66 mass% O) with only trace Al, Si, and Ca, consistent with the organic-rich, mineralogically clean matrix expected of genuine peat under ASTM D4427. This corroborates the classification of the sampled material rather than validating the magnitude of the district-level carbon stock estimate, and was performed on a single representative North Pontianak specimen only (selected based on visually homogeneous peat material across sampling points); equivalent characterization for Southeast Pontianak was not performed (see limitations below). Carbon densities only marginally below pristine benchmarks indicate that Pontianak’s urban peatlands hold climatically significant carbon stocks despite ongoing development. This stock size is a necessary baseline for, but does not by itself quantify, the district’s emissions risk: translating it into an actual CO₂ emissions estimate would require further data on drainage depth, oxidation rate, and land-use change trajectory, none of which were measured in this study. With that caveat, the resulting spatial carbon density maps offer a baseline decision-support input for Pontianak City’s spatial planning, to be paired with such emissions-rate data before they inform specific groundwater or land-use management decisions.
Read together, the peat-depth classification map (Figure 7) and the carbon-density classification (Section 2.4) translate directly into a planning-oriented decision framework. Under Government Regulation No. 57/2016, areas mapped as Deep or Very Deep (>3.00 m; Table 3) already carry an ecosystem-protection function designation, so Figure 7 can be read as a protection-versus-agricultural-use zoning overlay for the study districts. Overlaying this with the carbon-density classification (Section 2.4) identifies a composite priority-conservation zone—areas that are both Very Deep and High-density (126.62 ha in North Pontianak)—where the regulatory protection mandate and the carbon-loss consequence of disturbance reinforce one another; we present this composite zone as an illustrative application of the mapped data to planning practice, not as a zoning determination, which remains the statutory responsibility of Pontianak City’s spatial planning authority. For groundwater and drainage-related decisions specifically, the same depth and density maps indicate where drainage control would carry the largest carbon-stock consequence, offering a spatial prioritisation for the existing piezometric network (Section 2.4) rather than a substitute for it. For foundation and construction planning, the general engineering behaviour of deep, compressible tropical peat—typically requiring piled or ground-improved foundations and staged, controlled dewatering to limit oxidative subsidence, consistent with prior peat-soil engineering design experience in this delta [14]—applies most directly to the Deep and Very Deep zones mapped here; we present this as a qualitative planning flag rather than a site-specific geotechnical recommendation, since compressibility, bearing capacity, and settlement parameters were outside the scope of this study and require dedicated geotechnical investigation before any design decision. Finally, the zonation structure itself indicates where future monitoring would most reduce uncertainty: because each Thiessen zone’s value is assigned from a single point, uncertainty is concentrated at zone boundaries and in the more sparsely sampled Southeast Pontianak District (14 points over 579.80 ha, versus 23 points over 1,732.16 ha in North Pontianak; Section 2.1); within a constrained monitoring budget, additional points sited near existing zone boundaries or within Southeast Pontianak’s larger zones would reduce district-level uncertainty more than equivalent points added inside already well-constrained, homogeneous zones.
This study has four limitations. First, although bulk density and organic content were measured in triplicate at each point and depth interval, replicate-level measurement uncertainty was not propagated into a formal error envelope; because carbon stock mapping uses deterministic Thiessen (Voronoi) zonation rather than a fitted geostatistical interpolator, there is no variogram, nugget, sill, range, or cross-validation statistic to report—any reader reconstructs an identical zone map from the same point data. The remaining, measurement-level uncertainty instead propagates through the carbon stock formula (Eq. (2)) as (σCstock/Cstock)2 ≈ (σρb/ρb)2 + (σ%Corganic/%Corganic)2 + (σD/D)2, where σρb, σ%Corganic, and σD are the standard deviations of the triplicate bulk density, LOI-derived organic carbon, and depth measurements at each point; these per-point standard deviations were recorded during triplicate testing but were not compiled or reported at the district level in this manuscript. We flag this explicitly as the outstanding step required to convert the point-estimate carbon stocks reported here into a quantified uncertainty envelope, rather than leaving uncertainty an unquantified caveat. Second, the field protocol did not define an explicit, documented rule for confirming that every sampling point was clear of built-up structures beyond in-field relocation to the nearest accessible ground (Section 2.1); no station was knowingly sited inside a built structure, but this was not formally logged point-by-point. Third, SEM-EDX characterization—used here only to confirm that the tested material is genuine, mineralogically clean peat rather than to validate the carbon stock magnitude—was performed on a single representative North Pontianak specimen (n = 1), selected for visual homogeneity with the wider sampled material rather than as a statistically replicated series. North Pontianak is accordingly treated as the primary candidate district for carbon stock calculation in this study, with Southeast Pontianak retained as a comparison case rather than an equally validated calculation basis; the LOI-based organic-carbon conversion therefore rests on a stronger evidentiary footing for North Pontianak than for Southeast Pontianak, where Table 1 shows a lower mean organic content. The 579.80 ha and 1,732.16 ha calculation areas are not themselves defined by this organic-content threshold: both were field-confirmed as continuous peat by auger profiling to the organic–mineral boundary (Section 3.1), independent of the point-level organic-content result subsequently measured in the laboratory. Organic content therefore functions in this study as a measured input to the carbon-stock formula (Eq. (2)) at each point, not as an area-inclusion criterion; Southeast Pontianak’s lower and more variable organic content is consequently carried through the reported stock as the elevated, district-specific uncertainty registered above, rather than as an exclusion of any part of its confirmed peatland extent. Fourth, the districts were sampled at different densities (23 stations/1,732.16 ha North versus 14 stations/579.80 ha Southeast) proportional to their confirmed peatland extent rather than a fixed quota per district, so the shallower Southeast profile cannot be fully disentangled from this coverage difference.
This study delivers the first integrated, district-level quantification of below-ground carbon stocks in Pontianak’s urban tropical peatlands, combining field investigation, ASTM-standardised laboratory analysis, SEM-EDX characterisation, and GIS-based spatial mapping across 23.12 km² of confirmed peatland. Three principal conclusions follow. First, the depth-stratified estimate totals 3,341,864 t C (1,445.5 t C·ha⁻¹), comprising 2,490,875 t C in North Pontianak and 850,989 t C in Southeast Pontianak, which places both districts in the high-to-very-high category for Indonesian tropical peat; the independent maturity-based estimate agrees with this total to within 0.3% at the combined level (Table 8), supporting the internal consistency of the calculation. Second, hemic peat covers 98.5% of the extent and stores 96–99% of the carbon in each district, so the difference between district stocks is governed mainly by peat depth (2.00–4.30 m in North Pontianak versus 1.25–3.25 m in Southeast Pontianak) and peatland extent rather than by peat maturity. Third, SEM-EDX analysis of a representative North Pontianak specimen (64.75 mass% C, with only trace Al, Si, and Ca) confirms that the sampled material is genuine, mineralogically clean peat.
The resulting depth and carbon-density maps provide a baseline decision-support input for Pontianak City’s spatial planning and identify 126.62 ha of Very Deep, High-density peat in North Pontianak as a candidate priority-conservation zone. Future work should (i) compile the recorded triplicate measurement variances into a formal uncertainty envelope for the district totals, (ii) extend SEM-EDX characterisation to replicated specimens from both districts, (iii) increase sampling density in Southeast Pontianak and near Thiessen-zone boundaries, and (iv) couple this carbon-stock baseline with drainage depth, oxidation rate, and land-use change data to estimate CO₂ emissions under urban expansion scenarios.
[1] Ribeiro, K., Pacheco, F.S., Ferreira, J.W., et al. (2021). Tropical peatlands and their contribution to the global carbon cycle and climate change. Global Change Biology, 27(3): 489-505. https://doi.org/10.1111/gcb.15408
[2] Carless, D., Luscombe, D.J., Gatis, N., Anderson, K., Brazier, R.E. (2019). Mapping landscape-scale peatland degradation using airborne lidar and multispectral data. Landscape Ecology, 34(6): 1329-1345. https://doi.org/10.1007/s10980-019-00844-5
[3] Page, S.E., Rieley, J.O., Banks, C.J. (2011). Global and regional importance of the tropical peatland carbon pool. Global Change Biology, 17(2): 798-818. https://doi.org/10.1111/j.1365-2486.2010.02279.x
[4] Walker, A.P., De Kauwe, M.G., Bastos, A., et al. (2021). Integrating the evidence for a terrestrial carbon sink caused by increasing atmospheric CO2. New Phytologist, 229(5): 2413-2445. https://doi.org/10.1111/nph.16866
[5] Hiller, B., Fisher, J. (2023). A multifunctional ‘scape approach for sustainable management of intact ecosystems—A review of tropical peatlands. Sustainability, 15(3): 2484. https://doi.org/10.3390/su15032484
[6] Hu, J., VanZomeren, C.M., Inglett, K.S., Wright, A.L., Clark, M.W., Reddy, K.R. (2017). Greenhouse gas emissions under different drainage and flooding regimes of cultivated peatlands. Journal of Geophysical Research: Biogeosciences, 122(11): 3047-3062. https://doi.org/10.1002/2017JG004010
[7] Evers, S., Yule, C.M., Padfield, R., O'Reilly, P., Varkkey, H. (2017). Keep wetlands wet: The myth of sustainable development of tropical peatlands–implications for policies and management. Global Change Biology, 23(2): 534-549. https://doi.org/10.1111/gcb.13422
[8] Agus, F., Gunarso, P., Sahardjo, B.H., Harris, N., van Noordwijk, M., Killeen, T.J. (2013). Historical CO2 emissions from land use and land use change from the oil palm industry in Indonesia, Malaysia and Papua New Guinea. Roundtable on Sustainable Palm Oil, Kuala Lumpur, 65-88.
[9] Mishra, S., Page, S.E., Cobb, A.R., et al. (2021). Degradation of southeast Asian tropical peatlands and integrated strategies for their better management and restoration. Journal of Applied Ecology, 58(7): 1370-1387. https://doi.org/10.1111/1365-2664.13905
[10] Jung, Y., Kim, J. (2025). Subnational REDD+ implementation: A synthesis of opportunities and challenges. Land, 14(6): 1152. https://doi.org/10.3390/land14061152
[11] Choy, Y.K., Onuma, A. (2025). The tropical peatlands in Indonesia and global environmental change: A multi-dimensional system-based analysis and policy implications. Regional Science and Environmental Economics, 2(3): 17. https://doi.org/10.3390/rsee2030017
[12] Wijedasa, L.S., Sloan, S., Page, S.E., Clements, G.R., Lupascu, M., Evans, T.A. (2018). Carbon emissions from south-east Asian peatlands will increase despite emission-reduction schemes. Global Change Biology, 24(10): 4598-4613. https://doi.org/10.1111/gcb.14340
[13] Basuki, I. (2017). Carbon dynamics in response to land cover change in tropical peatlands, Kalimantan, Indonesia. Ph.D. dissertation, Oregon State University, Corvallis, Oregon, USA. http://hdl.handle.net/1957/61527.
[14] Parabi, A., Taib, S.N.L., Hasan, A., et al. (2025). Design of clean water treatment installation for remote rural Borneo regency with consideration of peat soil conditions. Desalination and Water Treatment, 324: 101568. https://doi.org/10.1016/j.dwt.2025.101568
[15] Parabi, A., Taib, S.N.L., Ahmadi, R., et al. (2026). Tropical equatorial peatland demarcation and land use analysis in Borneo's Pontianak delta using geospatial approach. International Journal of Sustainable Development & Planning, 21(3): 977-992. https://doi.org/10.18280/ijsdp.210303
[16] Agus, F., Hairiah, K., Mulyani, A. (2010). Measuring Carbon Stock in Peat Soils: Practical Guidelines. World Agroforestry Centre, Bogor, Indonesia.
[17] Warren, M.W., Kauffman, J.B., Murdiyarso, D., et al. (2012). A cost-efficient method to assess carbon stocks in tropical peat soil. Biogeosciences, 9(11): 4477-4485. https://doi.org/10.5194/bg-9-4477-2012
[18] Paramananthan, S., Lee, P.X., Wong, M.K., Van Ranst, E., Wüst, R.A.J., Vijiandran, J.R. (2018). A comparative study of the use of organic carbon and loss on ignition in defining tropical organic soil materials. Communications in Soil Science and Plant Analysis, 49(5): 626-634. https://doi.org/10.1080/00103624.2018.1435683
[19] Minasny, B., Akoeb, E.N., Sabrina, T., Wadoux, A.M.C., McBratney, A.B. (2020). History and interpretation of early soil and organic matter investigations in Deli, Sumatra, Indonesia. Catena, 195: 104909. https://doi.org/10.1016/j.catena.2020.104909
[20] Ratefinjanahary, I., MacKenzie, R., Sharma, S., et al. (2025). Development of soil organic carbon quantification model and comparison based on CHN analyser, loss on ignition, and walkley-black methods for mangrove soils in Madagascar. Estuarine, Coastal and Shelf Science, 317: 109182. https://doi.org/10.1016/j.ecss.2025.109182
[21] Sinclair, A.L., Graham, L.L., Putra, E.I., et al. (2020). Effects of distance from canal and degradation history on peat bulk density in a degraded tropical peatland. Science of the Total Environment, 699: 134199. https://doi.org/10.1016/j.scitotenv.2019.134199
[22] Mirzaeitalarposhti, R., Demyan, M.S., Rasche, F., Poltoradnev, M., Cadisch, G., Müller, T. (2015). MidDRIFTS-PLSR-based quantification of physico-chemical soil properties across two agroecological zones in Southwest Germany: Generic independent validation surpasses region specific cross-validation. Nutrient Cycling in Agroecosystems, 102(2): 265-283. https://doi.org/10.1007/s10705-015-9698-1
[23] Romão, L.P., Lead, J.R., Rocha, J.C., et al. (2007). Structure and properties of Brazilian peat: Analysis by spectroscopy and microscopy. Journal of the Brazilian Chemical Society, 18(4): 714-720. https://doi.org/10.1590/S0103-50532007000400008
[24] Ahmad, A., Sutanto, M.H., Ahmad, N.R., Mohamad, M.E., Bujang, M. (2022). Microstructural characterization of fibric peat stabilized with Portland cement and silica fume. Materials, 16(1): 18. https://doi.org/10.3390/ma16010018
[25] Rydelek, P. (2006). Application of scanning electron microscope (SEM) in peat studies. Polish Journal of Environmental Studies, 15(5D): 117-121.
[26] Paul, A., Hussain, M., Ramu, B. (2021). The physicochemical properties and microstructural characteristics of peat and their correlations: Reappraisal. International Journal of Geotechnical Engineering, 15(6): 692-703. https://doi.org/10.1080/19386362.2018.1483099
[27] Fiantis, D., Rudiyanto, Ginting, F.I., et al. (2024). Mapping peat thickness and carbon stock of a degraded peatland in West Sumatra, Indonesia. Soil Use and Management, 40(1): e12954. https://doi.org/10.1111/sum.12954
[28] Sutikno, S., Yusa, M., Hendri, A., Kusairi, M., Muhammad, A., Qomar, N. (2025). Mapping peat thickness and groundwater level using a portable electromagnetic instrument in Indragiri Hilir, Riau, Indonesia. Journal of Degraded and Mining Lands Management, 12(3): 7431-7441. https://doi.org/10.15243/jdmlm.2025.123.7431
[29] Jaenicke, J., Rieley, J.O., Mott, C., Kimman, P., Siegert, F. (2008). Determination of the amount of carbon stored in Indonesian peatlands. Geoderma, 147(3-4): 151-158. https://doi.org/10.1016/j.geoderma.2008.08.008
[30] Gunawan, H., Kobayashi, S., Mizuno, K., Kono, Y. (2012). Peat swamp forest types and their regeneration in Giam Siak Kecil-Bukit Batu Biosphere Reserve, Riau, East Sumatra, Indonesia. Mires and Peat, 10: 5. https://doi.org/10.19189/001c.128458
[31] Ritung, S., Wahyunto, Nugroho, K., Sukarman, Hikmatullah, Suparto, Tafakresnanto, C. (2011). Peta Lahan Gambut Indonesia Skala 1:250,000 [Indonesian Peatland Map, Scale 1:250,000]. Balai Besar Penelitian dan Pengembangan Sumberdaya Lahan Pertanian, Ministry of Agriculture, Bogor, Indonesia. https://repository.pertanian.go.id/handle/123456789/5840.
[32] Septian, A., Junedi, H., Mastur, A.K. (2023). Estimation of carbon reserves below the surface of peatlands in Catur Rahayu Village, Dendang District, Tanjung Jabung Timur Regency [in Indonesian]. Jurnal Tanah dan Sumberdaya Lahan, 10(2): 285-295. https://doi.org/10.21776/ub.jtsl.2023.010.2.12
[33] Wahyunto, Ritung, S., Suparto, Subagjo, H. (2004). Peatland distribution and carbon content in Sumatra and Kalimantan [in Indonesian]. Wetlands International–Indonesia Programme and Wildlife Habitat Canada (WHC), Bogor, Indonesia. https://indonesia.wetlands.org/id/publikasi/sebaran-gambut-dan-kandungan-karbon-di-sumatera-dan-kalimantan-2004/.
[34] Thiessen, A.H. (1911). Precipitation averages for large areas. Monthly Weather Review, 39(7): 1082-1089. https://doi.org/10.1175/1520-0493(1911)39%3C1082b:PAFLA%3E2.0.CO;2