Kairat Kunanbayev* | Natalya Zuyeva | Galina Churkina | Lyudmila Zhloba | Yevgeniy Mamykin | Almabek Nugmanov | Aigul Zhapparova
© 2026 The authors. This article is published by IIETA and is licensed under the CC BY 4.0 license (http://creativecommons.org/licenses/by/4.0/).
OPEN ACCESS
This study compared pseudo-total (acid-soluble) and mobile Cu, Zn, and Cd in the 0–20 cm layer of carbonate chernozem in North Kazakhstan over a three-year period (2020–2022). A 2 × 4 factorial experiment combined conventional tillage (CT) and no-till (NT) with control, P20, N20, and N20P20 fertilization treatments. Metals were determined by atomic absorption spectrometry following extraction with 5 M HNO₃ or ammonium acetate buffer at pH 4.8, respectively. Annual profiles digitized from the study figures were centered on reported treatment means and analyzed by analysis of variance (ANOVA) with Year as a blocking factor. Across treatments, three-year mean pseudo-total concentrations were 19.04–21.07, 49.73–56.47, and 0.51–0.76 mg kg⁻¹ for Cu, Zn, and Cd, respectively; corresponding mobile concentrations were 0.87–1.44, 0.60–0.88, and 0.19–0.23 mg kg⁻¹. Fertilization was associated with pseudo-total Zn (F₃,₁₄ ≈ 4.41; p ≈ 0.022), while NT had higher pseudo-total Cd (F₁,₁₄ ≈ 6.41; p ≈ 0.024) and mobile Cu (F₁,₁₄ ≈ 23.38; p ≈ 2.65 × 10⁻⁴). The mobile factor (MF), calculated as the mobile-to-pseudo-total ratio of treatment means and expressed as a percentage, ranged from 4.28–5.11% under CT to 5.82–6.99% under NT for Cu; across both systems, MF ranged from 1.19–1.61% for Zn and 27.14–37.70% for Cd. Year was significant for all responses, with the largest Year F-statistic for mobile Cd (F₂,₁₄ ≈ 261.38; p ≈ 8.21 × 10⁻¹²). Precipitation and air temperature characterized the weather context, but their independent effects were not estimated. These findings support element-specific monitoring of acid-soluble and mobile concentrations, with particular attention to Cu under NT and interannual Cd variability.
analysis of variance, cadmium, carbonate chernozem, conventional soil treatment, copper, interannual variability
Carbonate chernozems of North Kazakhstan and the Eurasian steppe contain CaCO₃ and are characterized by an alkaline soil reaction and relatively high organic matter content, which together regulate nutrient availability and cycling [1]. Due to these properties, chernozems are highly fertile and serve as the foundation of agricultural productivity in the steppe regions of Kazakhstan [2]. Southern carbonate chernozems developed on carbonate-rich loamy sediments and cover approximately 3.5 million hectares in North Kazakhstan, with extensive areas in the Akmola region [3]. Carbonate distribution within the soil profile is influenced by hydrothermal conditions and soil moisture dynamics [4].
Copper (Cu), zinc (Zn), and cadmium (Cd) enter agricultural soils through natural sources, including parent materials, and anthropogenic inputs such as fertilizers, soil amendments, industrial emissions, and atmospheric deposition [5, 6]. Excessive accumulation can cause phytotoxicity, reduce crop productivity and quality, and increase health risks through transfer along soil–plant–human food chains [7-9]. Studies of intensive agriculture in calcareous environments indicate that acceptable total concentrations alone do not exclude concerns about mobile metal fractions [10]. Cd warrants particular attention because of its potential bioavailability and transfer to food crops [11].
The distinction between the total content and mobile forms of Cu, Zn, and Cd is key to the accurate assessment of environmental risks and potential metal uptake by plants. Total content characterizes the overall level of pollution but does not reliably predict migration capacity and bioavailability, which determine the uptake of these metals by plants and their environmental significance [12]. Mobile fractions therefore provide complementary information on potential redistribution within the soil profile and transfer to plants, supporting risk-oriented soil assessment [13]. In the present study, “pseudo-total” refers specifically to the acid-soluble fraction extracted with 5 M HNO₃, rather than complete metal recovery from the soil. Mobile concentrations refer to ammonium acetate-extractable metals at pH 4.8.
The impact of no-till (NT) compared to conventional tillage (CT) on the mobility and bioavailability of Cu, Zn, and Cd depends on changes in soil organic matter, structure, and sorption properties, together with microbial activity and acid–base conditions. Under NT, accumulation of organic matter in the surface layer and inputs from plant residues may increase sorption capacity and reduce Zn and Cd mobility [14]. At the same time, differences in pH and organic carbon content under different management systems have been associated with greater retention of Cu, Zn, and Cd [15]. Conversely, higher diethylenetriaminepentaacetic acid (DTPA)-extractable Cu and Zn have been reported under NT, although these increases do not necessarily correspond to proportional changes in plant concentrations [16]. Such differences require element-specific interpretation rather than an assumption that NT consistently increases or decreases metal mobility.
Studies of NT systems and organic amendments have reported changes in the proportions of labile Cu, Zn, and Cd, highlighting the relevance of fractional composition in addition to total concentrations [17-19]. Reported shifts in Cd distribution among soil fractions can modify its migration potential [17, 20]. Cu is more closely associated with organic matter and humus components, whereas Zn is more frequently found in mineral or residual fractions [21, 22]. Soil pH, organic matter content, and inter-element interactions may therefore affect the direction and magnitude of the response. In addition, initial increases in labile fractions can partially diminish over time, which limits extrapolation from short-term observations to longer periods [17, 19, 20].
Research on ordinary and southern carbonate chernozems with NT reports an acceptable pollution index for agricultural use while emphasizing the need for regular monitoring, taking into account differences in soil types [23]. In typical chernozems, field evidence also shows that tillage can alter the vertical distribution of trace elements. With plowing, a number of elements accumulate mainly in the 10–20 cm layer, while with NT, they are concentrated in the 0–10 cm layer, which demonstrates the effect of stratification with minimal soil mixing [24]. Such stratification is relevant to the present study because analysis of a combined 0–20 cm layer cannot resolve differences between these sublayers.
Previous field observations reported low mobile Cd and acceptable mobile Cu concentrations, with no significant changes in either element attributable to cultivation technologies or mineral fertilization. Mobile Zn also remained below the reported acceptable levels, although increases were observed following ammonium nitrate application [25]. These findings illustrate why treatment comparisons should distinguish between individual metals and the fractions measured.
The remaining knowledge gap concerns the combined, short-term assessment of acid-soluble and mobile Cu, Zn, and Cd under different tillage and mineral fertilization treatments in carbonate chernozems of North Kazakhstan. In particular, it remains unclear whether treatment-related differences in acid-soluble concentrations are accompanied by corresponding differences in mobile concentrations and their relative proportions when interannual variability is taken into account. Addressing this question requires an element-specific comparison of both fractions within the same experimental framework.
The aim of the present study was to assess short-term differences in pseudo-total (acid-soluble) and mobile Cu, Zn, and Cd in the 0–20 cm soil layer of carbonate chernozems in North Kazakhstan over a three-year observation period (2020–2022) depending on the tillage system and mineral fertilization. Treatment effects on metal concentrations were evaluated using analysis of variance (ANOVA) with year included as a blocking factor. The mobile factor (MF, %) was used to compare mobile concentrations as a percentage of the corresponding pseudo-total concentrations.
Field studies were conducted on southern carbonate chernozems in North Kazakhstan during 2020–2022. The agrochemical characteristics of the sampled 0–20 cm soil layer are presented in Table 1. The soil had an alkaline reaction (pH 8.46) and a humus content of 3.39%. Extractable potassium and phosphorus, expressed as K₂O and P₂O₅, were 770 and 35.3 mg kg⁻¹, respectively, while nitrate nitrogen was 23.8 mg kg⁻¹.
Table 1. Agrochemical characteristics of the arable area with southern carbonate chernozems
|
Humus, % |
pH |
K₂O, mg/kg |
P₂O₅, mg/kg |
N–NO₃⁻, mg/kg |
|
3.39 |
8.46 |
770 |
35.3 |
23.8 |
The field experiment followed a randomized complete block design (RCBD) with three field replicates and a 2 × 4 factorial treatment structure. Factor A comprised CT and NT. The coordinates of the CT and NT experimental areas were 51.612204° N, 71.038006° E and 51.613018° N, 71.042738° E, respectively. Individual plots measured 4.3 × 50 m (215 m²).
Factor B comprised four mineral fertilization treatments: an unfertilized control, ammophos (P20), ammonium nitrate (N20), and combined ammophos and ammonium nitrate (N20P20). Fertilization was analyzed as a categorical factor with these four levels.
Under NT, no primary mechanical tillage was performed. Residues of the previous crop were retained and distributed across the soil surface, providing at least 70% surface cover. Sowing was performed using a PRIMERA DMC direct seed drill (Amazone, Germany). The seeds were embedded to a depth of 4–6 cm in rows spaced 25 cm apart. Mineral fertilizers were placed locally at seed depth during sowing.
Under CT, primary tillage was performed in autumn using a PG-3 subsurface tiller at a depth of 25–27 cm. Spring operations included harrowing with a BIG-3 implement at 4–6 cm, followed by presowing cultivation with a KPSh-3 blade cultivator at 6–8 cm approximately one week before sowing.
2.1 Agrometeorological conditions
Growing-season weather conditions during 2020–2022 are presented in Figure 1, which compares monthly precipitation and air temperature with long-term mean values. These records provide environmental context for interpreting interannual variation in soil metal concentrations. Precipitation and temperature were not included as separate explanatory variables in the statistical analysis. Year was included as a categorical blocking factor and was interpreted as an overall interannual effect, not as an independently estimated effect of precipitation or temperature.

Figure 1. Monthly precipitation and air temperature during the growing seasons of 2020–2022, compared with long-term mean values
2.2 Soil sample collection and preparation
Soil samples were collected from the 0–20 cm soil layer. Within each plot, 10 soil cores were collected using a soil auger at points uniformly distributed across the area and combined into a single composite sample. Each composite represented the sampled soil layer at the plot level rather than an individual sampling point.
The common 0–20 cm sampling interval provided an integrated basis for comparing the upper soil layer under both tillage systems. Compositing did not allow separate assessment of the 0–10 and 10–20 cm sublayers and could therefore mask near-surface metal stratification under NT. The findings characterize the combined 0–20 cm layer rather than depth-specific metal distributions.
Prior to the analysis, soil samples were air-dried and sieved through a 1 mm sieve. Metal concentrations were expressed in mg kg⁻¹ of air-dry soil.
2.3 Sample extraction, instrumental analysis, and quality control
Cu, Zn, and Cd in the soil extracts were determined by flame atomic absorption spectrometry using an AA-140 spectrometer (Varian), an air–acetylene flame, and element-specific hollow cathode lamps. The analytical wavelengths were 324.8 nm for Cu, 213.9 nm for Zn, and 228.8 nm for Cd.
Calibration was performed using a series of standard solutions. Calibration stability was checked by analyzing a control standard after every five determinations. All determinations were repeated at least three times. Blanks were analyzed alongside the soil samples. These laboratory determinations were distinct from the field replicates and the annual treatment means used in the statistical analysis.
2.3.1 Pseudo-total, acid-soluble metals
Analytical recoveries for pseudo-total Cu, Zn, and Cd were 98.0%, 98.0%, and 97.0%, respectively. The corresponding recoveries for the mobile fractions were 97.0%, 98.0%, and 97.0%. Method detection limits (MDLs), expressed on an air-dry soil mass basis, were 0.050, 0.020, and 0.005 mg kg⁻¹ for pseudo-total Cu, Zn, and Cd, respectively, and 0.100, 0.040, and 0.010 mg kg⁻¹ for the corresponding mobile fractions.
Pseudo-total concentrations of Cu, Zn, and Cd were operationally defined as the acid-soluble fractions recovered by extraction with 5 M HNO₃. The extraction principle is described in RD 52.18.191-2018 [26]; the sample mass and heating conditions used here are specified below and differ from that reference procedure. These measurements do not represent total elemental concentrations obtained by complete soil digestion.
A 10 g portion of air-dry soil was placed in a conical flask and treated with 50 mL of 5 M HNO₃, giving a soil-to-solution ratio of 1:5. The suspension was heated for 3 h in a sand bath maintained at 95–100 ℃. After cooling, it was filtered through an ash-free “white tape” filter, and the first portions of the filtrate were discarded. Metal concentrations in the filtrate were determined by flame atomic absorption spectrometry.
2.3.2 Mobile metals
Mobile Cu, Zn, and Cd were operationally defined as the fractions extracted with ammonium acetate buffer at pH 4.8 using the two-step extraction described in Section 4.5.3 of the CINAO guidelines [27].
A 10 g portion of air-dry soil was combined with 50 mL of buffer and shaken for 1 h. The suspension was filtered while retaining as much soil as possible in the extraction flask. A second 50 mL portion of buffer was added to the remaining soil, and extraction was repeated for 1 h. The second suspension was transferred to the filter, and both extracts were combined for flame atomic absorption analysis. The soil-to-extractant ratio was 1:5 at each step, with a cumulative addition of 100 mL of buffer per 10 g of soil.
Throughout the study, “mobile” refers to the fraction recovered by this extraction, not to a direct measurement of plant uptake. The analytical scheme distinguished two operationally defined extractable fractions rather than providing a complete sequential fractionation of soil metals.
2.4 Statistical analysis
All calculations and statistical processing were performed in the R 4.5.1 environment. Observations within each year were averaged to obtain one annual mean concentration for each tillage × fertilization combination. The dataset therefore contained 24 annual treatment means per response variable: two tillage systems × four fertilization treatments × three years. These annual means, rather than individual analytical determinations, were used as observations in the reported ANOVA.
Separate ANOVA models were fitted for the pseudo-total and mobile concentrations of each metal. The models included tillage, fertilization, their interaction, and Year as an additive categorical blocking factor:
$Y_{i j k}=\mu+T_i+F_j+(T \times F)_{i j}+B_k+\varepsilon_{i j k}$ (1)
Here, Yijk is the annual mean concentration for tillage system i, fertilization treatment j, and year k; μ is the overall mean; Ti and Fj are the tillage and fertilization effects; (T × F)ij is their interaction; Bk is the Year effect; and εijk is the residual term. This balanced model had 14 residual degrees of freedom. Interactions with Year, field-block effects, and within-plot temporal correlations were not modeled separately.
Potential outliers were screened separately for each of the six response variables using externally studentized residuals from the corresponding ANOVA model. Annual treatment means with absolute externally studentized residuals greater than 3 were flagged for further examination rather than automatic exclusion. No annual treatment means exceeded this threshold, and all 24 annual treatment means per response variable were retained. This screening applied to the annual treatment means used in the ANOVA, not to individual field or laboratory observations.
Concentrations were summarized as means ± standard errors across the three annual means for each treatment combination:
$S E=\frac{S}{\sqrt{n}}, n=3$ (2)
Here, s is the sample standard deviation of the annual means. The SE therefore describes variation among annual treatment means rather than analytical repeatability or within-year variation among field replicates. The significance level was set at p ≤ 0.05.
The MF was calculated separately for each metal and treatment combination as the ratio of the corresponding three-year mean concentrations:
$M F (\%)=100 \times \frac{\bar{C}_{m o b}}{\bar{C}_{p t}}$ (3)
Here, $\bar{C}_{m o b}$ and $\bar{C}_{pt}$ denote the three-year mean mobile and pseudo-total concentrations, respectively. MF was used as a descriptive index of the mobile concentration relative to the acid-soluble concentration. This ratio of means is distinct from the arithmetic mean of three annual MF values. The ANOVA described above concerned metal concentrations, not MF.
3.1 Pseudo-total metal concentrations
The three-year mean pseudo-total Cu concentrations ranged from 19.04 to 20.76 mg kg⁻¹ under CT and from 20.10 to 21.07 mg kg⁻¹ under NT across the four fertilization treatments (Table 2). These ranges describe differences among treatment means, not the full range of annual concentrations. Within the model, tillage, fertilization, and their interaction did not reach the 0.05 threshold for Cupt, whereas year did (Table 3).
Table 2. Pseudo-total concentrations in the 0–20 cm soil layer: Reported three-year means ± approximate SE (mg kg⁻¹)
|
Tillage |
Fertilization |
Cupt |
Znpt |
Cdpt |
|
CT |
Control |
19.04 ± 1.81 |
50.39 ± 6.75 |
0.51 ± 0.12 |
|
CT |
P20 |
20.33 ± 1.66 |
54.60 ± 3.96 |
0.60 ± 0.20 |
|
CT |
N20 |
20.75 ± 1.75 |
55.90 ± 3.84 |
0.61 ± 0.10 |
|
CT |
N20P20 |
20.76 ± 1.64 |
54.92 ± 4.13 |
0.62 ± 0.12 |
|
NT |
Control |
20.10 ± 1.57 |
49.73 ± 8.09 |
0.56 ± 0.09 |
|
NT |
P20 |
21.07 ± 2.04 |
54.18 ± 5.15 |
0.72 ± 0.17 |
|
NT |
N20 |
20.75 ± 1.67 |
56.13 ± 4.96 |
0.70 ± 0.09 |
|
NT |
N20P20 |
20.60 ± 1.65 |
56.47 ± 3.51 |
0.76 ± 0.18 |
|
Response |
Factor |
df₁ |
df₂ |
F ≈ |
p ≈ |
|
Cupt |
Tillage |
1 |
14 |
1.17 |
0.297 |
|
Fertilization |
3 |
14 |
2.27 |
0.125 |
|
|
Year |
2 |
14 |
76.43 |
2.93 × 10⁻⁸ |
|
|
Tillage × fertilization |
3 |
14 |
0.60 |
0.628 |
|
|
Znpt |
Tillage |
1 |
14 |
0.018 |
0.895 |
|
Fertilization |
3 |
14 |
4.41 |
0.022 |
|
|
Year |
2 |
14 |
57.96 |
1.69 × 10⁻⁷ |
|
|
Tillage × fertilization |
3 |
14 |
0.14 |
0.932 |
|
|
Cdpt |
Tillage |
1 |
14 |
6.41 |
0.024 |
|
Fertilization |
3 |
14 |
3.00 |
0.066 |
|
|
Year |
2 |
14 |
42.86 |
1.08 × 10⁻⁶ |
|
|
Tillage × fertilization |
3 |
14 |
0.25 |
0.863 |
|
|
Cumob |
Tillage |
1 |
14 |
23.38 |
2.65 × 10⁻⁴ |
|
Fertilization |
3 |
14 |
1.16 |
0.358 |
|
|
Year |
2 |
14 |
85.16 |
1.46 × 10⁻⁸ |
|
|
Tillage × fertilization |
3 |
14 |
0.35 |
0.793 |
|
|
Znmob |
Tillage |
1 |
14 |
0.0017 |
0.968 |
|
Fertilization |
3 |
14 |
1.66 |
0.222 |
|
|
Year |
2 |
14 |
49.48 |
4.49 × 10⁻⁷ |
|
|
Tillage × fertilization |
3 |
14 |
0.37 |
0.778 |
|
|
Cdmob |
Tillage |
1 |
14 |
0.044 |
0.837 |
|
Fertilization |
3 |
14 |
0.86 |
0.485 |
|
|
Year |
2 |
14 |
261.38 |
8.21 × 10⁻¹² |
|
|
Tillage × fertilization |
3 |
14 |
1.44 |
0.273 |
Pseudo-total Zn ranged from 50.39 to 55.90 mg kg⁻¹ under CT and from 49.73 to 56.47 mg kg⁻¹ under NT. The mean concentration was numerically higher in each fertilized treatment than in its corresponding control (Table 2). The overall fertilization test gave F(3, 14) ≈ 4.41 and p ≈ 0.022, whereas tillage and the interaction were not significant (Table 3).
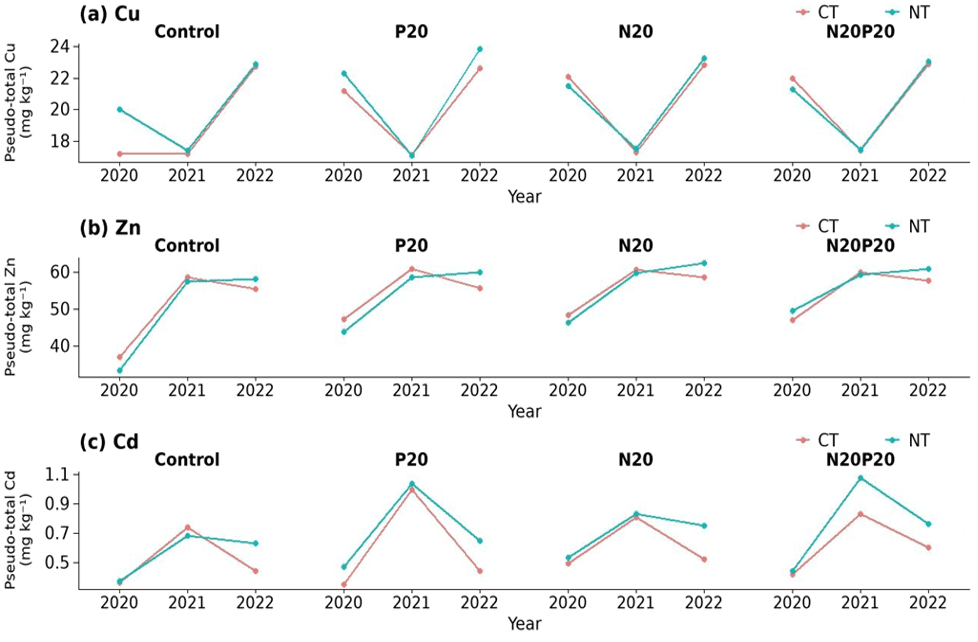
Pseudo-total Cd ranged from 0.51 to 0.62 mg kg⁻¹ under CT and from 0.56 to 0.76 mg kg⁻¹ under NT, with higher NT means in each corresponding fertilization treatment (Table 2). The tillage test gave F(1, 14) ≈ 6.41 and p ≈ 0.024. Fertilization did not reach the specified threshold (p ≈ 0.066), and the interaction was not significant. Year was significant for all three pseudo-total metals within the model (Table 3); the annual profiles of Cu, Zn, and Cd are shown in Figures 2(a), 2(b), and 2(c), respectively.
3.2 Mobile metal concentrations
Three-year mean mobile Cu concentrations were higher under NT than under CT in each corresponding fertilization treatment, ranging from 1.17 to 1.44 and from 0.87 to 1.06 mg kg⁻¹, respectively (Table 4). Within the model, tillage was significant for Cumob (F(1, 14) ≈ 23.38, p ≈ 2.65 × 10⁻⁴), whereas fertilization and the interaction were not significant (Table 3). Figure 3(a) shows lower mobile Cu concentrations in 2021, followed by an increase in 2022 across the treatments.
Mobile Zn ranged from 0.60 to 0.88 mg kg⁻¹ under CT and from 0.68 to 0.78 mg kg⁻¹ under NT (Figure 3(b)). Mobile Cd ranged from 0.19 to 0.23 mg kg⁻¹ under both systems (Table 4). Tillage, fertilization, and their interaction did not reach the 0.05 threshold for either response. Year was significant for Znmob (F(2, 14) ≈ 49.48, p ≈ 4.49 × 10⁻⁷) and Cdmob (F(2, 14) ≈ 261.38, p ≈ 8.21 × 10⁻¹²) in the model (Table 3).
The source profiles show low mobile Cd concentrations in 2020 across the treatment combinations, followed by higher concentrations in 2021 and 2022 (Figure 3(c)). This common temporal pattern describes the annual variation.
Table 4. Mobile concentrations in the 0–20 cm soil layer: reported three-year means ± approximate SE (mg kg⁻¹)
|
Tillage |
Fertilization |
Cumob |
Znmob |
Cdmob |
|
CT |
Control |
0.89 ± 0.28 |
0.60 ± 0.20 |
0.19 ± 0.09 |
|
CT |
P20 |
0.87 ± 0.23 |
0.88 ± 0.39 |
0.20 ± 0.09 |
|
CT |
N20 |
0.92 ± 0.30 |
0.76 ± 0.20 |
0.23 ± 0.11 |
|
CT |
N20P20 |
1.06 ± 0.36 |
0.75 ± 0.19 |
0.20 ± 0.09 |
|
NT |
Control |
1.17 ± 0.44 |
0.68 ± 0.20 |
0.19 ± 0.09 |
|
NT |
P20 |
1.37 ± 0.53 |
0.78 ± 0.20 |
0.20 ± 0.10 |
|
NT |
N20 |
1.39 ± 0.50 |
0.76 ± 0.18 |
0.19 ± 0.09 |
|
NT |
N20P20 |
1.44 ± 0.49 |
0.76 ± 0.21 |
0.23 ± 0.11 |
Note: CT = conventional tillage; NT = no-till.
3.3 Mobile factor
The MF was calculated as 100 × the reported three-year mean mobile concentration divided by the corresponding pseudo-total concentration (Table 5). Cu MF ranged from 4.28% to 5.11% under CT and from 5.82% to 6.99% under NT. NT therefore had a higher Cu ratio in every corresponding treatment. Zn MF remained low, between 1.19% and 1.61% across all treatment combinations (Figure 4).
Cd had the highest MF, ranging from 32.26% to 37.70% under CT and from 27.14% to 33.93% under NT. The lower Cd ratios under NT occurred alongside higher pseudo-total Cd and similar ranges of mobile Cd concentrations. They should not be interpreted as independently demonstrating reduced mobile Cd. MF comparisons are descriptive; no separate significance tests or annual-MF standard errors are reported.
Table 5. Mobile factor (MF, %) calculated from the reported three-year treatment means
|
Tillage |
Fertilization |
Cu MF (%) |
Zn MF (%) |
Cd MF (%) |
|
CT |
Control |
4.67 |
1.19 |
37.25 |
|
CT |
P20 |
4.28 |
1.61 |
33.33 |
|
CT |
N20 |
4.43 |
1.36 |
37.70 |
|
CT |
N20P20 |
5.11 |
1.37 |
32.26 |
|
NT |
Control |
5.82 |
1.37 |
33.93 |
|
NT |
P20 |
6.50 |
1.44 |
27.78 |
|
NT |
N20 |
6.70 |
1.35 |
27.14 |
|
NT |
N20P20 |
6.99 |
1.35 |
30.26 |
Note: CT = conventional tillage; NT = no-till.


Differences between tillage and fertilization treatments depended on both the metal and the fraction measured. Mobile Cu and pseudo-total Cd concentrations were higher under NT, whereas fertilized treatments had higher pseudo-total Zn means (Tables 2–4). These contrasting responses show why acid-soluble concentrations and mobile fractions should be considered together: differences in one fraction were not necessarily accompanied by corresponding differences in the other.
The higher mobile Cu concentrations under NT agree with the findings of de Santiago et al. [16], who reported greater DTPA-extractable Cu and Zn under NT after 21 years of contrasting tillage treatments on a calcareous Vertisol. They associated these differences with greater surface organic matter and microbial activity, although plant concentrations did not increase. Organic matter offers a plausible explanation for the Cu response in the present study because it can promote both retention on solid surfaces and mobilization through dissolved organic complexes. Lair et al. [15] demonstrated strong Cu retention by soil organic matter, while Hernández-Soriano et al. [28] and Lee and Chen [29] showed that dissolved organic compounds can enhance Cu solubilization. Thus, greater extractable Cu under NT can coexist with similar pseudo-total concentrations without implying an equivalent increase in plant uptake.
For Zn, the higher acid-soluble concentrations in fertilized treatments contrasted with the limited differentiation of mobile concentrations (Tables 2 and 4). This pattern is consistent with retention processes that restrict the transfer of Zn into the extracted mobile fraction. In a 38-year field experiment, Lair et al. [15] found that soil pH, organic matter, particle size, and mineral composition influenced metal retention and partitioning. Unlike the increased DTPA-extractable Zn reported by de Santiago et al. [16], mobile Zn in the present study showed little separation between tillage systems. Differences in soil properties, sampling depth, and extraction procedures provide reasonable explanations for this contrast.
Higher pseudo-total Cd under NT, alongside similar mobile concentrations, also has parallels in long-term tillage research. Düring et al. [14] reported increased aqua regia-extractable Cd in the 0–25 cm layer of a Eutric Cambisol under NT, together with near-surface enrichment of pollutants. Dubovik et al. [24] likewise documented vertical differentiation of trace elements in typical chernozem, with enrichment concentrated nearer the surface under direct sowing than under plowing. These studies identify retention and redistribution as plausible contributors to the Cd pattern observed here. However, redistribution within the sampled layer alone would not explain a higher layer-average concentration; differences in retention and metal inputs or losses must also be considered.
Interannual variation was evident across the metal profiles, particularly in the common increase in mobile Cd after 2020 (Figures 2 and 3). Differences in precipitation and temperature provide an environmental context for these changes (Figure 1). Hernández-Soriano et al. [28] found that metal solubility responded to moisture conditions and organic matter transformations, with lower mobility under saturation than at field capacity in their experiments. Hooda and Alloway [30] also examined redistribution among metal fractions during a two-year incubation of sludge-amended soils. These studies support moisture-dependent changes in soil chemistry as possible explanations for annual variation. The year factor nevertheless represents the combined conditions of each observation year rather than the separate contribution of rainfall or temperature.
The sensitivity of Cd can be interpreted through the competing effects of carbonate retention, solution chemistry, and pH. Davis et al. [31] demonstrated that calcite retains Cd through surface sorption followed by incorporation into mixed Cd–Ca carbonate solids. Conversely, Temminghoff et al. [32] showed in sandy soil that dissolved Ca competed with Cd for sorption sites and that decreasing pH reduced Cd retention. Calcium therefore has different roles depending on whether it occurs in a reactive carbonate surface or in soil solution. These opposing processes help explain why carbonate-rich soils can retain Cd while still exhibiting variation in its extractable concentration as chemical conditions change.
Redox processes provide a further comparison. Fulda et al. [33] found that reducing conditions in paddy soil promoted Cd-sulfide formation when sufficient sulfate was available, whereas reoxidation returned Cd to more soluble forms. Although flooded paddy conditions differ from the upland chernozem studied here, this finding illustrates why moisture-related changes in Cd mobility need not follow a single direction. Carbonate reactions, pH, competing ions, and redox conditions can favour different forms of Cd retention or release.
MF provides a complementary comparison of relative extractability. Its higher values for Cu under NT were consistent with the higher mobile Cu concentrations, whereas Zn MF remained low across treatments. Cd had the highest MF, at 27.14–37.70%, but this did not mean that most Cd occurred in the extracted mobile fraction. The lower Cd ratios under NT also reflected higher pseudo-total concentrations alongside similar mobile concentrations (Table 5; Figure 4). Meers et al. [34], comparing 13 extraction procedures across 28 soils, demonstrated that measured Cd extractability depends on the extractant and soil properties. Accordingly, MF should be interpreted as a method-specific ratio rather than a direct estimate of the proportion available for plant uptake.
Long-term studies further show that changes in metal extractability do not follow a universal aging pattern. Lu et al. [35] and Guo et al. [36] observed redistribution of added Cu towards more strongly retained fractions. McBride and Cai [37] also reported declining Cu and Zn extractability over a decade, although phytotoxicity persisted at high metal additions. In contrast, McGrath et al. [38] found no consistent decline in Zn and Cd extractability during 23 years after sludge application ceased. These contrasting outcomes indicate that soil properties, amendment history, and metal loading influence the persistence of extractable fractions. The differences observed in the present study therefore should not be assumed to disappear simply with increasing duration of NT management.
The distinction between soil extractability and crop response is also supported by studies of biosolid-amended soils. Black et al. [39] observed different temporal responses among free-ion activity, chemical extractions, and plant concentrations. Luo and Christie [40] reported increased Cu and Zn uptake associated with greater plant growth without corresponding increases in tissue concentrations, while studies by Ogbazghi et al. [41] and Kim et al. [42] highlighted the importance of water management and soil pH. For the present system, higher mobile Cu under NT therefore warrants comparison with crop Cu status rather than an immediate conclusion about improved nutrition. Combining consistent soil sampling with fraction-specific analysis and crop-tissue measurements would provide a stronger basis for micronutrient management and Cd monitoring than acid-soluble concentrations alone.
The three-year observations in carbonate chernozem of North Kazakhstan showed interannual variation in pseudo-total (acid-soluble) and mobile Cu, Zn, and Cd, particularly in mobile Cd. Differences between tillage and fertilization treatments were element-specific. Pseudo-total Cu and Zn concentrations were broadly comparable under CT and NT, whereas fertilized treatments had higher pseudo-total Zn means and NT had higher pseudo-total Cd. The clearest contrast between tillage systems concerned mobile Cu, whose concentration and MF were consistently higher under NT. Mobile Zn and Cd concentrations occupied overlapping ranges under the two systems.
These findings support the combined use of acid-soluble concentrations, mobile concentrations, and MF when monitoring agricultural soils. For land managers, particular attention should be given to mobile Cu under NT and to Cd, which had the highest mobile-to-pseudo-total ratio among the studied metals. Monitoring should use consistent sampling depths and comparable stages of the growing season. Decisions on Cu fertilization should combine soil measurements with crop-tissue analysis, while similar mobile Zn and Cd concentrations between tillage systems should not be treated as proof of environmental safety.
Composite sampling of the 0–20 cm layer may have obscured vertical stratification, particularly near-surface enrichment under NT. Future studies should distinguish the 0–10 and 10–20 cm layers and include deeper sampling to assess redistribution beyond the upper soil layer. The three-year observation period also limits conclusions about long-term accumulation and does not establish changes occurring immediately after the adoption of NT.
The soil characterization included pH and humus content but did not document their annual changes alongside metal concentrations. The Year factor therefore cannot separate the contributions of precipitation, temperature, and soil chemical conditions. Longer-term monitoring should combine metal measurements with soil moisture, organic carbon, pH, and CaCO₃. The two extraction procedures distinguished acid-soluble and mobile fractions but did not identify individual binding phases or directly measure plant uptake. Sequential fractionation, soil-solution analysis, and crop-tissue measurements would strengthen the interpretation of metal retention, mobility, and transfer to crops.
Also, no certified reference material was available, and this is acknowledged as a limitation.
The SE and ANOVA estimates were derived from digitized annual profiles and do not incorporate digitization uncertainty or variability among individual field plots. Retaining plot-level observations in subsequent analyses would improve estimates of treatment variability and allow repeated measurements from the same plots to be accounted for explicitly.
The research was carried out within the framework of program-targeted funding for the project "Development of sustainable farming system in a changing climate conditions for various soil and climatic zones of Kazakhstan," IRN BR22885719.
[1] Zamanian, K., Kuzyakov, Y. (2022). Soil inorganic carbon: Stocks, functions, losses and their consequences. In Understanding and Fostering Soil Carbon Sequestration. Burleigh Dodds Science Publishing, Cambridge, pp. 209-236. https://doi.org/10.19103/as.2022.0106.07
[2] Zharlygassov, Z., Kalimov, N., Ansabayeva, A., et al. (2025). Sustainable nutrient management and agricultural productivity in chernozem soils of the Kostanay Region, Kazakhstan. Eurasian Journal of Soil Science, 14(1): 98-106. https://doi.org/10.18393/ejss.1592633
[3] Kunanbayev, K., Churkina, G., Filonov, V., Utebayev, M., Rukavitsina, I. (2022). Influence of cultivation technology on the productivity of spring wheat and the humus state of southern carbonate soils of Northern Kazakhstan. Journal of Ecological Engineering, 23(3): 49-58. https://doi.org/10.12911/22998993/145459
[4] Tokseitova, G.A. (2008). Micromorphology of virgin and cultivated southern carbonate chernozems of Northern Kazakhstan. Soil Science and Agrochemistry, 2008(2): 36-42. https://journal.soil.kz/jour/article/view/96.
[5] Alloway, B.J. (2013). Sources of heavy metals and metalloids in soils. In Heavy Metals in Soils: Trace Metals and Metalloids in Soils and their Bioavailability, Springer, pp. 11-50. https://doi.org/10.1007/978-94-007-4470-7_2
[6] Simon, L. (2014). Potentially harmful elements in agricultural soils. In PHEs, Environment and Human Health. Springer, Dordrecht, pp. 85-150. https://doi.org/10.1007/978-94-017-8965-3_3
[7] Kumar, D., Malik, D.S., Patel, S.L., Gupta, V. (2019). Human health risk assessment and mitigation of heavy metal pollution in agriculture and environment. In Contaminants in Agriculture and Environment: Health Risks and Remediation, vol. 1. Agriculture and Environmental Science Academy, Haridwar, pp. 66-75. https://doi.org/10.26832/aesa-2019-cae-0157-06
[8] Wan, Y.N., Liu, J., Zhuang, Z., Wang, Q., Li, H.F. (2024). Heavy metals in agricultural soils: Sources, influencing factors, and remediation strategies. Toxics, 12(1): 63. https://doi.org/10.3390/toxics12010063
[9] Bajpai, S., Anil, E., Dixit, P.R., Pandey, N. (2025). Heavy metal accumulation in agricultural soils: Environmental risk assessment and remediation strategies. International Journal of Environmental Sciences, 11(19S): 3691-3698. https://doi.org/10.64252/s1wrkf59
[10] Rezapour, S., Kouhinezhad, P., Samadi, A. (2020). Trace metals toxicity in relation to long-term intensive agricultural production in a calcareous environment with different soil types. Natural Hazards, 100: 551-570. https://doi.org/10.1007/s11069-019-03825-8
[11] Bai, J., Li, W.Y., Zhang, Y.L., Xiao, L., Lu, W.S., Li, Y.T. (2018). Distributions and risks of Cu, Cd, Pb and Zn in soils and rice in the North River Basin, South China. Earth and Environmental Science Transactions of the Royal Society of Edinburgh, 109(3-4): 483-493. https://doi.org/10.1017/s1755691018000646
[12] Kim, R.Y., Yoon, J.K., Kim, T.S., Yang, J.E., Owens, G., Kim, K.R. (2015). Bioavailability of heavy metals in soils: Definitions and practical implementation—A critical review. Environmental Geochemistry and Health, 37: 1041-1061. https://doi.org/10.1007/s10653-015-9695-y
[13] Guo, G.L., Zhou, Q.X., Koval, P.V., Belogolova, G.A. (2006). Speciation distribution of Cd, Pb, Cu, and Zn in contaminated Phaeozem in north-east China using single and sequential extraction procedures. Australian Journal of Soil Research, 44(2): 135-142. https://doi.org/10.1071/sr05093
[14] Düring, R.A., Hoß, T., Gäth, S. (2002). Depth distribution and bioavailability of pollutants in long-term differently tilled soils. Soil and Tillage Research, 66(2): 183-195. https://doi.org/10.1016/s0167-1987(02)00026-0
[15] Lair, G.J., Gerzabek, M.H., Haberhauer, G. (2007). Retention of copper, cadmium and zinc in soil and its textural fractions influenced by long-term field management. European Journal of Soil Science, 58(5): 1145-1154. https://doi.org/10.1111/j.1365-2389.2007.00905.x
[16] de Santiago, A., Quintero, J.M., Delgado, A. (2008). Long-term effects of tillage on the availability of iron, copper, manganese, and zinc in a Spanish Vertisol. Soil and Tillage Research, 98(2): 200-207. https://doi.org/10.1016/j.still.2008.01.002
[17] Meena, P., Shrivastava, M., Shivay, Y.S., et al. (2025). Effect of conventional and organic agriculture on cadmium dynamics in rice–wheat cropping system on inceptisol. Asian Journal of Soil Science and Plant Nutrition, 11(3): 216-230. https://doi.org/10.9734/ajsspn/2025/v11i3565
[18] Ferreira, G.W., Lourenzi, C.R., Comin, J.J., et al. (2023). Effect of organic and mineral fertilizers applications in pasture and no-tillage system on crop yield, fractions and contaminant potential of Cu and Zn. Soil and Tillage Research, 225: 105523. https://doi.org/10.1016/j.still.2022.105523
[19] Islam, K.R., Ahsan, S., Barik, K., Aksakal, E.L. (2013). Biosolid impact on heavy metal accumulation and lability in soil under alternate-year no-till corn–soybean rotation. Water, Air, & Soil Pollution, 224: 1451. https://doi.org/10.1007/s11270-013-1451-2
[20] Patra, S.K., Sengupta, S., Das, S.S., Mazumdar, D. (2025). Assessment of the interaction of copper and zinc with cadmium to reduce its toxicity in heavy metal-contaminated river basin soils. Discover Soil, 2: 2. https://doi.org/10.1007/s44378-025-00030-x
[21] Ferreira, G.W., Bordallo, S.U., Giumbelli, L.D., et al. (2025). Chemical fractions of soil organic matter and their interactions with Cu, Zn and Mn in vineyards in southern Brazil. Agronomy, 15(8): 1937. https://doi.org/10.3390/agronomy15081937
[22] Dhaliwal, M.K., Dhaliwal, S.S. (2019). Impact of manure and fertilizers on chemical fractions of Zn and Cu in soil under rice-wheat cropping system. Journal of the Indian Society of Soil Science, 67(1): 85-91. https://doi.org/10.5958/0974-0228.2019.00009.4
[23] Zueva, N.B., Zhloba, L.D., Kunanbayev, K.K., Popolzukhina, N.A. (2022). Ecological assessment of the condition of the arable layer with the No-till technology on different types of soils of Northern Kazakhstan. Bulletin of L.N. Gumilyov Eurasian National University. Chemistry. Geography. Ecology Series, 1(138): 45-53. https://doi.org/10.32523/2616-6771-2022-138-1-45-52
[24] Dubovik, D.V., Dubovik, E.V., Shumakov, A.V., Ilyin, B.S. (2021). Content of trace elements in the soil of typical chernozem depending on methods of primary tillage. South of Russia: Ecology, Development, 16(3): 102-107. https://doi.org/10.18470/1992-1098-2021-3-102-107
[25] Zueva, N.B., Rukavitsina, I.V., Zhloba, L.D., Mamykin, E.V., Popolzukhina, N.A. (2023). The influence of cultivation technologies and mineral fertilizers application on the content of trace elements and soil microbiocenosis. Agrochemistry and Ecology Problems, (1): 15-22. https://doi.org/10.26178/AE.2023.79.69.003
[26] Federal Service for Hydrometeorology and Environmental Monitoring (Roshydromet). (2019). Mass fraction of acid-soluble forms of metals in soil, ground, and bottom sediment samples: Measurement procedure by atomic absorption spectrometry. Ministry of Natural Resources and Ecology of The Russian Federation. RD 52.18.191-2018. https://meganorm.ru/Data2/1/4293736/4293736070.htm.
[27] Ministry of Agriculture of the Russian Federation. (1992). Guidelines for the Determination of Heavy Metals in Agricultural Soils and Crop Products (2nd ed., revised and supplemented). CINAO, Moscow, Russia. https://meganorm.ru/Data2/1/4293771/4293771886.pdf.
[28] Hernández-Soriano, M.C., Peña, A., Mingorance, M.D. (2013). Soluble metal pool as affected by soil addition with organic inputs. Environmental Toxicology and Chemistry, 32(5): 1027-1032. https://doi.org/10.1002/etc.2159
[29] Lee, C.H., Chen, Z.S. (2010). The effects of compost-derived dissolved organic carbon on Cd, Zn, and Cu release from metal-spiked soils. Soil Science, 175(11): 552-561. https://doi.org/10.1097/ss.0b013e3181fba6d1
[30] Hooda, P.S., Alloway, B.J. (1994). Changes in operational fractions of trace metals in two soils during two-years of reaction time following sewage sludge treatment. International Journal of Environmental Analytical Chemistry, 57(4): 289-311. https://doi.org/10.1080/03067319408027462
[31] Davis, J.A., Fuller, C.C., Cook, A.D. (1987). A model for trace metal sorption processes at the calcite surface: Adsorption of Cd²⁺ and subsequent solid solution formation. Geochimica et Cosmochimica Acta, 51(6): 1477-1490. https://doi.org/10.1016/0016-7037(87)90330-9
[32] Temminghoff, E.J.M., van der Zee, S.E.A.T.M., de Haan, F.A.M. (1995). Speciation and calcium competition effects on cadmium sorption by sandy soil at various pHs. European Journal of Soil Science, 46(4): 649-655. https://doi.org/10.1111/j.1365-2389.1995.tb01361.x
[33] Fulda, B., Voegelin, A., Kretzschmar, R. (2013). Redox-controlled changes in cadmium solubility and solid-phase speciation in a paddy soil as affected by reducible sulfate and copper. Environmental Science & Technology, 47(22): 12775-12783. https://doi.org/10.1021/es401997d
[34] Meers, E., Du Laing, G., Unamuno, V., et al. (2007). Comparison of cadmium extractability from soils by commonly used single extraction protocols. Geoderma, 141(3-4): 247-259. https://doi.org/10.1016/j.geoderma.2007.06.002
[35] Lu, A.X., Zhang, S.Z., Qin, X.Y., Wu, W.Y., Liu, H.L. (2009). Aging effect on the mobility and bioavailability of copper in soil. Journal of Environmental Sciences, 21(2): 173-178. https://doi.org/10.1016/s1001-0742(08)62247-0
[36] Guo, G., Yuan, T., Wang, W., Li, D., Wang, J. (2011). Effect of aging on bioavailability of copper on the fluvo aquic soil. International Journal of Environmental Science and Technology, 8: 715-722. https://doi.org/10.1007/bf03326256
[37] McBride, M.B., Cai, M.F. (2016). Copper and zinc aging in soils for a decade: Changes in metal extractability and phytotoxicity. Environmental Chemistry, 13(1): 160-167. https://doi.org/10.1071/en15057
[38] McGrath, S.P., Zhao, F.J., Dunham, S.J., Crosland, A.R., Coleman, K. (2000). Long-term changes in the extractability and bioavailability of zinc and cadmium after sludge application. Journal of Environmental Quality, 29(3): 875-883. https://doi.org/10.2134/jeq2000.00472425002900030025x
[39] Black, A., McLaren, R.G., Reichman, S.M., Speir, T.W., Condron, L.M., Houliston, G. (2012). Metal bioavailability dynamics during a two-year trial using ryegrass (Lolium perenne L.) grown in soils treated with biosolids and metal salts. Soil Research, 50(4): 304-311. https://doi.org/10.1071/sr11315
[40] Luo, Y.M., Christie, P. (1997). Alkaline sewage sludge solids affect the chemical speciation and bioavailability of Cu and Zn in the rhizosphere soil solution. Soil Science and Plant Nutrition, 43(sup1): 1041-1046. https://doi.org/10.1080/00380768.1997.11863714
[41] Ogbazghi, Z.M., Tesfamariam, E.H., Annandale, J.G., De Jager, P.C. (2015). Mobility and uptake of zinc, cadmium, nickel, and lead in sludge-amended soils planted to dryland maize and irrigated maize–oat rotation. Journal of Environmental Quality, 44(2): 655-667. https://doi.org/10.2134/jeq2014.06.0261
[42] Kim, B., McBride, M.B., Richards, B.K., Steenhuis, T.S. (2007). The long-term effect of sludge application on Cu, Zn, and Mo behavior in soils and accumulation in soybean seeds. Plant and Soil, 299: 227-236. https://doi.org/10.1007/s11104-007-9377-3