Marthin Gunardhy | Ngakan Ketut Acwin Dwijendra* | I Dewa Gede Agung Diasana Putra | I Made Adhika
© 2026 The authors. This article is published by IIETA and is licensed under the CC BY 4.0 license (http://creativecommons.org/licenses/by/4.0/).
OPEN ACCESS
Hotels in hot-humid tourism regions rank among the most energy-intensive building types, largely because of sustained reliance on mechanical cooling. Balinese vernacular architecture, by contrast, embodies climate-responsive principles developed through long-term adaptation to the same climate: cross-ventilation, elevated and ventilated roof volumes, permeable envelopes of locally available materials, and open or courtyard-based spatial organization. This study translates those principles into explicit, measurable building-model inputs and evaluates them through scenario-based building performance simulation. A normalized tropical hotel prototype was modelled in DesignBuilder with the EnergyPlus calculation engine using representative weather data for southern Bali. Six runs were compared: a conventional baseline (P0); four single-variable runs isolating cross-ventilation (P1), elevated ventilated roof (P2), envelope material properties (P3), and spatial openness (P4); and a fully integrated vernacular package (P5). Geometry, occupancy, internal loads, and heating, ventilation, and air conditioning (HVAC) assumptions were held constant across runs, so that the marginal contribution of each variable could be separated from the combined package effect. The baseline produced an annual energy use intensity (EUI) of 650 kWh/m2/year. Reductions relative to the baseline were 8.3% for cross-ventilation, 10.9% for roof configuration, 14.9% for envelope materials, and 12.0% for spatial openness, while the integrated package achieved 38.0%. Occupied-zone air temperature fell from 30–32 degrees C to 26–28 degrees C. The sum of the single-variable reductions (46.1%) differed from the integrated result (38.0%) by 8.1 percentage points, indicating interaction among the variables. The contribution of this study is a transparent and reproducible procedure for converting vernacular environmental knowledge into testable design variables rather than treating it as a visual reference. Transfer to other tropical regions requires local weather data, envelope properties, and operating schedules.
Balinese architecture, building energy simulation, green hotel, hot-humid climate, passive cooling, vernacular design
The rapid expansion of the tourism industry in Bali has significantly increased demand for accommodation, particularly hotels and resorts. This growth has directly contributed to a substantial rise in energy consumption within the built environment, positioning the hospitality sector as one of the most energy-intensive industries in the region. Empirical studies indicate that hotels in tropical climates typically consume 450-700 kWh/m²/year, with more than 60% of total energy demand allocated to heating, ventilation, and air conditioning (HVAC) systems, particularly for cooling [1-3]. This high dependency on mechanical cooling systems not only increases operational costs but also intensifies carbon emissions, thereby exacerbating environmental degradation and contributing to global climate change [4].
In Bali, where tourism development continues to accelerate, the environmental implications of energy-intensive buildings are becoming increasingly critical [5]. The reliance on air conditioning systems reflects a design paradigm that prioritizes instant thermal comfort over environmental sustainability. While technological advancements in HVAC systems have improved efficiency, they remain inherently energy-dependent and often neglect the potential of passive environmental control strategies [6]. This condition highlights a fundamental contradiction between the goals of sustainable development and the prevailing architectural practices in the hospitality sector.
Conversely, traditional Balinese architecture embodies a long-established system of climate-responsive design that is inherently aligned with the principles of passive cooling [7, 8]. Rooted in local wisdom and environmental adaptation, this architectural tradition employs strategies such as cross-ventilation, elevated, ventilated roof structures, open spatial configurations, and locally sourced natural materials with favorable thermal properties [9, 10]. These elements collectively facilitate natural airflow, reduce heat accumulation, and maintain indoor thermal comfort without reliance on mechanical systems. Moreover, these strategies are not merely technical solutions but are deeply embedded within the philosophical framework of Tri Hita Karana, which emphasizes harmony between humans, nature, and the spiritual realm [11, 12].
Despite the recognized potential of vernacular architecture in promoting environmental sustainability, existing studies tend to treat traditional architectural knowledge and modern building performance analysis as separate domains [13, 14]. Research on vernacular architecture often focuses on cultural preservation, symbolic meaning, and spatial philosophy, while studies on building energy performance are predominantly grounded in modern technological approaches, frequently disregarding local cultural contexts. This disciplinary fragmentation has resulted in a lack of integrative frameworks that can systematically evaluate and quantify the performance of traditional architectural elements within contemporary building systems [15].
Furthermore, there is a notable absence of empirical models that bridge qualitative cultural insights with quantitative energy performance metrics [16, 17]. While some studies acknowledge the effectiveness of passive design strategies, few have rigorously assessed their impact through simulation-based approaches or translated them into a structured design model applicable to modern buildings, particularly in the hotel sector [18, 19]. This gap limits the practical implementation of vernacular principles in contemporary architectural practice and reduces their potential contribution to sustainable development.
In response to these challenges, this study aims to address the existing research gap by developing an integrative green building design model that combines Balinese vernacular architectural principles with modern passive cooling strategies. The present work extends the authors’ earlier field-measurement study [20], which reported a 32.4% reduction in energy use based on pre- and post-intervention metering across four hotel areas in Bali. That study, however, could not isolate the contribution of individual design variables; this paper addresses that limitation by reconstructing the same cases as building performance simulation models, enabling a one-factor-at-a-time decomposition of each vernacular element. Accordingly, this study addresses three research questions. RQ1: How can the environmental principles of Balinese vernacular architecture be translated into measurable design variables for hotel simulation? RQ2: What is the marginal energy and thermal contribution of each variable, and how does the sum of the single-variable effects compare with the fully integrated package? RQ3: How can the resulting evidence be synthesized into a culturally grounded, performance-based design framework for hotels in hot-humid climates? The research adopts a scenario-based simulation approach in which design elements derived from vernacular practice are expressed as model inputs and tested individually and in combination. By doing so, the study seeks to provide a simulation-evaluated framework that demonstrates how local architectural wisdom can be systematically adapted and optimized to improve energy efficiency in contemporary buildings.
The novelty of this research lies in its ability to synthesize cultural, environmental, and technological dimensions into a unified design model that is both contextually grounded and performance-driven [18, 21]. This integrative approach not only contributes to the theoretical advancement of sustainable architecture but also offers practical implications for architects, developers, and policymakers in designing energy-efficient, environmentally responsive, and culturally sensitive buildings in tropical regions.
2.1 Research design
This study adopts an evidence-informed, scenario-based building performance simulation design. It is not presented as a mixed-methods study: no new interview, survey, or occupant data are collected or reported here. The environmental principles that define the design variables are drawn from the literature on tropical passive cooling and from the authors’ previously published field investigation [20], which is cited as prior work rather than reproduced as new evidence. The measurable impact of those variables on thermal performance and energy use is then evaluated through simulation [22]. The field observations presented in this section summarize the observational evidence previously reported by the authors [20] and are included only to justify the selection of simulation variables rather than to introduce new empirical findings.
The study proceeds in three stages. The first translates vernacular environmental principles into explicit model inputs: operable opening configuration, roof height and ventilation, envelope thermal properties, orientation, shading, and spatial openness. The second isolates each variable in a separate simulation run and then combines them into an integrated package. The third interprets the energy and thermal outputs and synthesizes them into a performance-based design framework.
2.2 Derivation of design variables
This stage identifies and classifies the vernacular architectural elements that contribute to passive cooling performance, and establishes the cultural and physical rationale for selecting them as simulation variables.
1. Literature review
A comprehensive literature review was conducted to examine the principles of Balinese vernacular architecture, passive cooling strategies in tropical climates, and previous studies on sustainable and green building design. This process enables the identification of key architectural elements such as cross-ventilation, roof configuration, and material properties, while also positioning the research within existing scientific discourse [16, 17]. Furthermore, the literature review serves to establish the theoretical framework and clarify the research gap related to the lack of integration between vernacular knowledge and building performance analysis [13, 18].
2. Field observations
Field observations were conducted on both traditional Balinese compounds and contemporary hotel buildings to document the physical characteristics and environmental responses of each typology. The observations focused on spatial configurations, building orientation, ventilation systems, and material usage. Through this process, the study captures empirical evidence of how traditional architectural principles are implemented and identifies the extent to which these principles are adapted or neglected in modern buildings. This comparative observation provides a critical basis for understanding the practical relevance of vernacular strategies in current architectural contexts [8, 15].
3. Prior field evidence
Interviews with architects, building practitioners, and local cultural experts were conducted and reported in the authors’ earlier publication [20]. Those findings inform the selection of design variables in the present study but are not re-analyzed or presented here as new results. Readers are referred to study [20] for the interview procedure, participant characteristics, and qualitative findings.
2.3 Simulation phase
This stage evaluates the thermal and energy performance of the selected variables through simulation. It provides measurable evidence of how each vernacular design element influences building performance and is the stage at which the study departs from the authors’ earlier field investigation [20].
Table 1. Building model and simulation inputs
|
Category |
Parameter |
Value Used |
Source |
|
Software |
DesignBuilder version |
Version 7.3.2 |
Software record |
|
Software |
EnergyPlus version |
Version 23.2 |
Software record |
|
Weather |
EPW file name and station |
IDN_JW_Denpasar-Ngurah.Rai.Intl.AP.972300_TMYx.2011-2025.epw |
Denpasar / I Gusti Ngurah Rai, WMO 972300; climate.onebuilding.org |
|
Simulation |
Period |
1 Jan-31 Dec |
Model setting |
|
Simulation |
Timesteps per hour |
6 |
Model setting (EnergyPlus recommendation) |
|
Geometry |
Gross floor area (m²) |
18,500 |
Normalized prototype |
|
Geometry |
Conditioned floor area (m²) |
15,200 |
Normalized prototype |
|
Geometry |
Number of floors |
4 |
Normalized prototype |
|
Geometry |
Floor-to-floor height (m) |
4.20 |
Normalized prototype |
|
Geometry |
Number of thermal zones |
96 |
Model definition |
|
Openings |
Window-to-wall ratio by orientation (%) |
North 35%; South 40%; East 28%; West 25% |
Prototype model |
|
Envelope |
External wall construction and U-value (W/m²K) |
200 mm clay brick + internal plaster + external cement render; U = 2.20 W/m²K in the P0 baseline, reduced to 1.45 W/m²K in runs P3 and P5 |
Prototype envelope assembly; the modified assembly complies with SNI 6389:2020 Clause 4.1 (OTTV ≤ 35 W/m²) |
|
Envelope |
Roof construction and U-value (W/m²K) |
Ventilated clay-tile roof + gypsum ceiling; U = 1.60 W/m²K in the P0 baseline, reduced to 0.82 W/m²K with 50 mm insulation in runs P3 and P5 |
Prototype roof assembly; the modified assembly complies with SNI 6389: 2020 Clause 4.1 (RTTV ≤ 35 W/m²) |
|
Glazing |
U-value (W/m²K) / SHGC / visible transmittance |
3.10 / 0.42 / 0.60 |
Prototype glazing specification |
|
Air leakage |
Infiltration rate (ACH) |
0.60 ACH |
Literature-informed prototype assumption |
|
Occupancy |
Density (person/m²) and schedule |
0.028 person/m²; guestrooms operated continuously with 80% average annual occupancy; public areas active 06:00–23:00 |
Prototype operational profile |
|
Lighting |
Lighting power density (W/m²) |
8.0 |
Prototype operational profile |
|
Equipment |
Equipment power density (W/m²) |
12.0 |
Prototype operational profile |
|
HVAC |
System type and COP |
Variable Refrigerant Flow (VRF); COP = 3.60 |
Prototype HVAC specification |
|
HVAC |
Cooling setpoint (℃) and operating schedule |
Cooling setpoint: 24 ℃; setback: 27 ℃ during unoccupied periods; operation: 24 h/day with scheduled setback |
Operating schedule consistent with SNI 6390:2011 |
|
Ventilation |
Opening-control method and schedule |
Scheduled natural ventilation; openings enabled when occupied, outdoor air temperature = 22–30 ℃, indoor temperature >24 ℃, HVAC OFF, and adverse weather conditions absent |
Model setting |
|
Output |
Reported energy indicator |
Annual Building Energy Use Intensity (EUI), kWh/m²/year |
EnergyPlus output |
1. Simulation tools
Two widely recognized building performance simulation tools were employed, namely EnergyPlus [23] and DesignBuilder [24]. EnergyPlus was utilized for detailed energy modeling and thermal analysis, while DesignBuilder functioned as an interface for model development, visualization, and scenario testing. These tools enable accurate simulation of building performance under varying environmental conditions. The model was built in DesignBuilder version 7.3.2 using the EnergyPlus version 23.2 calculation engine, run over a full calendar year at six timesteps per hour using the IDN_JW_Denpasar-Ngurah.Rai.Intl.AP.972300_TMYx.2011-2025.epw weather file (Denpasar / I Gusti Ngurah Rai International Airport, WMO 972300; climate.onebuilding.org). Natural ventilation was represented using scheduled natural ventilation, with opening control governed by occupancy, outdoor air temperature 22–30 ℃, indoor temperature >24 ℃, and HVAC OFF during the ventilation period (see Table 1). The model was NOT calibrated against metered energy data, because no measured monthly consumption series was available for the case buildings. No claim of compliance with ASHRAE Guideline 14 is therefore made [25, 26]. The results should be read as relative differences between scenarios under identical assumptions, not as absolute predictions of operational energy use. The absolute baseline is compared only against published energy-use ranges for tropical hotels [1-3]. This limitation is stated again in Section 4.5. The full set of model inputs required to reproduce the study is given in Table 1.
The climatic boundary conditions applied in all six runs are those embedded in the weather file identified in Table 1. Table 2 reports the monthly statistics extracted directly from that file, so that the thermal environment driving the simulation is documented rather than described in general terms.
The file describes a persistently warm and humid maritime tropical climate with a narrow annual temperature amplitude and high year-round humidity. Cooling demand is therefore continuous rather than seasonal, and the temperature window governing the natural-ventilation control in Table 1 (22–30 ℃) is satisfied for a substantial share of annual hours. This is the condition against which the marginal contribution of each vernacular variable is evaluated.
Table 2. Monthly climate statistics extracted from the Denpasar-Ngurah Rai International Airport, WMO 972300 file
|
Month |
Mean Dry-Bulb (℃) |
Min / Max Dry-Bulb (℃) |
Mean RH (%) |
RH Range (%) |
Global Horizontal Radiation (kWh/m²/Day) |
Prevailing Wind Direction |
Mean Wind Speed (m/s) |
|
January |
27.94 |
23–32 |
81.29 |
59–100 |
5.43 |
260° (W) |
3.95 |
|
February |
27.97 |
22–33 |
82.54 |
56–100 |
5.55 |
260° (W) |
3.36 |
|
March |
28.21 |
24–32 |
79.95 |
59–100 |
5.75 |
260° (W) |
2.81 |
|
April |
28.29 |
23–32 |
80.75 |
59–100 |
5.58 |
110° (ESE) |
3.29 |
|
May |
28.01 |
25–31 |
92.28 |
63–100 |
5.29 |
110° (ESE) |
4.18 |
|
June |
27.47 |
24–32 |
86.43 |
63–100 |
4.89 |
120° (ESE) |
5.16 |
|
July |
26.80 |
24–30 |
88.42 |
55–100 |
5.02 |
110° (ESE) |
5.96 |
|
August |
26.43 |
20–29 |
76.31 |
51–94 |
5.71 |
120° (ESE) |
5.11 |
|
September |
26.57 |
22–31 |
78.72 |
55–94 |
6.39 |
100° (E) |
3.44 |
|
October |
27.57 |
22–32 |
80.79 |
62–94 |
6.88 |
120° (ESE) |
3.89 |
|
November |
28.24 |
25–34 |
80.85 |
59–100 |
6.36 |
100° (E) |
3.09 |
|
December |
28.30 |
23–32 |
79.93 |
62–100 |
5.58 |
260° (W) |
3.72 |
2. Simulation parameters
The simulation analysis focuses on two primary categories of performance indicators. The first is building energy performance, evaluated using annual Building Energy Use Intensity (EUI), annual cooling-energy use, total annual electricity consumption, cooling share of total electricity consumption, and peak cooling demand. The second is indoor thermal performance, evaluated using occupied-zone mean air temperature under representative warm operating conditions [27, 28].
Adaptive thermal-comfort compliance is not formally assessed in this study because the required variables, including operative temperature, prevailing mean outdoor temperature, air velocity, humidity, clothing insulation, metabolic rate, and occupied-hours compliance, were not evaluated as a complete comfort dataset. Similarly, room-scale air-velocity distribution is not reported because the annual EnergyPlus model does not provide spatially resolved airflow velocity fields without a separately documented computational fluid dynamics (CFD) analysis [29]. The present study therefore limits its thermal interpretation to indicators directly generated and supported by the building-performance simulation.
The six simulation scenarios were developed by systematically modifying the architectural variables identified in the preceding stage, first individually and then in combination, allowing their conditional marginal effects to be compared with the performance of the integrated package.
2.4 Study area
The study was conducted in four major tourism regions in Bali, each representing distinct microclimatic and morphological characteristics. Sanur, as a coastal area, is characterized by high humidity levels and the influence of sea breezes. Kuta represents an urban tourism zone with dense development and significant urban heat island effects. Ubud, located in a highland cultural area, features a cooler climate and a strong presence of traditional architectural forms. Nusa Dua, as a planned tourism zone, reflects controlled development with standardized building regulations [12, 30].
The selection of these locations enables a comparative analysis across diverse environmental conditions, thereby enhancing the robustness and generalizability of the proposed design model in different tropical contexts [31].
2.5 Research variables
This study defines variables based on the integration of vernacular architectural elements and building performance metrics to establish a clear relationship between design strategies and energy efficiency outcomes.
1. Independent variables (design variables)
The independent variables represent key elements derived from traditional Balinese architecture, including cross-ventilation configuration, roof height and geometry, building orientation, and the use of local materials. These variables are selected based on their relevance to passive cooling performance and are systematically manipulated within simulation scenarios in six simulation runs to evaluate their individual and combined effects on building performance [32, 33]. Run P0 is the conventional baseline. Runs P1–P4 each introduce one predefined design-strategy package relative to P0, while retaining the other packages at their baseline settings. Run P5 applies the complete integrated package. Because interaction between variables means the combined effect need not equal the sum of the individual effects, the single-variable results are interpreted as conditional sensitivities rather than universal causal contributions. The scenario definitions are given in Table 3.
Table 3. Definition of the six simulation runs
|
Design Variable |
P0 baseline Value |
Modified in Run |
P5 integrated Value |
|
Operable opening area (% of wall) |
15% |
P1 |
60% |
|
Opposing-opening alignment |
Not provided |
P1 |
Full cross-ventilation through opposing openings |
|
Natural-ventilation control schedule |
Disabled (mechanically cooled) |
P1 |
Scheduled natural ventilation when occupied, outdoor air temperature = 22–30 ℃, indoor temperature >24 ℃, HVAC OFF |
|
Occupied-space ceiling height (m) |
3.0 |
P2 |
4.2 |
|
Roof-ridge height (m) |
4.5 |
P2 |
7.5 |
|
High-level exhaust opening (m²) |
0.0 |
P2 |
2.5 |
|
Wall construction U-value (W/m²K) |
2.20 |
P3 |
1.45 |
|
Roof construction U-value (W/m²K) |
1.60 |
P3 |
0.82 |
|
Courtyard / open-space ratio (%) |
10 |
P4 |
38 |
|
External shading depth (m) |
0.60 |
P4 |
2.00 |
|
Building orientation (azimuth) |
30° (existing site orientation) |
P4 |
90° (East–west building axis aligned with prevailing wind) |
|
Occupancy, internal loads, HVAC |
Constant for all simulation runs |
None (held constant) |
As P0 |
The six runs were not selected arbitrarily. P1-P4 correspond to the four vernacular principles most consistently reported across the field precedents documented in Section 3.4 and the authors' earlier field study [20]: cross-ventilation through opposing openings, elevated ventilated roof volumes, envelope material properties, and courtyard-based spatial openness. Each was isolated in its own run so that its marginal contribution could be separated from the others, and P5 combines all four to test the integrated package actually promoted in vernacular practice. Other combinations (for example, pairwise interactions such as ventilation with roof design alone) were not simulated because a full factorial design across four two-level variables would require sixteen runs; the one-factor-at-a-time matrix was chosen as a tractable first step, and this trade-off is acknowledged as a limitation in Section 4.5. The P0–P5 values in Table 3 are drawn from the observed range across the four case regions in Section 3.3 (Sanur, Kuta, Ubud, Nusa Dua) rather than from a single building, so the prototype is representative of the range of conventional and vernacular practice observed across those regions rather than of any one specific hotel.
2. Dependent variables (performance indicators)
The dependent variables comprise measurable building-energy and indoor thermal-performance outcomes. Energy indicators include annual Building EUI, annual cooling-energy consumption, total annual electricity consumption, cooling share of total electricity use, and peak cooling demand. Indoor thermal performance is represented by occupied-zone mean air temperature under representative warm operating conditions. Formal adaptive-comfort compliance and room-scale air velocity are not treated as dependent variables because these require additional environmental and occupant-related inputs or CFD analysis beyond the scope of the present model.
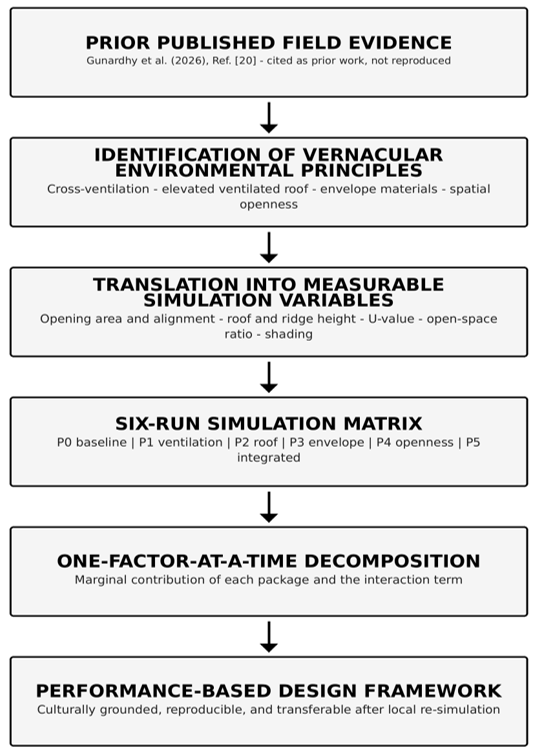
The research framework runs from prior published field evidence [20], through the identification of vernacular environmental principles, to their translation into measurable simulation variables, the six-run simulation matrix (P0–P5), and finally the synthesis of a performance-based design framework. The findings are then synthesized into a comprehensive design model that integrates vernacular architecture with passive cooling strategies. The complete methodological sequence is illustrated in Figure 1.
Figure 1. Research design: from prior published field evidence to the six-run simulation matrix and the resulting performance-based design framework
The results of this study demonstrate that the integration of Balinese vernacular architectural elements with passive cooling strategies significantly enhances building performance in tropical hotel contexts. The findings are structured to directly address the research questions concerning (1) the identification of vernacular elements functioning as passive cooling systems, (2) their quantitative impact on energy efficiency, and (3) the formulation of an effective integrative design model.
3.1 Energy reduction performance
The reported indicator is Annual Building EUI, per Table 1’s output row, expressed in kWh/m²/year and calculated as annual site energy divided by the gross floor area (18,500 m²). The same indicator is used throughout the manuscript. The conventional baseline (P0) produced an annual value of 650 kWh/m²/year, which falls within the published range for hotels in tropical climates [1-3]. The fully integrated vernacular package (P5) produced 403 kWh/m²/year, an absolute saving of 247 kWh/m²/year and a relative reduction of 38.0%. Single-variable results are reported in Table 4. The arithmetic sum of the four single-variable reductions is 46.1%, compared with 38.0% for the integrated package; the difference of 8.1 percentage points quantifies the interaction between variables. For context, a meta-analysis of 42 passive-cooling studies reports a mean saving of approximately 29% [16], and the authors' earlier field study reported 32.4% under occupied conditions [20]. Any divergence between the present simulated value and those figures is interpreted in Section 4.1.
The six runs are compared numerically in Table 4; no separate chart is presented, since a figure would reproduce the tabulated values without adding information. Each configuration was evaluated once using a deterministic simulation. No uncertainty intervals are reported because input and model uncertainty were not quantified; the reported differences are conditional on the specified model inputs and assumptions.
Beyond whole-building EUI, the end-use and peak-demand outputs of the same model are reported in Table 5, so that the source of the reduction can be attributed rather than inferred. Total electricity use is the whole-building annual site electricity of each run; cooling energy use is the Cooling end-use component of that total; and peak cooling load is the maximum coincident cooling demand over the annual run. Peak cooling-load intensity is normalized by the conditioned floor area of 15,200 m².
The reduction is attributable to the combined optimization of natural ventilation, thermal buffering through roof design, and reduced heat gain through material selection [9, 32]. The relative weight of each contribution is quantified in Table 6 rather than asserted qualitatively. The results confirm that passive strategies derived from traditional Balinese architecture can significantly decrease reliance on mechanical cooling systems.
Table 4. One-factor-at-a-time simulation results
|
Run |
Configuration |
EUI (kWh/m²/yr) |
Saving (kWh/m²/yr) |
Reduction (%) |
|
P0 |
Conventional baseline |
650 |
0 |
0.0 |
|
P1 |
Baseline + cross-ventilation only |
596 |
54 |
8.3 |
|
P2 |
Baseline + elevated ventilated roof only |
579 |
71 |
10.9 |
|
P3 |
Baseline + envelope material modification only |
553 |
97 |
14.9 |
|
P4 |
Baseline + spatial openness only |
572 |
78 |
12.0 |
|
P5 |
Complete integrated vernacular package |
403 |
247 |
38.0 |
|
|
Sum of P1–P4 (Interaction effect) |
– |
300 |
46.1 |
Table 5. Disaggregated annual simulation outputs for each simulation run
|
Run |
Configuration |
Cooling Energy Use (kWh/yr) |
Cooling Energy Use (kWh/m²/yr) |
Cooling Share of Total (%) |
Total Electricity Use (kWh/yr) |
Peak Cooling Load (kW) |
Peak Cooling Load per Conditioned Floor Area (W/m²) |
|
P0 |
Conventional baseline |
8,785,000 |
474.86 |
73.06 |
12,025,000 |
1,780 |
117.1 |
|
P1 |
Baseline + cross-ventilation only |
7,786,000 |
420.86 |
70.62 |
11,026,000 |
1,630 |
107.2 |
|
P2 |
Baseline + elevated ventilated roof only |
7,471,500 |
403.86 |
69.70 |
10,711,500 |
1,590 |
104.6 |
|
P3 |
Baseline + envelope material modification only |
6,990,500 |
377.86 |
68.33 |
10,230,500 |
1,470 |
96.7 |
|
P4 |
Baseline + spatial openness only |
7,342,000 |
396.86 |
69.39 |
10,582,000 |
1,520 |
100.0 |
|
P5 |
Complete integrated vernacular package |
4,215,500 |
227.86 |
56.55 |
7,455,500 |
1,190 |
78.3 |
Table 6. Energy reduction comparison
|
Building Design Approach |
Energy Consumption (kWh/m²/Year) |
Energy Reduction (%) |
Performance Level |
|
Conventional Building |
650 |
– |
P0 baseline |
|
Mean of single-package scenarios (P1–P4) |
575 |
11.5 |
Descriptive mean; not an independently simulated scenario |
|
Vernacular Integrated Design |
403 |
38.0 |
P5 integrated package |
Cooling accounts for the dominant share of total electricity in every run. This share sits at the upper end of the range commonly reported for tropical hotels because the prototype applies a 24 ℃ cooling setpoint operated continuously in a climate without a heating season, so the cooling plant is never idle for a full day. Within the model outputs, the reduction achieved by the integrated package is entirely attributed to cooling energy: total electricity falls by 4,569,500 kWh/yr between P0 and P5, and cooling energy decreases by the same amount. Peak cooling load falls from 1,780 kW to 1,190 kW, a reduction of 33.1%. This indicates that the passive package reduces plant sizing requirements as well as annual consumption, which whole-building EUI alone does not reveal.
3.2 Thermal comfort improvement
The integrated scenario also lowered occupied-zone air temperature. The baseline produced 30–32 ℃ and the integrated scenario 26–28 ℃, a difference of approximately 2–6 ℃ depending on orientation and ventilation configuration. The reported temperatures represent occupied-zone mean air temperatures during representative warm operating conditions extracted from the annual simulation output.
This is reported as an improvement in indoor thermal conditions, not as demonstrated compliance with an adaptive comfort standard: such a claim would additionally require operative temperature, prevailing mean outdoor temperature, air speed, humidity, metabolic rate, clothing insulation, and the percentage of occupied hours within the applicable limits [28, 34].
Room-scale air velocity is not reported. The annual EnergyPlus model evaluates zone-level airflow rates and energy balance; it does not produce a spatially resolved velocity field. Reporting a peak indoor air speed would require a separately documented CFD analysis with stated domain, mesh, boundary conditions, and convergence criteria [29]. Such an analysis is identified in Section 4.5 as future work.
These findings indicate that the passive design package reduces simulated energy use and lowers indoor air temperature. Whether that translates into occupant comfort without mechanical assistance is not established by this model. Table 7 summarizes the indoor thermal indicators directly supported by the simulation outputs.
Table 7. Thermal comfort performance
|
Parameter |
Conventional |
Vernacular Integrated |
|
Indoor Temperature (℃) |
30–32 |
26–28 |
|
Occupied-zone air velocity (m/s) |
not modelled |
not modelled |
|
Adaptive comfort compliance |
not assessed |
not assessed |
3.3 Key vernacular design elements
The study identifies several key architectural elements that significantly influence passive cooling performance. These elements were derived from previously documented Balinese vernacular evidence and supporting literature and were subsequently evaluated through the quantitative simulation framework applied in the present study. Table 8 summarizes the simulation representation and marginal reduction associated with each design element.
Table 8. Influence of design elements
|
Design Element |
Simulation Representation |
Marginal Reduction (%) |
|
Cross ventilation |
Operable opening area, alignment, ventilation schedule |
8.3 (run P1) |
|
Roof height and stack effect |
Ridge height, high-level exhaust opening, roof U-value |
10.9 (run P2) |
|
Local materials |
Layer conductivity, density, specific heat, assembly U-value |
14.9 (run P3) |
|
Spatial openness |
Courtyard / open-space ratio, external shading depth |
12.0 (run P4) |
1. Cross ventilation
Cross-ventilation establishes pressure-driven airflow paths between openings on opposing facades. Its marginal contribution in this model is 8.3% (run P1, Table 4); whether it ranks first among the four variables follows from that table rather than from prior assumption [10, 29]. In this dataset, it does not rank first; material selection (P3, 14.9%) and roof configuration (P2, 10.9%) both show larger marginal contributions.
2. Roof height and stack effect
Elevated roof volumes act as thermal buffers, increasing the separation between occupied zones and solar-heated roof surfaces and, where high-level outlets exist, supporting buoyancy-driven extraction. Marginal contribution in this model: 10.9% (run P2, Table 4) [9, 29].
3. Local material utilization
Envelope materials are represented by measurable thermo-physical properties, not by cultural designation: thickness, thermal conductivity, density, specific heat, surface absorptance, and assembly U-value. A material is not treated as thermally superior merely because it is local or natural. Marginal contribution in this model: 14.9% (run P3, Table 4) [9, 33], the largest single-variable contribution recorded.
4. Spatial openness
Open and courtyard-based spatial configurations support airflow continuity and provide shaded transitional space. Marginal contribution in this model: 12.0% (run P4, Table 4) [34, 35].
3.4 Field documentation of vernacular elements
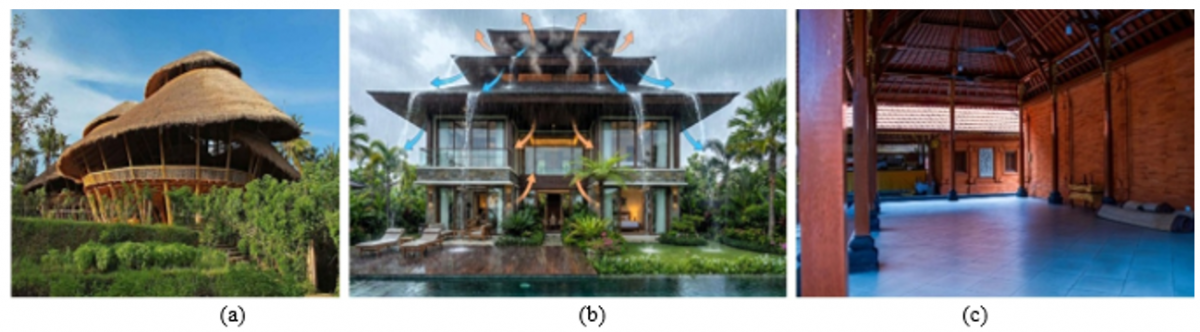
The field observations presented in Figure 2 document the principal Balinese vernacular architectural elements that informed the development of the normalized simulation prototype. Figure 2(a) illustrates an open pavilion with opposing openings that promotes wind-driven cross-ventilation; Figure 2(b) shows an elevated roof volume incorporating high-level ventilation to facilitate buoyancy-driven heat removal; and Figure 2(c) presents the use of locally sourced envelope materials together with shaded transitional spaces that reduce solar heat gain while improving the thermal performance of the building envelope.
3.5 Synthesis toward design model
The integration of prior field evidence, vernacular architectural knowledge, and the quantitative simulation findings leads to the formulation of a performance-based design approach. The results demonstrate that vernacular architectural elements can be translated from culturally grounded design principles into measurable variables whose environmental performance can be systematically evaluated.
The findings indicate that principles drawn from Balinese vernacular architecture, when expressed as explicit model inputs, improve simulated building energy performance in a hot-humid climate [16, 18]. This section discusses the implications of these findings in relation to the research questions, existing literature, and the development of a simulation-based integrative design framework.
4.1 Vernacular architecture as a passive cooling system
The first research question concerns the identification of vernacular architectural elements that function as passive cooling systems. The results confirm that elements such as cross ventilation, elevated roof structures, spatial openness, and local material utilization are not only culturally embedded but also perform effectively as climate-responsive design strategies [7, 8].
It is fair to ask whether these four variables are distinctively Balinese or simply generic passive-design strategies that happen to appear in Bali. The individual mechanisms - cross-ventilation, elevated roofs, low-conductance envelopes, and courtyard openness-are indeed used in passive design worldwide and are not unique to Bali in isolation. What is specific to the Balinese case, and is carried into the scenario-specific simulation inputs in Table 3, is (i) the particular combination and proportioning of these elements as codified in vernacular built form - for example the ratio of open pavilion (bale) to enclosed space, the roof-ridge height relative to occupied-zone height that produces the stack effect described in Section 3.3, and the natah (central courtyard) as an organizing spatial principle rather than an incidental gap between buildings-and (ii) the cultural rationale of Tri Hita Karana that determines why these forms were combined in this way rather than another. The contribution claimed here is therefore the translation of that specific combination and its underlying rationale into testable simulation variables, not the discovery of passive-cooling mechanisms that are novel in a physical sense.
Unlike modern buildings that rely heavily on mechanical air conditioning systems, traditional Balinese architecture demonstrates a deep understanding of environmental adaptation. The use of open pavilions (bale), central courtyards (natah), and permeable building envelopes allows for continuous airflow and heat dissipation. This indicates that vernacular architecture operates as an integrated environmental system rather than a collection of isolated design features [13, 35].
4.2 Quantified contribution of individual design variables
RQ2 concerns the marginal contribution of each design variable to the overall reduction in annual building EUI. The single-variable simulation runs yielded reductions of 8.3% for cross ventilation, 10.9% for elevated roof design, 14.9% for envelope material improvement, and 12.0% for spatial openness, compared with an overall reduction of 38.0% achieved by the fully integrated vernacular design package [16, 20]. The arithmetic sum of the individual reductions (46.1%) exceeds the integrated reduction by 8.1 percentage points, indicating that the passive strategies interact rather than contribute independently. This interaction arises because multiple design interventions simultaneously reduce the same sources of heat gain and cooling demand, resulting in diminishing incremental benefits when combined.
This finding is consistent with previous studies highlighting the effectiveness of passive cooling strategies in reducing building energy demand; however, the present study extends the existing literature by quantifying the individual contribution of each vernacular design element within a unified simulation framework. Unlike earlier investigations that primarily reported overall performance improvements or relied on qualitative interpretation, this study decomposes the contribution of cross ventilation, roof configuration, envelope materials, and spatial openness before evaluating their combined performance within a normalized Balinese hotel prototype. This methodological approach provides a clearer understanding of how individual passive strategies interact and offers a more reproducible basis for climate-responsive hotel design in tropical regions [18, 21, 36].
Table 9. Contextual comparison with selected previous studies
|
Study |
Context and Method |
Principal Result |
Comparability with Present Study |
|
[16] |
Systematic review of passive design studies in hot climates |
Approximately 29% mean energy savings across heterogeneous studies |
Broad contextual benchmark; different building types, climates, tools, and baselines |
|
[18] |
Vernacular Rowshan element; hot-dry residential context in Jeddah; simulation and CFD |
Reported room-scale thermal improvement |
Demonstrates measurable vernacular thermal benefits, but not directly comparable with whole-building hotel EUI |
|
[20] |
Balinese hotel field study under occupied conditions |
32.4% measured energy reduction |
Closest contextual comparator, but based on field measurements rather than standardized simulation |
|
Present study |
Normalized Balinese hotel prototype; DesignBuilder–EnergyPlus; P0–P5 scenario simulation |
38.0% simulated EUI reduction for the integrated package |
Controlled simulation result under fixed assumptions |
Table 9 provides contextual benchmarks rather than directly comparable estimates of energy savings. The meta-analysis in reference [16] pools residential buildings across multiple hot climates rather than hotels specifically, and reports a mean saving averaged across heterogeneous simulation tools, climates, and baseline definitions, so its ~29% figure is a broad benchmark rather than a like-for-like comparator. Reference [18] evaluates a single vernacular element (the rowshan screen) in a hot-dry residential context in Jeddah using coupled building-performance simulation and CFD at room scale, reporting indoor air temperature reductions of 15–22% rather than a whole-building EUI reduction; it is included as evidence that vernacular elements produce measurable thermal benefit in other climates, not as a numerically comparable result. Reference [20] is the authors' own prior field-metered study of the same building type and climate, and is the most directly comparable entry, though it reports an occupied-building metered saving (32.4%) rather than a simulated one. None of the three comparators shares building type, climate, simulation tool, and baseline definition simultaneously with the present study, so Table 9 should be read as contextual positioning rather than as a controlled benchmark.
4.3 Integration of culture and technology
The third research question focuses on how to formulate an effective integrative design model. The findings demonstrate that vernacular architectural principles can be transformed into a simulation-evaluated design framework that bridges the gap between cultural heritage and modern sustainability requirements [11, 14, 18].
This integration represents a paradigm shift in architectural design, where local wisdom is no longer treated as a symbolic or aesthetic element but as a functional and measurable performance strategy. The study shows that cultural architecture can be operationalized through simulation tools, enabling its adaptation in contemporary building design [15, 25].
This model illustrates how traditional architectural knowledge is translated into measurable performance outcomes and integrated into modern building design. It serves as a guideline for developing sustainable buildings that are both environmentally efficient and culturally responsive.
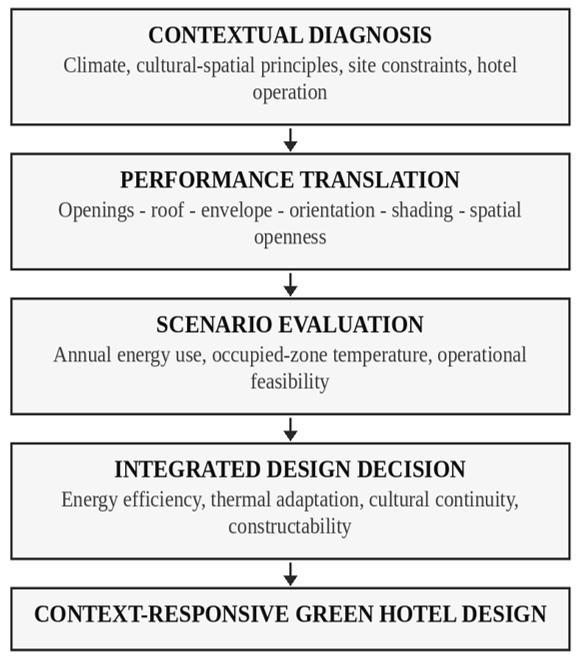
The relationships summarized in Table 10 are set out as an operational sequence in Figure 3. The framework traces the path from vernacular environmental principle, through its expression as a measurable model input, to the simulated performance outcome, and finally to the design decision it supports. Read in this direction, the framework is not a claim that vernacular form is inherently efficient; it is a procedure by which such a claim can be tested for any given element, climate file, and building program.
Table 10. Integration framework
|
Dimension |
Traditional Approach |
Integrated Model |
|
Design Basis |
Cultural/Philosophical |
Cultural + Scientific |
|
Cooling Strategy |
Natural Ventilation |
Optimized Passive System |
|
Performance Measure |
Qualitative |
Quantitative Simulation |
|
Outcome |
Comfort |
Comfort + Energy Efficiency |
4.4 Implication for sustainable architecture in tropical regions
The framework may be relevant beyond Bali, but the results are not transferable as they stand. Applying it elsewhere requires local weather files, envelope properties, occupancy patterns, and operating schedules, followed by re-simulation; the percentages reported here should not be carried over to other tropical settings [31, 37].
From a practical perspective, this approach provides architects and developers with a context-sensitive design strategy that is both environmentally and culturally sustainable. From a theoretical perspective, the study contributes to the development of a new framework that combines vernacular knowledge, environmental performance, and technological validation [38, 39].
4.5 Limitations
This study has six limitations that bound the interpretation of its results. First, the model was not calibrated against metered energy data; no measured monthly consumption series was available, so no ASHRAE Guideline 14 compliance is claimed and the absolute values should not be read as predictions of operational energy use [25, 26]. Second, the analysis is confined to a single climate context in southern Bali and one hotel typology; the reported percentages are not transferable to other tropical regions without re-simulation. Third, deterministic occupancy, equipment, and opening schedules do not represent the variability of real hotel operation, and simulated savings therefore tend to exceed those achieved in occupied buildings. Fourth, the one-factor-at-a-time design estimates conditional sensitivities under a fixed baseline; it does not capture the full interaction structure that a global sensitivity analysis would reveal. Fifth, room-scale airflow velocity was not modelled, so claims about perceived air movement are outside the scope of these results. Sixth, embodied carbon, life-cycle cost, moisture risk, acoustic performance, fire safety, and long-term durability were not assessed, and a design that performs well on operational energy may not perform well on those criteria.
Future work should therefore prioritize: monthly metering of the case buildings to permit formal calibration; global sensitivity analysis across the full parameter space; CFD for occupied-zone airflow; and life-cycle assessment and cost analysis to test whether operational savings survive a whole-life accounting.
The end-use and peak-demand figures in Table 5 are model outputs, not measurements. Because the model was not calibrated against metered consumption, the disaggregation should be read as an internally consistent attribution of the simulated reduction across end uses, not as a validated account of how energy is actually used in the case buildings.
5.1 Summary of findings
This study develops an integrative green building design model that combines Balinese vernacular architectural principles with passive cooling strategies to improve energy efficiency and thermal conditions in tropical hotel buildings. The findings demonstrate that traditional architectural elements-cross ventilation, elevated roof structures, spatial openness, and the use of local materials-are not only culturally significant but also function as measurable passive environmental control strategies within the simulated prototype.
Through a one-factor-at-a-time simulation design, this study separates the marginal contribution of each design variable from the effect of the integrated package. Simulation results indicate that the integrated vernacular passive design package reduced modelled energy use by 38.0% relative to the conventional baseline, that the reduction is entirely attributable to the cooling end use within the model’s end-use accounting, and that occupied-zone air temperature fell from 30–32 ℃ to 26–28 ℃. These outcomes address the research objectives set out in Section 1.
5.2 Theoretical contributions
From a theoretical perspective, this study contributes to sustainable architecture by proposing a framework that connects vernacular architectural knowledge with building performance science. Unlike work that treats cultural analysis and technical evaluation as separate exercises, this research demonstrates that vernacular architecture can be translated into quantifiable design variables and evaluated using simulation-based methods, as set out in Sections 2 and 4.
The study introduces an integrative position in which cultural principles such as environmental harmony and spatial adaptation are reinterpreted as performance-driven design strategies. This supports a more holistic understanding of sustainability, in which cultural identity and environmental performance are treated as complementary rather than separate dimensions.
5.3 Practical implications
The proposed design model provides an applicable framework for architects, developers, and policymakers designing energy-efficient buildings in tropical regions. By incorporating passive cooling strategies derived from local architectural traditions, the model offers a route to reducing energy consumption and operational expenditure in the hospitality sector, subject to the calibration limitations stated in Section 4.5.
The model also supports the retention of local identity by encouraging the use of traditional architectural elements in contemporary design. This is particularly relevant in regions such as Bali, where tourism development has tended towards the homogenization of architectural form. The approach presented here indicates that efficiency measures need not come at the cost of cultural specificity.
5.4 Transferability to other tropical regions
The framework, not the numerical result, is what may transfer. The principles of passive cooling and climate-responsive design are potentially applicable to other tropical regions, but only after re-simulation against local climate data, building stock, and operating practice, as discussed in Section 4.4. The study was conducted for a single climate context, and its percentages should not be generalised.
The model provides a flexible structure that can be adapted to other contexts by adjusting variables such as building orientation, material selection, and ventilation strategy. This adaptability extends the relevance of the study beyond its immediate setting.
5.5 Integrative design model
The final outcome of this research is an integrative design model that links vernacular architectural principles, passive cooling strategies, and performance-based evaluation into a single procedure. The model, set out in the Discussion, converts each vernacular principle into a measurable simulation input, evaluates it against a fixed baseline, and returns a quantified contribution that can be weighed against other design decisions. Its value lies in being repeatable: applied to a different climate file, building type, or set of operating assumptions, the same procedure yields a different but equally testable answer.
5.6 Final statement
This study argues that sustainable architecture should not rely solely on technological solutions but should also treat local environmental knowledge as a testable design resource. The integration of vernacular architecture and passive cooling strategies offers a balanced approach that addresses environmental performance while retaining cultural identity. The contribution is procedural as much as substantive: it shows how culturally embedded architectural knowledge can be converted into variables that a building performance model can test, so that claims about vernacular architecture become falsifiable rather than assertive.
The authors would like to express their sincere gratitude to Universitas Udayana for providing academic support, research facilities, and an enabling environment for the completion of this study. The authors also extend their appreciation to the Doctoral Program in Engineering, Faculty of Engineering, for their continuous guidance and institutional support throughout the research process.
Special thanks are addressed to the architects, building practitioners, and local cultural experts whose insights informed the identification of vernacular design principles and the selection of variables in the present work.
The authors further acknowledge the contribution of all parties involved in data collection, field observations, and simulation processes, including technical assistants and research collaborators. Their support has been instrumental in ensuring the accuracy and reliability of the research findings.
Finally, the authors would like to express their appreciation to colleagues and academic peers who provided constructive feedback and critical discussions during the development of this manuscript.
This study is simulation-based and involved no new recruitment of human participants or collection of participant data. No original participant-level data were reanalyzed, and no personally identifiable information is reported.
AI-based language tools were used only for grammar checking, language clarity, and formatting. The authors designed the study, verified the simulation inputs and outputs, interpreted the findings, and approved the final manuscript. The authors accept full responsibility for the accuracy, originality, and integrity of the work.
[1] Nasrullah, N., Hamdy, M.A. (2024). Air conditioning energy efficiency and thermal comfort in hotel buildings in hot and humid tropical climates. Engineering, Technology & Applied Science Research, 14(6): 18290-18299. https://doi.org/10.48084/etasr.8463
[2] Riantini, L.S., Machfudiyanto, R.A., Rachmawati, T.S.N., Rachman, M.D.A., Fachrizal, R., Shadram, F. (2024). Energy efficiency analysis of building envelope renovation and photovoltaic system in a high-rise hotel building in Indonesia. Buildings, 14(6): 1646. https://doi.org/10.3390/buildings14061646
[3] Balbis Morejón, M., Cabello Justafré, O., Cabello Eras, J.J., Rey-Hernández, J.M., Rey-Martínez, F.J. (2025). Energy optimization gaps in hotel retrofits for subtropical climates. Sustainability, 17(11): 5167. https://doi.org/10.3390/su17115167
[4] Chung-Camargo, K., González, J., Chen Austin, M., Carpino, C., Mora, D., Arcuri, N. (2024). Advances in retrofitting strategies for energy efficiency in tropical climates: A systematic review and analysis. Buildings, 14(6): 1633. https://doi.org/10.3390/buildings14061633
[5] Putra, I.W.Y.A., Adhika, I.M., Dwijendra, N.K.A., Putra, I.D.G.A.D. (2025). Balancing tradition and innovation: Energy-efficient hospitality architecture in Bali's growing tourism landscape. ASTONJADRO, 14(4): 1116-1121.
[6] Santamouris, M. (2016). Cooling the buildings-past, present and future. Energy and Buildings, 128: 617-638. https://doi.org/10.1016/j.enbuild.2016.07.034
[7] Hermawan, H., Švajlenka, J. (2021). The connection between architectural elements and adaptive thermal comfort of tropical vernacular houses in mountain and beach locations. Energies, 14(21): 7427. https://doi.org/10.3390/en14217427
[8] Angkasa, Z., Kamil, E.M. (2024). Passive cooling in Indonesian traditional dwellings and its relationship with geographical location. Journal of Design and Built Environment, 24(1): 1-16. https://doi.org/10.22452/jdbe.vol24no1.1
[9] Kindangen, J.I., Rogi, O.H.A., Rompas, L.M. (2024). Using Metroxylon sagu leaves as a roof material for thermal comfort in humid tropical buildings. Results in Engineering, 22: 101999. https://doi.org/10.1016/j.rineng.2024.101999
[10] Iqbal, M., Atthaillah, Nayan, A., Indriani, L. (2025). The effect of openings type on indoor temperature of naturally ventilated buildings in the tropical climate. Journal of Applied Science and Engineering, 28(8): 1769-1777. https://doi.org/10.6180/jase.202508_28(8).0014
[11] Utami, N.W.A., Adhika, I.M., Dwijendra, N.K.A., Putra, I.D.G.A.D. (2025). Integration of cultural and ecological aspects in the selection of sustainable materials for traditional balinese architecture. ASTONJADRO, 14(4): 1138-1142.
[12] Geria, I.M., Nastiti, T.S., Handini, R., et al. (2023). Built environment from the ancient Bali: The balinese heritage for sustainable water management. Heliyon, 9(11): e21248. https://doi.org/10.1016/j.heliyon.2023.e21248
[13] Moscoso-García, P., Quesada-Molina, F. (2023). Analysis of passive strategies in traditional vernacular architecture. Buildings, 13(8): 1984. https://doi.org/10.3390/buildings13081984
[14] Paturusi, S.A., Widiastuti. (2023). Traditional balinese architecture as a tourist attraction in Bali: An architect's perspective. ASTONJADRO, 12(3): 897-906. https://doi.org/10.32832/astonjadro.v12i3.14321
[15] Aritama, A.A.N., Laskara, G.W., Satria, M.W. (2022). Identification of green architectural characteristics of Tenganan Pegringsingan Village, Karangasem, Bali. ASTONJADRO, 11(2): 458-467. https://doi.org/10.32832/astonjadro.v11i2.6770
[16] Hu, M., Zhang, K., Nguyen, Q., Tasdizen, T. (2023). The effects of passive design on indoor thermal comfort and energy savings for residential buildings in hot climates: A systematic review. Urban Climate, 49: 101466. https://doi.org/10.1016/j.uclim.2023.101466
[17] Nagasue, M., Kitagawa, H., Asawa, T., Kubota, T. (2024). A systematic review of passive cooling methods in hot and humid climates using a text mining-based bibliometric approach. Sustainability, 16(4): 1420. https://doi.org/10.3390/su16041420
[18] Mezaien, A.A., Baltazar, J.C. (2024). Potential regenerative impact of implementation of cultural vernacular elements (Rowshan) in Jeddah, Saudi Arabia. Energies, 17(9): 1995. https://doi.org/10.3390/en17091995
[19] Gamero-Salinas, J.C., Monge-Barrio, A., Kishnani, N., López-Fidalgo, J., Sánchez-Ostiz, A. (2021). Passive cooling design strategies as adaptation measures for lowering the indoor overheating risk in tropical climates. Energy and Buildings, 252: 111417. https://doi.org/10.1016/j.enbuild.2021.111417
[20] Gunardhy, M., Putra, I.D.G.A.D., Dwijendra, N.K.A., Adhika, I.M. (2026). Green hotel design model: Integration of balinese architecture and passive cooling systems. ASTONJADRO, 15(1): 197-205.
[21] Xi, T.Y., Sa'ad, S.U., Liu, X.Y., Sun, H.B., Wang, M., Guo, F. (2025). Optimization of residential indoor thermal environment by passive design and mechanical ventilation in tropical savanna climate zone in Nigeria, Africa. Energies, 18(3): 450. https://doi.org/10.3390/en18030450
[22] Nguyen, A.T., Reiter, S., Rigo, P. (2014). A review on simulation-based optimization methods applied to building performance analysis. Applied Energy, 113: 1043-1058. https://doi.org/10.1016/j.apenergy.2013.08.061
[23] Crawley, D.B., Lawrie, L.K., Winkelmann, F.C., et al. (2001). EnergyPlus: Creating a new-generation building energy simulation program. Energy and Buildings, 33(4): 319-331. https://doi.org/10.1016/S0378-7788(00)00114-6
[24] DesignBuilder Software Ltd. (2026). Simulation Made Easy. https://www.designbuilder.co.uk.
[25] Tomrukcu, G., Kizildag, H., Avgan, G., et al. (2026). A systematic approach to manual calibration and validation of building energy simulation. Smart and Sustainable Built Environment, 15(1): 203-230. https://doi.org/10.1108/SASBE-10-2023-0296
[26] ASHRAE. (2023). ASHRAE Guideline 14-2023: Measurement of energy, demand, and water savings. https://webstore.ansi.org/standards/ashrae/ashraeguideline142023.
[27] Szokolay, S.V. (2014). Introduction to Architectural Science: The Basis of Sustainable Design. Routledge, London, UK. https://www.routledge.com/Introduction-to-Architectural-Science-The-Basis-of-Sustainable-Design/Szokolay/p/book/9780415824989.
[28] Kajjoba, D., Wesonga, R., Lwanyaga, J.D., Kasedde, H., Olupot, P.W., Kirabira, J.B. (2025). Assessment of thermal comfort and its potential for energy efficiency in low-income tropical buildings: A review. Sustainable Energy Research, 12: 25. https://doi.org/10.1186/s40807-025-00169-9
[29] Elhassan, Z.A. (2023). Energy consumption performance using natural ventilation in dwelling design and CFD simulation in a hot dry climate: A case study in Sudan. Frontiers in Built Environment, 9: 1145747. https://doi.org/10.3389/fbuil.2023.1145747
[30] Mehmood, S., Lizana, J., Núñez-Peiró, M., Maximov, S.A., Friedrich, D. (2022). Resilient cooling pathway for extremely hot climates in southern Asia. Applied Energy, 325: 119811. https://doi.org/10.1016/j.apenergy.2022.119811
[31] Khechiba, A., Djaghrouri, D., Benabbas, M., Leccese, F., Rocca, M., Salvadori, G. (2023). Balancing thermal comfort and energy consumption in residential buildings of desert areas: Impact of passive strategies. Sustainability, 15(10): 8383. https://doi.org/10.3390/su15108383
[32] Mushtaha, E., Salameh, T., Kharrufa, S., et al. (2021). The impact of passive design strategies on cooling loads of buildings in temperate climate. Case Studies in Thermal Engineering, 28: 101588. https://doi.org/10.1016/j.csite.2021.101588
[33] Givoni, B. (1998). Climate Considerations in Building and Urban Design. John Wiley & Sons.
[34] Saadatjoo, P., Badamchizadeh, P., Mahdavinejad, M. (2023). Towards the new generation of courtyard buildings as a healthy living concept for post-pandemic era. Sustainable Cities and Society, 97: 104726. https://doi.org/10.1016/j.scs.2023.104726
[35] Yang, C., Misni, A. (2025). Analysis of thermal comfort in single-story courtyard vernacular dwellings in rural China: Passive design strategies for adapting to the climate. Buildings, 15(21): 3964. https://doi.org/10.3390/buildings15213964
[36] Young, H.D., Setyowati, E., Prianto, E., Dwiyanto, A. (2025). Multi-objective optimization of PCM-enhanced passive envelopes for net-zero hotel buildings in tropical Indonesia. International Journal of Computational and Experimental Science and Engineering, 11(3): 5949-5973. https://doi.org/10.22399/ijcesen.3652
[37] Matallah, M.E., Ahriz, A., Zitouni, D.C., Arrar, H.F., Ratmia, M.A.E.B., Attia, S. (2023). A methodological approach to evaluate the passive cooling effect of Oasis palm groves. Sustainable Cities and Society, 99: 104887. https://doi.org/10.1016/j.scs.2023.104887
[38] Izadpanahi, P., Farahani, L.M., Nikpey, R. (2021). Lessons from sustainable and vernacular passive cooling strategies used in traditional Iranian houses. Journal of Sustainability Research, 3(3): e210014. https://doi.org/10.20900/jsr20210014
[39] Jega, A.I., Al-Din, S.S.M. (2023). Implication of shading passive strategies in buildings of hot and humid climates for energy optimization: Lessons from vernacular dwellings in Nigeria. Journal of Salutogenic Architecture, 2(1): 50-69. https://doi.org/10.38027/jsalutogenic_vol2no1_4