Mustafa Ahmed Terzi* | Qahtan A.M. Al Nuaimy | Yusuf Kağan Kadioğlu
© 2026 The authors. This article is published by IIETA and is licensed under the CC BY 4.0 license (http://creativecommons.org/licenses/by/4.0/).
OPEN ACCESS
An integrated approach combining remote sensing and laboratory analysis was used to evaluate Sentinel-2 multispectral data for mapping iron and aluminum in Kirkuk, Iraq. A total of 27 spatially distributed soil samples were collected and analyzed for Fe₂O₃ and Al₂O₃ concentrations. Established Sentinel-2 spectral formulations were compared with two alternative formulations proposed in this study. Model performance was evaluated using an independent test subset based on root mean square error (RMSE), mean absolute error (MAE), bias, coefficient of determination (R²), and 95% confidence intervals. The proposed aluminum formulation showed a slight numerical improvement, with RMSE = 0.9877, MAE = 0.8408, bias = -0.2916, and R² = 0.1180. The proposed iron formulation showed comparable performance to one of the established iron formulations, with RMSE = 0.6590, MAE = 0.5352, bias = -0.4486, and R² = 0.0683; however, another established iron formulation achieved the lowest RMSE (0.6196). Given the low R² values, the proposed formulations should be considered preliminary spectral indicators of mineral-related spatial variability rather than quantitative concentration predictors. Their applicability was also qualitatively assessed using Sentinel-2 data from mining areas in China and Greece. Further validation using larger and independent datasets is required.
aluminum mapping, iron mapping, mineral mapping, Sentinel-2, spectral indices
The identification and mapping of mineral elements, especially iron and aluminum, are very important for mineral exploration, geological analysis, and sustainable resource management. Conventional field surveying and laboratory chemical analysis provide directly measurable information about mineral content, but their use in vast or topographically complicated areas is expensive, time-consuming, and spatially limited [1]. Remote sensing provides an alternative methodology that allows for systematic and spatially continuous observations over large areas. Among modern multispectral satellites, Sentinel-2 has proven itself to be a promising tool for geological and mineral mapping because of its high spatial resolution and spectral range from the visible to near-infrared (VNIR) and short-wave infrared (SWIR) spectral bands. The latter are especially useful for detecting absorption and reflection changes caused by mineral presence on the surface [2].
Previous research has already shown the ability of Sentinel-2 to identify and map minerals using spectral ratios and indices. Research [3] explored iron-related spectra of the Anqian Iron Mine in Anshan, China, and showed the applicability of Sentinel-2 bands in discriminating iron minerals based on their spectral responses. Additionally, mineral distributions, such as those of bauxites, were mapped using Sentinel-2 imagery by applying spectral transformations that highlight mineral-sensitive spectral variations [4, 5]. Overall, these studies show the possibility of using multispectral satellite observations as an addition to conventional geological studies.
A number of band ratio and normalized difference methods have been used in order to increase the spectral response of iron- and aluminum-containing minerals. For example, commonly used iron-based ratios include visible-band spectral ratios, while aluminum-based ratios may include SWIR-based ratios and normalized difference indices [6]. Spectral indices mentioned above provide relatively simple ways to emphasize the differences between certain bands of Sentinel-2 and have therefore been extensively applied in mineral mapping. However, the behavior of such indices may depend on the properties of the surface, geology, soil, vegetation, atmosphere, and spectral mixture of the pixels [7].
However, although the potential of the use of Sentinel-2 has been shown, there is a difficulty in converting the spectral index response to an accurate mineral concentration estimation. The spectral disturbance caused by non-target surface material and environment may cause a reduction in the ability of mineral detection [8]. In addition, spectral indices that were either developed or tested in one particular geological area will not necessarily behave similarly when applied in another location. Thus, satellite-based mineral indicators must be assessed using field and laboratory data instead of interpreting the results based on image contrast alone.
Against this backdrop, this research seeks to evaluate the effectiveness of Sentinel-2 spectral formulas for estimating Fe₂O₃ and Al₂O₃ concentrations in Kirkuk Governorate, Iraq, using laboratory data as a reference. Conventional iron and aluminum spectral formulations are evaluated alongside the alternative formulations proposed for iron and aluminum[9]. The novelty of this study lies primarily in the integrated evaluation of Sentinel-2 spectral transformations using laboratory-derived Fe₂O₃ and Al₂O₃ measurements within the geological setting of Kirkuk, Iraq. Rather than claiming that the alternative formulations represent universally superior spectral indices, this study evaluates their performance against established spectral formulations under the same independent testing framework. The alternative formulations are therefore considered site-specific spectral transformations whose applicability is assessed within the Kirkuk study area and qualitatively in selected external mineralized areas. Instead of judging the performance of the formulas only by visual interpretation or one error measure, these formulas are tested based on an independent test set and several statistical indicators such as root mean square error (RMSE), mean absolute error (MAE), bias, coefficient of determination (R²), and 95% confidence intervals. Thus, the study intends to (i) evaluate the agreement between the spectral estimates from Sentinel-2 and the laboratory data, (ii) compare the predictive performance of conventional and proposed spectral formulas under the same validation process, and (iii) test their suitability for mineral mapping other than the current study area.
Kirkuk Governorate is an important administrative and economic center located in northern Iraq, approximately 236 km from Baghdad. Geographically, Kirkuk Governorate is located at approximately 35°28′N latitude and 44°24′E longitude. Its geographical location connects the northern and central governorates of Iraq, making it an important location within the country [10, 11].
Table 1. Concentrations of Al₂O₃ and Fe₂O₃ in surface soil samples collected from various locations across Kirkuk and Taza Khormato
|
Sample ID |
Sampling Location |
Al₂O₃ Concentration (%) |
Fe₂O₃ Concentration (%) |
|
13 |
Rahimawa |
10.732 |
6.251 |
|
15 |
Amal Shabi 2 |
10.258 |
4.568 |
|
19 |
Shara jumhurya |
10.065 |
4.463 |
|
21 |
Sulaymania-Hawli road 2 |
12.82 |
6.077 |
|
27 |
Hay Senaay-Panja Ali 3 |
12.63 |
6.649 |
|
34 |
Al-hwrya |
8.599 |
4.153 |
|
44 |
Al-zoura 2 |
10.288 |
5.046 |
|
54 |
Hay adan |
11.538 |
4.79 |
|
59 |
Hay badr |
11.515 |
4.814 |
|
62 |
Al-zouhor - TCK |
8.442 |
4.376 |
|
14 |
Amal shabi 1 |
9.057 |
5.187 |
|
18 |
Almas |
8.293 |
4.989 |
|
24 |
Hawli Road 2 |
10.62 |
6.125 |
|
26 |
Hawli-Panja Ali Road 2 |
13.09 |
7.601 |
|
48 |
Hassar |
7.865 |
4.82 |
|
49 |
Kubani |
9.754 |
5.625 |
|
51 |
Hamzali |
9.342 |
5.555 |
|
60 |
Wahid Huzayran |
9.259 |
5.427 |
|
64 |
Hay senaay old |
8.79 |
4.989 |
|
8T |
Taza Khormato, site 1 |
7.518 |
4.703 |
|
11T |
Taza Khormato, site 2 |
9.185 |
5.303 |
|
13T |
Taza Khormato, site 3 |
8.983 |
5.445 |
|
16T |
Taza Khormato, site 4 |
8.22 |
4.817 |
|
24T |
Taza Khormato, site 5 |
7.611 |
4.959 |
|
26T |
Taza Khormato, site 6 |
9.202 |
5.237 |
|
27T |
Taza Khormato, site 7 |
8.932 |
5.217 |
|
30T |
Taza Khormato, site 8 |
8.294 |
4.959 |
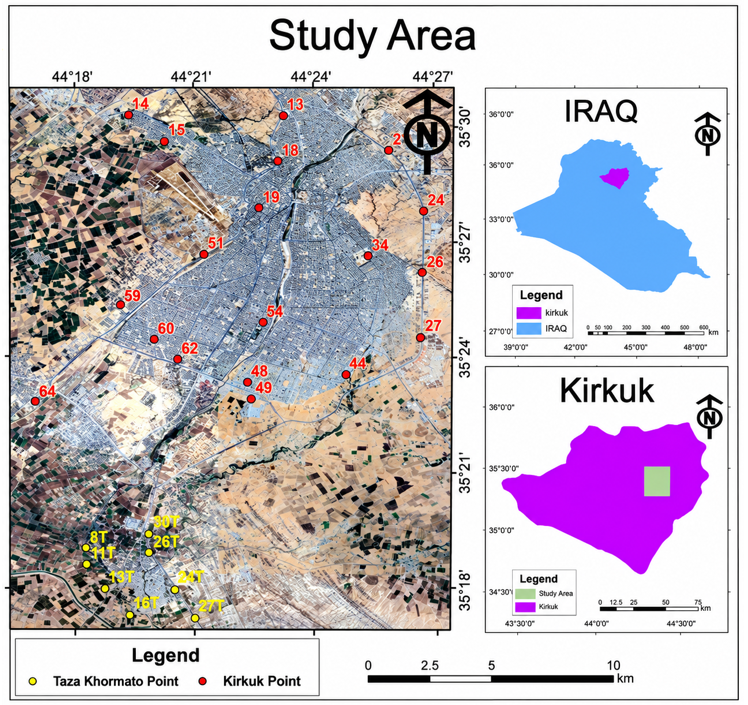
To determine the spatial variation of soil properties in a precise manner, the field sampling technique was employed to cover the geographical area of the study region. The field sampling provided 27 soil samples obtained from 30–40 cm depth (Figure 1 and Table 1), which are considered ideal in terms of extracting stable chemical and mineralogical characteristics and avoiding any variations due to random effects at the surface level [11]. These samples were brought back to the laboratory where they were prepared by means of air drying, grinding, and sieving through traditional aperture sizes for further analysis [13]. To incorporate field and laboratory data into the spatial analysis, a remote sensing approach was used, utilizing multispectral data from the Sentinel-2 satellite, where a high-resolution image (10 m) acquired on 18 December 2025 was used. To ensure the highest possible spectral accuracy, the chosen image was completely radiometrically and atmospherically corrected (Level-2A/Bottom-of-Atmosphere) in order to eliminate atmospheric scattering effects [14]. All processing and spatial analysis procedures were performed in a GIS environment [15].
Figure 1. Geographical location of the study area and the spatial distribution of sampling points in Kirkuk and Taza Khormato, Iraq, overlaid on a satellite image
The study area lies tectonically and structurally in the Foothill Zone, which is one of the subzones of the low-folded domain of the Zagros Fold-Thrust Belt in northeastern Iraq. Here, active compressive tectonic forces have generated a series of anticlines and synclines whose trend is generally NW-SE, thus generating structural complexity that significantly affects the distribution of rock outcrops [16]. Geomorphologically, the area can be described as a transitional geomorphological setting with hilly and dissected terrain in the northern and eastern parts and alluvial plains and wide river valleys in the southern and southwestern parts. Geomorphological processes occurring at the surface are largely controlled by the topography of the study area and include fluvial erosion, which leads to the redistribution of surface soil components [17]. Stratigraphically, much of the surface area is covered by Quaternary formations, such as alluvium, floodplain, and slope-wash deposits, which form the parent material of the local soil [11].
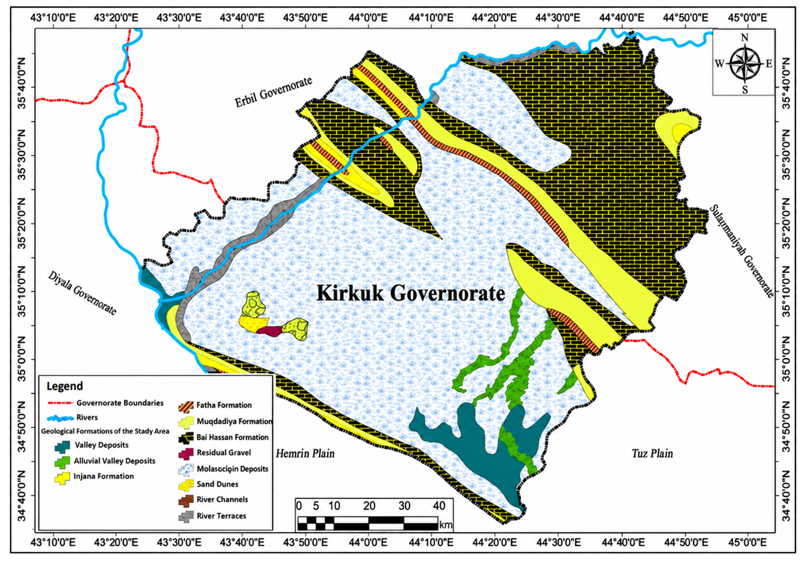
Underneath these recent deposits, late Tertiary formations are exposed on elevated areas and crests of folds, including the late Miocene Injana Formation composed of alternations of sandstone, siltstone, and red-gray clay with high iron content; Pliocene Mukdadiya Formation composed of gravels, cross-bedded sands, and clays; and Bai Hassan Formation with coarse and consolidated conglomerates [12, 18] (Figure 2). Continuous physical and chemical weathering of these sequences, especially the argillaceous beds of the Injana and Mukdadiya formations, has greatly enhanced the mineral contents of the surface soils in terms of iron (Fe) and aluminum (Al) ores. This variety in lithology and mineralogical content produces unique spectral characteristics, thus making it possible to accurately extract these minerals through remote sensing datasets used in this study, hence improving the accuracy of the sustainable mineral distribution maps [19].
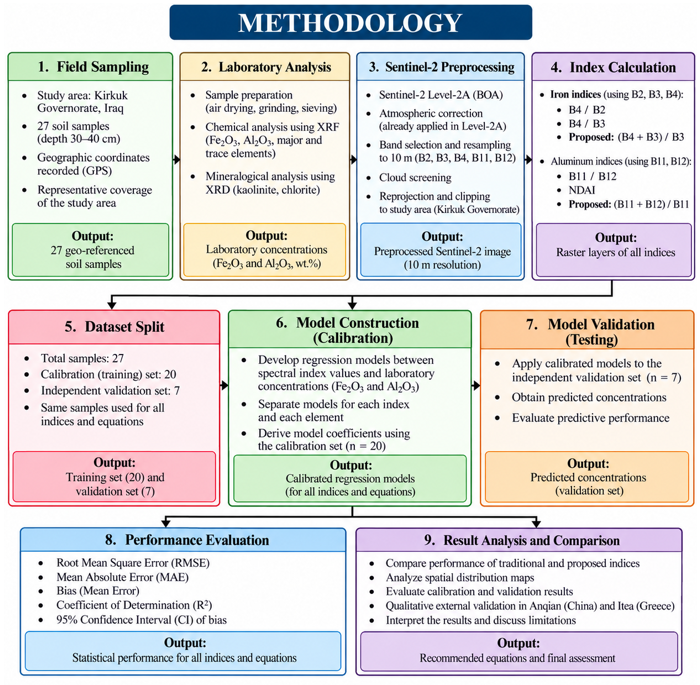
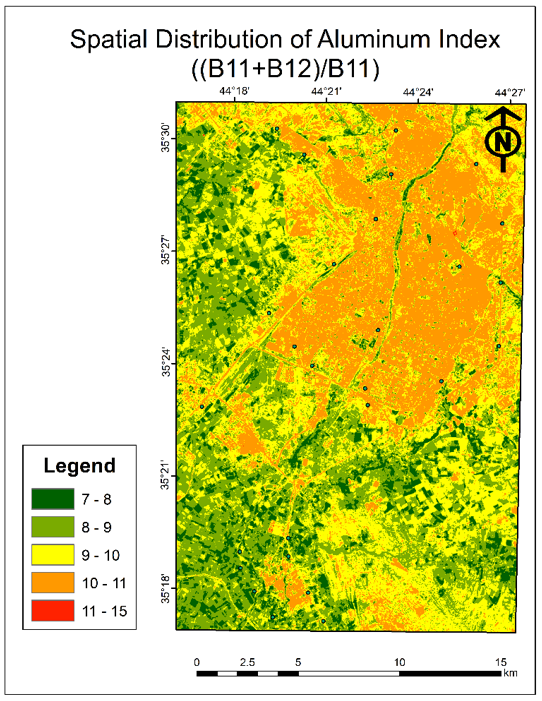
A combined methodology framework (Figure 3) was adopted for the characterization and analysis of the spatial distribution of iron and aluminum in Kirkuk Governorate, Iraq. The methodology framework consists of field sampling, chemical analysis, Sentinel-2 remote sensing, and GIS methodologies. In total, 27 field samples were subjected to laboratory analysis of Fe2O3 and Al2O3 to be considered as ground truth values. Sentinel-2 multispectral images were subjected to band arithmetic and various spectral indices. For iron, conventional Eq. (1) and Eq. (2) ratios were studied and compared with the proposed Eq. (5) ratio. On the other hand, for aluminum, the published Eq. (3) and Eq. (4) were studied and compared with the proposed Eq. (6) ratio. The selection of these band combinations was based on the spectral characteristics of iron- and aluminum-bearing minerals. The visible bands used for the iron formulations are sensitive to spectral variations associated with iron-bearing materials, whereas the SWIR bands used for the aluminum formulations are more relevant to absorption features associated with Al-OH-bearing minerals.
It should be noted that Eq. (5), (B4 + B3)/B3, is algebraically equivalent to Eq. (2), B4/B3, with a constant shift of +1. Because the spectral formulations were evaluated using regression relationships that included an intercept, this constant shift changes only the regression intercept and does not change the fitted predictions or the resulting statistical performance measures.
$Iron =\frac{B 4}{B 2}$ (1)
$Iron =\frac{B 4}{B 3}$ (2)
$Aluminum =\frac{B 11}{B 12 }$ (3)
$N D A I=\left(\frac{B 11-B 12}{B 11+B 12}\right)$ (4)
$Iron =\left(\frac{B 4+B 3}{B 3}\right)$ (5)
$Aluminum =\left(\frac{B 11+B 12}{B 11}\right)$ (6)
where,
Iron: Iron spectral index
Aluminum: Aluminum spectral index
NDAI: Normalized Difference Aluminum Index
B2: Blue band
B3: Green band
B4: Red band
B11: SWIR 1 band
B12: SWIR 2 band
To link the field and laboratory data with the spatial analysis, Sentinel-2 Level-2A imagery acquired from the Copernicus Browser on 18 December 2025 was used. The selected scene had approximately 0.006% cloud coverage, and no significant cloud contamination or visible distortion was observed over the study area. The selected acquisition date provided suitable image conditions for the analysis. Sentinel-2 Bands 11 and 12 have a native spatial resolution of 20 m and were resampled to 10 m using the Nearest Neighbor method prior to the spectral calculations to maintain a consistent processing grid. This resampling standardized the pixel size for spatial processing but did not create additional spatial information beyond the native 20 m resolution of the SWIR bands. The geographic coordinates of the field samples were used to match each sampling location with the corresponding Sentinel-2 pixel. The required band values were extracted at each sample location using the Extract Values to Points tool in ArcGIS 10.4.1 and were subsequently linked to the corresponding laboratory-measured Fe₂O₃ and Al₂O₃ concentrations.
Figure 3. Integrated methodological framework for iron and aluminum mapping using field sampling, laboratory analysis, Sentinel-2 imagery, and statistical validation
The data were divided into a calibration (training) set of 20 samples and an independent test set of 7 samples. Using an approximate 70:30 calibration-to-test allocation, seven samples were selected as the independent test set based on their spatial distribution to ensure coverage of the study area, while the remaining 20 samples were used for calibration. No formal stratification based on Fe₂O₃ or Al₂O₃ concentration levels was applied. The calibration set was used to establish the regression relationships between the Sentinel-2 spectral formulations and the laboratory-measured Fe₂O₃ and Al₂O₃ concentrations, while the independent test set was used to evaluate model performance using RMSE, MAE, bias, R², and the 95% confidence interval of bias.
The sampling locations were selected jointly by the researcher and the supervisor based on field conditions and the objective of achieving comprehensive spatial coverage of the study area. The distance between adjacent sampling points ranged from approximately 0.59 to 5.68 km, reflecting the spatial distribution of the sampling locations across the study area. Sampling locations were preferentially selected from areas with exposed or predominantly exposed soil to minimize the influence of vegetation and other land-cover effects on the Sentinel-2 spectral response. Potential mixed-pixel effects and local soil heterogeneity were considered as sources of uncertainty in the analysis. Cross-validation was not performed in this study. Given the limited sample size, the potential risk of overfitting and the uncertainty associated with model performance should therefore be considered when interpreting the results.
The spatial analysis of Sentinel-2 data, combined with statistical analysis of field and laboratory data, allowed for an evaluation of the effectiveness of both traditional and alternative spectral formulations in mapping iron and aluminum.
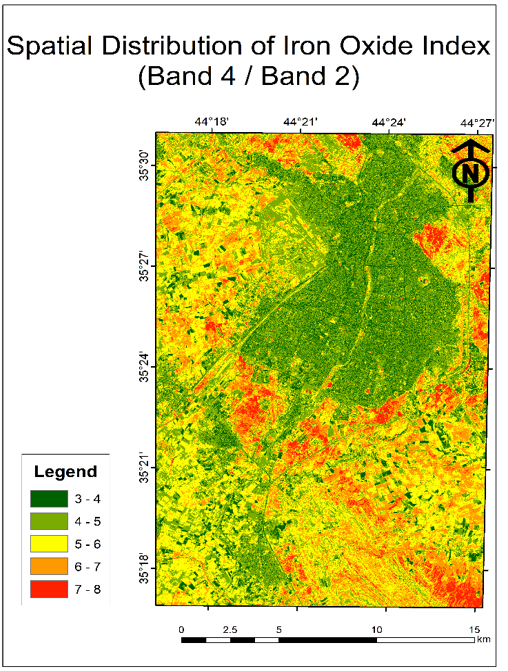
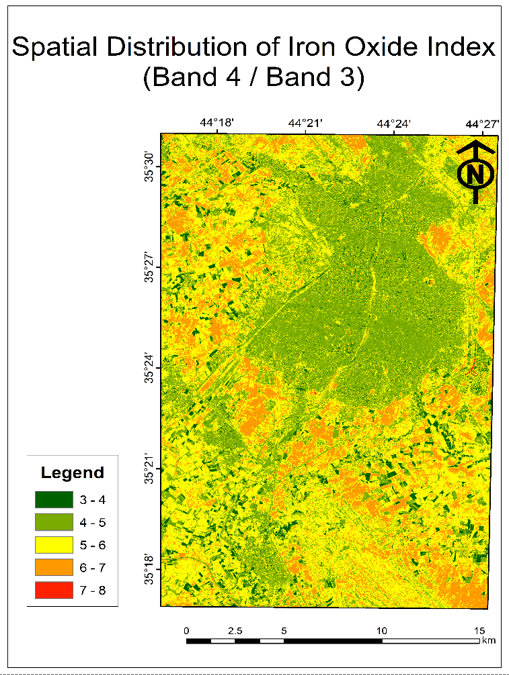
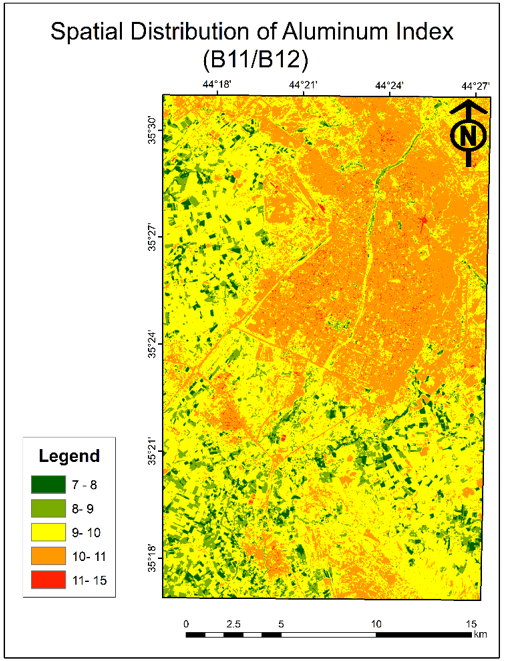
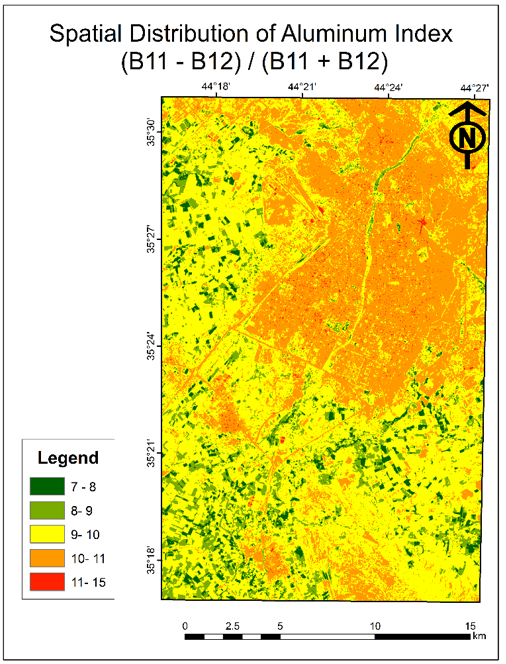
The results obtained using the standard iron spectral formulations in Eqs. (1) and (2) are shown in Figures 4 and 5, respectively, and the results of the standard aluminum in Eq. (3) and NDAI in Eq. (4) are presented in Figures 6 and 7, respectively. The statistical analysis based on the independent test dataset showed that the iron ratio in Eq. (1) provided an RMSE of 0.6196, an MAE of 0.5005, a bias of -0.4232, and an R² of 0.0001, and iron ratio in Eq. (2) provided an RMSE of 0.6590, an MAE of 0.5352, a bias of -0.4486, and an R² of 0.0683. For aluminum, the B11/B12 ratio provided an RMSE of 0.9972, an MAE of 0.8419, a bias of -0.3147, and an R² of 0.1138, while NDAI provided an RMSE of 0.9921, an MAE of 0.8416, a bias of -0.3026, and an R² of 0.1160.
Figure 4. Spatial distribution map of iron in the study area, derived from satellite imagery using the spectral band ratio technique
Figure 5. Spatial distribution map of iron in the study area, derived using the spectral band ratio technique
Figure 6. Spatial distribution map of aluminum in the study area, derived using the spectral band ratio technique
Figure 7. Spatial distribution map of aluminum in the study area, derived using the Normalized Difference Aluminum Index (NDAI)
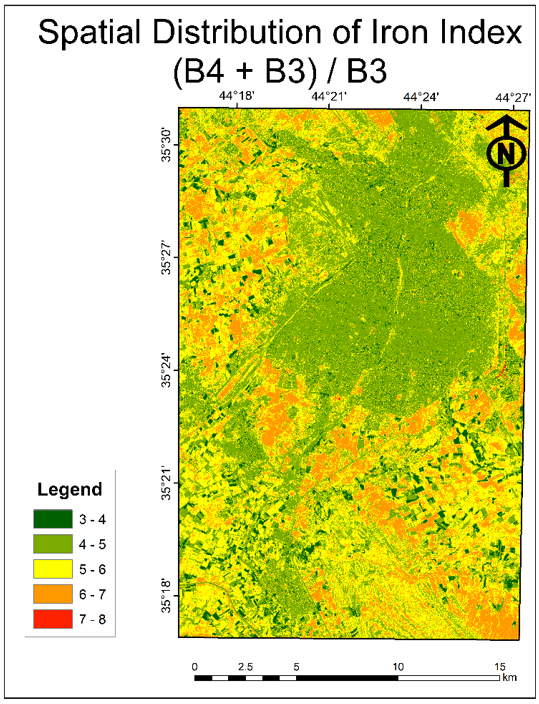
The above-stated formulations were analyzed using the same independent test data and statistical measures. The iron formulation developed in this study, Eq. (5), which is illustrated in Figure 8, produced an RMSE of 0.6590, an MAE of 0.5352, a bias of -0.4486, and an R² of 0.0683. The identical statistical results obtained for Eqs. (2) and (5) are mathematically expected because Eq. (5), (B4 + B3)/B3, is algebraically equivalent to Eq. (2), B4/B3, with a constant shift of +1. Since the formulations were evaluated using regression relationships that included an intercept, this constant shift changes only the regression intercept and does not change the fitted predictions or the resulting statistical performance measures. The Eq. (1) ratio had the lowest RMSE among the evaluated iron formulations. The aluminum formulation developed in this study, Eq. (6), which is illustrated in Figure 9, produced an RMSE of 0.9877, an MAE of 0.8408, a bias of -0.2916, and an R² of 0.1180. Compared with Eqs. (3) and (4), the aluminum formulation showed a slight numerical improvement.
Figure 8. Spatial distribution map of iron in the study area, derived using the newly proposed spectral index
Figure 9. Spatial distribution map of aluminum in the study area, derived using the newly proposed spectral index
An extensive statistical comparison of the six evaluated spectral formulations is provided in Table 2, including RMSE, MAE, bias, R², and the respective 95% confidence interval of the bias.
Table 2. Statistical performance of conventional and proposed Sentinel-2 spectral formulations for Fe₂O₃ and Al₂O₃ prediction using the independent test dataset
|
Mineral |
Spectral Equation |
RMSE |
MAE |
Bias |
R² |
95% CI of Bias |
|
Iron |
B4/B2 |
0.6196 |
0.5005 |
-0.4232 |
0.0001 |
-0.8752–0.0288 |
|
Iron |
B4/B3 |
0.6590 |
0.5352 |
-0.4486 |
0.0683 |
-0.9308–0.0336 |
|
Iron |
(B4+B3)/B3 (Proposed) |
0.6590 |
0.5352 |
-0.4486 |
0.0683 |
-0.9308–0.0336 |
|
Aluminum |
B11/B12 |
0.9972 |
0.8419 |
-0.3147 |
0.1138 |
-1.2599–0.6306 |
|
Aluminum |
NDAI |
0.9921 |
0.8416 |
-0.3026 |
0.1160 |
-1.2464–0.6413 |
|
Aluminum |
(B11+B12)/B11 (Proposed) |
0.9877 |
0.8408 |
-0.2916 |
0.1180 |
-1.2343–0.6512 |
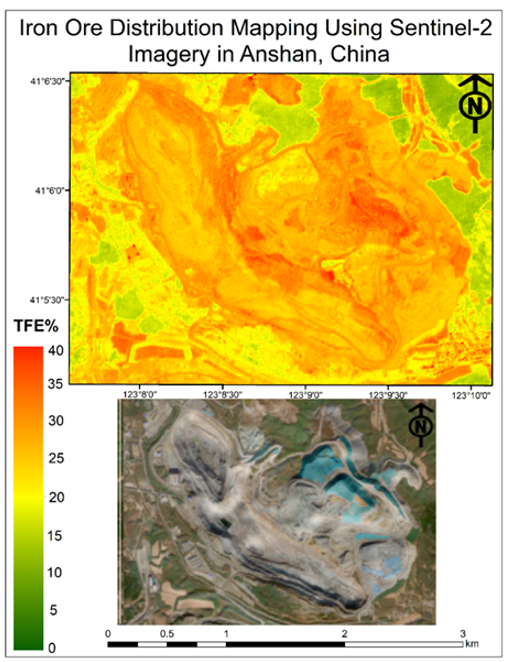
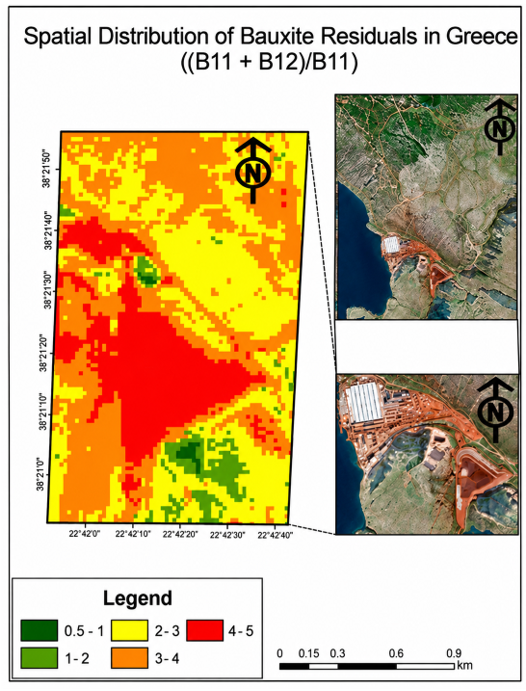
In order to examine the geographical generalizability of the suggested formulations, the method was applied to mining areas having geological characteristics that differed from those of the main area of interest. The iron formula was used for Sentinel-2 images of the Anqian Iron Mine in Anshan, China [20], where the spatial distribution is presented in Figure 10. In addition, the aluminum formula was used for the Itea bauxite mine in Greece [21], as shown in Figure 11. The resulting spatial distribution correlated well with the previously reported mineralized zones. However, because of the lack of independent laboratory data from these areas in the current study, the results are considered a qualitative applicability assessment.
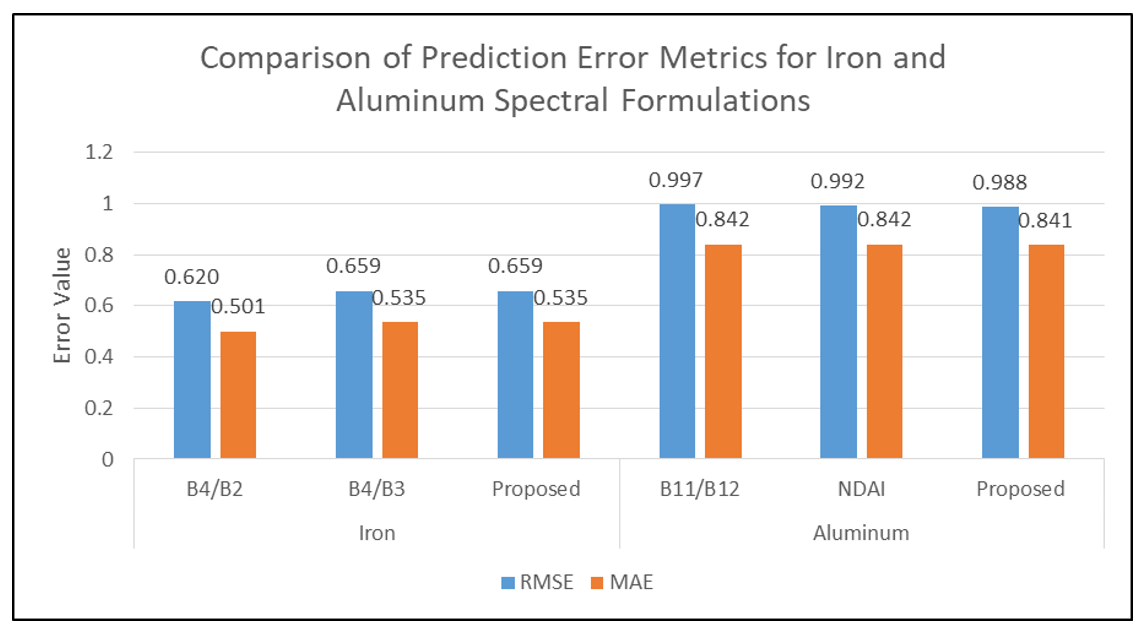
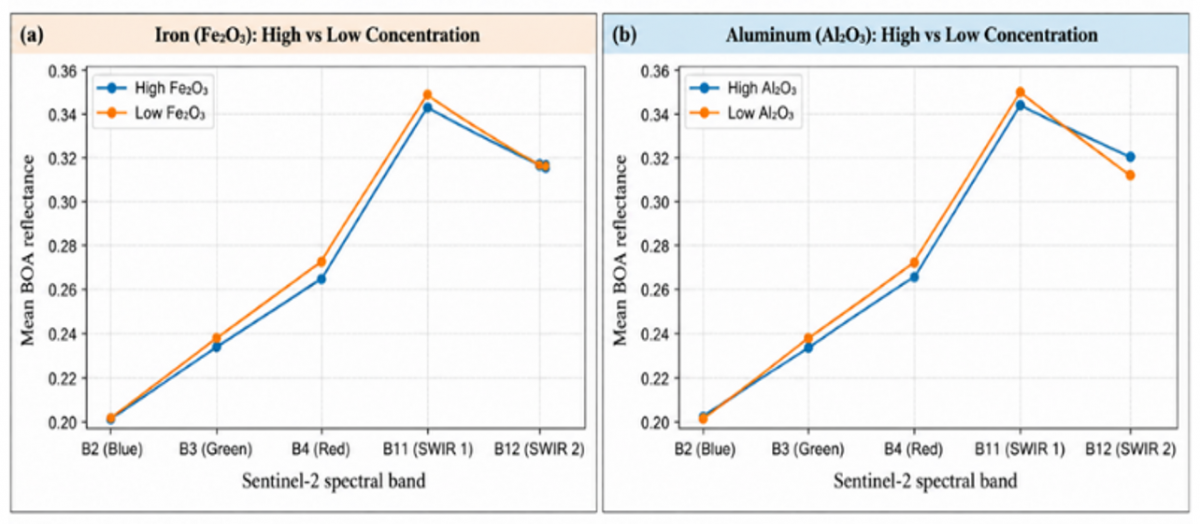
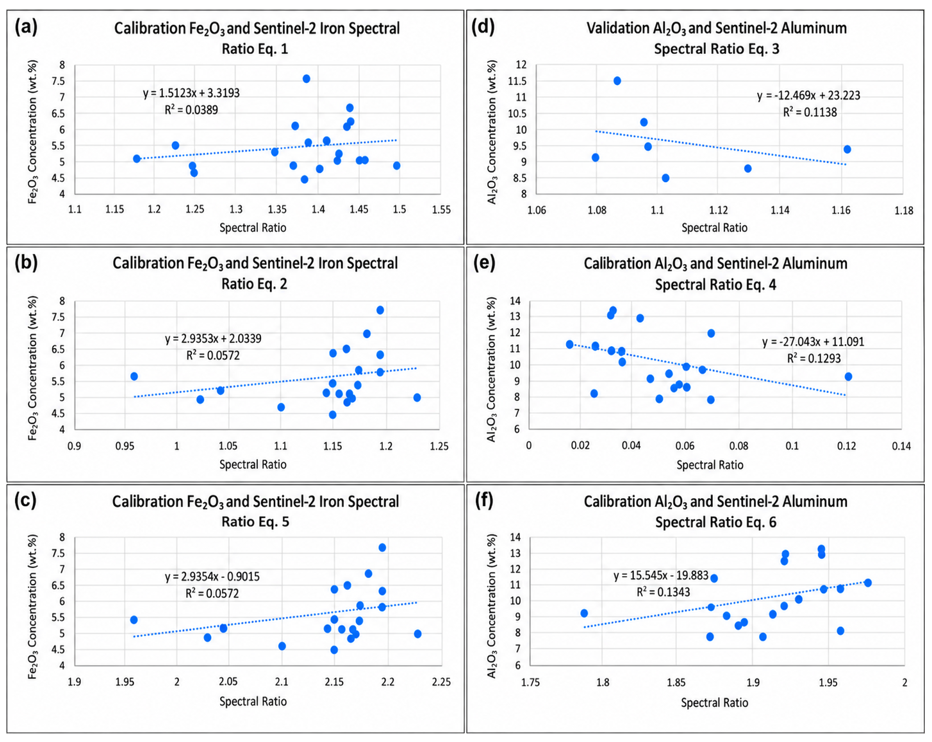
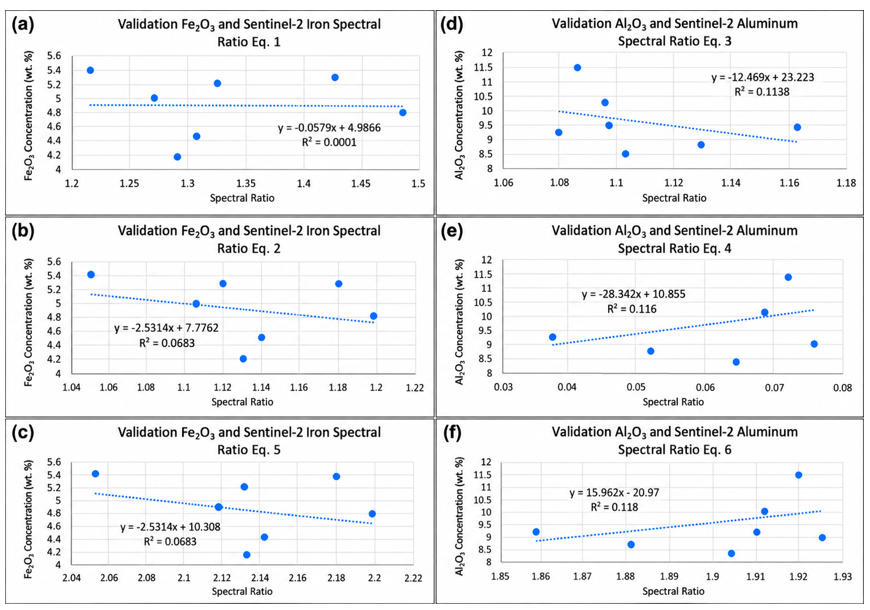
The comparison of RMSE and MAE values for the conventional and proposed Sentinel-2 spectral formulations for iron and aluminum is presented in Figure 12. The mean Sentinel-2 spectral responses of high- and low-concentration samples for Fe₂O₃ and Al₂O₃ are presented in Figure 13, providing a spectral comparison across the investigated Sentinel-2 bands. The calibration relationships between the spectral formulations and laboratory-measured concentrations, based on the 20 calibration samples, are presented in Figure 14. The corresponding independent validation relationships based on the 7 validation samples are presented separately in Figure 15. These figures provide a clear distinction between the calibration dataset used for model construction and the independent validation dataset used for model evaluation.
Figure 12. Comparison of root mean square error (RMSE) and mean absolute error (MAE) values for conventional and proposed Sentinel-2 spectral formulations for iron and aluminum
Figure 14. Calibration relationships between Fe₂O₃ and Al₂O₃ concentrations and the corresponding Sentinel-2 spectral equations: (a) Eq. (1), (b) Eq. (2), (c) Eq. (5), (d) Eq. (3), (e) Eq. (4), and (f) Eq. (6)
Figure 15. Independent validation relationships between Fe₂O₃ and Al₂O₃ concentrations and the corresponding Sentinel-2 spectral equations: (a) Eq. (1), (b) Eq. (2), (c) Eq. (5), (d) Eq. (3), (e) Eq. (4), and (f) Eq. (6), based on the independent validation dataset (n = 7)
In summary, the findings show that the spectral equations for Sentinel-2 provide sensitivity to changes in iron- and aluminum-containing minerals. The alternative aluminum formulation showed a slight numerical improvement compared with the traditional aluminum indices, while the alternative iron formulation showed performance comparable to Eq. (2), although it did not perform better than Eq. (1) with regard to prediction errors. Therefore, these formulations can be considered alternative spectral transformations whose predictive performance requires further evaluation using independent datasets.
The results obtained in this study demonstrate the possibility of combining the use of multispectral images from the Sentinel-2 satellite and laboratory analysis to evaluate the spatial distribution of iron and aluminum in the Kirkuk Governorate. However, the results obtained from the statistical analysis show that the relationship is rather weak, particularly concerning the value of R². Therefore, the proposed formulations should be considered as alternative spectral transformations rather than superior replacements for the existing indices.
(1) Iron spectral formulations
The Eq. (1) and (2) band ratios are commonly used spectral transformations for enhancing iron-related spectral responses and have been applied in previous mineral-mapping studies [3, 22]. In the present study, the conventional Eq. (1) formulation produced the lowest prediction error for iron, with an RMSE of 0.6196 and MAE of 0.5005, whereas Eq. (2) produced an RMSE of 0.6590 and MAE of 0.5352. The proposed formulation, Eq. (5), yielded an RMSE of 0.6590, MAE of 0.5352, bias of -0.4486, and R² of 0.0683. Consequently, the proposed iron formulation did not outperform Eq. (1) and showed performance comparable to Eq. (2) under the present independent testing framework.
Considering the spectrum, the proposed formulation of iron considers the information of red (B4) and green (B3) bands, which are natively available in Sentinel-2 with 10 m spatial resolution. The resulting transformation is a relatively simple one that can be implemented through band arithmetic without requiring resampling of the bands considered. Previous studies, such as study [3], have pointed out the importance of the spectral information provided by Sentinel-2 for iron mineral mapping. However, in this case, the small values of R²—0.0001 for Eq. (1) and 0.0683 for Eq. (2) and the proposed formulation—suggest that the spectral transformations tested explain a relatively small part of the variation in Fe₂O₃ concentration measured in the lab in the independent test sample. Therefore, the main advantage of the proposed iron formulation lies in its simplicity and its comparable performance to Eq. (2).
(2) Aluminum spectral formulations
Earlier studies have analyzed the use of Sentinel-2 SWIR data for the identification of aluminum-containing and bauxite-associated materials, such as the works by Anifadi et al. [4] and Kasmaeeyazdi et al. [5]. The application can be affected by spectral mixing and interference between the mineralogical and surface components [4]. In the current study, the traditional formula of Eq. (3) provided the results of RMSE of 0.9972, MAE of 0.8419, Bias of -0.3147, and R² of 0.1138, while Eq. (4) gave RMSE of 0.9921, MAE of 0.8416, Bias of -0.3026, and R² of 0.1160. The new formula of (B11+B12)/B11 gave RMSE of 0.9877, MAE of 0.8408, bias of -0.2916, and R² of 0.1180.
Such results demonstrate only a slight numerical improvement of the new aluminum formulation compared to the other two conventional indices. The new aluminum formulation provides the smallest RMSE and MAE, bias closest to zero, and the largest R² among all three aluminum formulations. Nevertheless, the level of improvement is small, and the R² value is relatively low. Therefore, the results obtained do not confirm the assumption that the new aluminum formulation can be considered superior to the traditional indices. Instead, the results show that incorporation of B11 and B12 into the new aluminum formulation can provide a somewhat different description of SWIR variability of aluminum-containing surface materials in the study area.
The comparative error analysis presented in Figure 12 further illustrates the relative performance of the evaluated spectral formulations. For iron, the Eq. (1) ratio produced the lowest RMSE and MAE, whereas the proposed formulation showed error levels comparable to those of Eq. (2). For aluminum, the proposed formulation produced slightly lower RMSE and MAE values than Eqs. (3) and (4). However, the differences among the aluminum formulations were relatively small, indicating a modest improvement rather than a substantial increase in predictive performance.
The 95% confidence intervals for the bias of the evaluated formulations included zero, indicating that the estimated mean prediction errors were associated with considerable uncertainty. The uncertainty, together with the relatively low R² values, must be considered in the context of the small number of observations in the independent test subset. Therefore, the findings clearly demonstrate the necessity of using a number of statistical criteria instead of RMSE only.
The weak relationships observed in the independent test dataset may also be influenced by several characteristics of the surface and the remote sensing data. Soil heterogeneity can produce substantial local variations in mineral composition and spectral response, which may reduce the correspondence between individual field samples and satellite-derived spectral values. In addition, although sampling locations were preferentially selected from exposed or predominantly exposed soil, some Sentinel-2 pixels may contain mixed surface materials, including soil, vegetation, and other components, which can affect the extracted spectral response. Variations in mineral assemblages and the relative abundance of iron- and aluminum-bearing minerals may also modify the spectral response and reduce the direct relationship between simple spectral transformations and laboratory-measured concentrations. Furthermore, although Sentinel-2 Level-2A data provide atmospherically corrected bottom-of-atmosphere reflectance, residual atmospheric effects and differences in illumination and surface conditions may still influence the measured spectral response. These factors, together with the limited sample size, may partly explain the low R² values and should be considered when interpreting the quantitative relationships obtained in this study.
The qualitative applicability assessments provide additional information about the geographical behavior of the alternative formulations. In particular, the suggested formulation for iron shows spatial patterns related to the mineralized area of the Anqian Iron Mine in Anshan, China, while the suggested formulation for aluminum highlights spatial patterns associated with the Itea bauxite zone in Greece, which has been previously studied using Sentinel-2 data [4, 5]. However, since there is no independent laboratory analysis of these external sites in the current research, these findings cannot be considered quantitative proof of predictive ability or universal applicability. Instead, they demonstrate that the suggested formulations retain their spatial sensitivity outside the Kirkuk study site.
In general, the developed formulations can be considered simple alternative spectral transformations for Sentinel-2-based mapping of iron and aluminum. The formula for aluminum showed some improvement numerically compared to the tested conventional aluminum indices, and the formula for iron was comparable in performance to Eq. (2), though it was not better than Eq. (1). Further validation should be done on larger datasets and different geological settings.
This study investigated the possibility of combining Sentinel-2 multispectral imagery with laboratory analysis to evaluate Fe₂O₃ and Al₂O₃ concentrations in Kirkuk Governorate, Iraq. Various spectral equations were compared using an independent test dataset based on RMSE, MAE, bias, R², and 95% confidence intervals. For iron, conventional Eq. (1) provided the lowest prediction error (RMSE = 0.6196; MAE = 0.5005), whereas the proposed Eq. (5) resulted in RMSE = 0.6590, MAE = 0.5352, bias = −0.4486, and R² = 0.0683, yielding performance identical to that of Eq. (2). For aluminum, the proposed Eq. (6) showed a slight numerical improvement over the other evaluated formulations, with RMSE = 0.9877, MAE = 0.8408, bias = −0.2916, and R² = 0.1180.
The findings indicate that simple Sentinel-2 spectral transformations can provide information on the spatial variability of iron- and aluminum-bearing surface materials. However, the low R² values indicate weak relationships between the spectral formulations and laboratory-measured concentrations. Considering the limited sample size and associated uncertainty, the alternative formulations should not be regarded as validated quantitative prediction models or universally applicable indices. Rather, they should be considered preliminary spectral indicators of qualitative mineral-related spatial variability.
The applications in the Anqian Iron Mine in Anshan, China, and the Itea bauxite area in Greece provided qualitative applicability assessments based on spatial patterns, as independent laboratory measurements were not available for these areas. Further evaluation using larger datasets, additional field samples, and multiple geological regions is required to determine the reliability, transferability, and broader applicability of the alternative formulations.
The author wishes to express appreciation and deference to DR. ABBAS MOHAMMED NOURI from NORTHERN TECHNICAL ENGINEERING College Kirkuk for his constructive scientific observations during the various stages of this research.
[1] Abdulraheem, M.I., Zhang, W., Li, S.X., Moshayedi, A.J., Farooque, A.A., Hu, J.D. (2023). Advancement of remote sensing for soil measurements and applications: A comprehensive review. Sustainability, 15(21): 15444. https://doi.org/10.3390/su152115444
[2] Van der Werff, H., Van der Meer, F. (2016). Sentinel-2A MSI and landsat 8 OLI provide data continuity for geological remote sensing. Remote sensing, 8(11): 883. https://doi.org/10.3390/rs8110883
[3] Ge, W.Y., Cheng, Q.M., Jing, L.H., Wang, F., Zhao, M.L., Ding, H.F. (2020). Assessment of the capability of sentinel-2 imagery for iron-bearing minerals mapping: A case study in the cuprite area, Nevada. Remote Sensing, 12(18): 3028. https://doi.org/10.3390/RS12183028
[4] Anifadi, A., Sykioti, O., Koutroumbas, K., Vassilakis, E., Georgiou, E., Vasilatos, C. (2022). Investigating the capability of Sentinel-2 and worldview-3 SWIR to map the main mineralogical composition of bauxite through spectral unmixing. Case study: Itea, Greece. In 16th International Congress of the Geological Society of Greece, Geological Society of Greece.
[5] Kasmaeeyazdi, S., Mandanici, E., Balomenos, E., Tinti, F., Bonduà, S., Bruno, R. (2021). Mapping of aluminum concentration in bauxite mining residues using Sentinel-2 imagery. Remote Sensing, 13(8): 1517. https://doi.org/10.3390/rs13081517
[6] van der Meer, F., Hecker, C., van Ruitenbeek, F., van der Werff, H., de Wijkerslooth, C., Wechsler, C. (2014). Geologic remote sensing for geothermal exploration: A review. International Journal of Applied Earth Observation and Geoinformation, 33: 255-269. https://doi.org/10.1016/j.jag.2014.05.007
[7] van der Werff, H., Ettema, J., Sampatirao, A., Hewson, R. (2022). How weather affects over time the repeatability of spectral indices used for geological remote sensing. Remote Sensing, 14(24): 6303. https://doi.org/10.3390/rs14246303
[8] Chen, Y.S., Wang, Y.C., Zhang, F., Dong, Y.L., Song, Z.H., Liu, G.Y. (2023). Remote sensing for lithology mapping in vegetation-covered regions: Methods, challenges, and opportunities. Minerals, 13(9): 1153. https://doi.org/10.3390/min13091153
[9] Ibrahim, E., Barnabé, P., Ramanaidou, E., Pirard, E. (2018). Mapping mineral chemistry of a lateritic outcrop in new Caledonia through generalized regression using Sentinel-2 and field reflectance spectra. International Journal of Applied Earth Observation and Geoinformation, 73: 653-665. https://doi.org/10.1016/j.jag.2018.08.004
[10] Ali, C.A., Shareef, M.A., Al Nuaimy, Q.A.M. (2024). Significance and distribution of soil parameters in the Laylan area, Kirkuk city, Northern Iraq using interpolation methods based on GIS technique. Scientific Research Journal of Multidisciplinary, 4(2): 1-13. https://doi.org/ 10.47310/srjmd.2024.v04i02.01
[11] Taqi, A.H., Al Nuaimy, Q.A.M., Karem, G.A. (2016). Study of the properties of soil in Kirkuk, Irap. Journal of Radiation Research and Applied Sciences, 9(3): 259-265. https://doi.org/10.1016/j.jrras.2016.02.006
[12] Sissakian, V.K., Fouad, S.F.A. (2015). Geological map of Iraq, scale 1: 1000 000, 4th edition, 2012. Iraqi Bulletin of Geology and Mining, 11(1): 9-16. https://ibgm-iq.org/ibgm/index.php/ibgm/article/view/263.
[13] Mohammed, P.A., Al Nuaimy, Q.A.M., Shareef, M.A. (2024). Analyzing soil physical properties in Kirkuk City, Iraq, utilizing a geographic information system-based inverse distance-weighted technique. Ecological Engineering & Environmental Technology, 25(11): 118-133. https://doi.org/10.12912/27197050/192346
[14] Louis, J., Pflug, B., Main-Knorn, M., et al. (2019). Sentinel-2 global surface reflectance level-2A product generated with Sen2Cor. In IGARSS 2019-2019 IEEE International Geoscience and Remote Sensing Symposium, Yokohama, Japan, pp. 8522-8525. https://doi.org/10.1109/IGARSS.2019.8898540
[15] Shakir, B.Q., Shareef, M.A., Al Nuaimy, Q.A.M. (2025). Determination of soil properties utilizing C-band synthetic aperture radar (SAR) in Southern Kirkuk Governate, Northern Iraq. Engineering, Technology & Applied Science Research, 15(4): 25407-25416. https://doi.org/10.48084/etasr.12189
[16] Jassim, S.Z., Goff, J.C. (2006). The Geology of Iraq. DOLIN s.r.o. https://www.geolsoc.org.uk/bookshop/products/the-geology-of-iraq.
[17] Mohammed, A.A., Resen, A.K., Mohammed, A.A. (2019). Using remote sensing and GIS to study morphological analysis of Kirkuk province. Iraqi Journal of Science.
[18] Hussain, A.I., Sarhan, M.S. (2015). Evaluation of the suitability of mukdadiya formation rocks for using in concrete / Northern Hemrin Anticline. Tikrit Journal of Pure Science, 20(3): 129-136. https://doi.org/10.25130/tjps.v20i3.1195
[19] Vignesh, K.M., Kiran, Y. (2020). Comparative analysis of mineral mapping for hyperspectral and multispectral imagery. Arabian Journal of Geosciences, 13(4): 160. https://doi.org/10.1007/s12517-020-5148-8
[20] Kasmaeeyazdi, S., Braga, R., Tinti, F., Mandanici, E. (2022). Mapping bauxite mining residues using remote sensing techniques. Materials Proceedings, 5(1): 91. https://doi.org/10.3390/materproc2021005091
[21] Hegab, M.A.E.R., Salem, S.M., Soliman, N.M., et al. (2025). Iron ore exploration in the Central Eastern Desert of Egypt: Insights from remote sensing, geophysical, and geochemical data. Egyptian Journal of Remote Sensing and Space Science, 28(4): 690-712. https://doi.org/10.1016/j.ejrs.2025.11.001
[22] Kamsir, N.P., Saepuloh, A., Susanto, V., Nugraha, E.D. (2025). Remote sensing of radioactive alteration zones using Sentinel-2 and SPAD chlorophyll measurements in Mamuju, Indonesia. Rudarsko-geološko-naftni zbornik, 41(3): 207-218. https://doi.org/10.17794/rgn.2026.3.14