Diah Ayu Wulandari Sulistyaningrum* | Rachmadhi Purwana | Djoko M. Hartono | Dwita Sutjiningsih
© 2026 The authors. This article is published by IIETA and is licensed under the CC BY 4.0 license (http://creativecommons.org/licenses/by/4.0/).
OPEN ACCESS
This study investigates the socio-economic and environmental dynamics of Sepaku District, a strategic buffer zone within the Nusantara Capital City (IKN) development area. The research integrates socio-demographic assessment, water quality evaluation, and system dynamics modelling to provide a holistic understanding of resource sustainability under rapid urban transformation. A household survey involved 385 completed questionnaires with three duplicate records removed, resulting in 382 valid responses. It was conducted to characterize gender, age, education, occupation, income, and water consumption behaviour. Results indicate that the population is predominantly of working age, with the majority belonging to low- to lower-middle-income groups for whom water expenses constitute a significant share of monthly income. Water quality analysis at one Sepaku River site and two household wells identified several parameters that exceeded the applicable source-specific standards, including suspended solids or turbidity, colour, iron, manganese, phenol, and microbiological indicators. These results represent conditions at the sampled sites during one sampling period. A system dynamics model was developed to simulate future water demand and supply scenarios under varying urbanization and population growth trajectories. Model projections suggest an increasing water deficit in Sepaku District, driven by accelerated urban expansion and demographic growth. To address this imbalance, inter-regional water transfer from the IKN core zone to adjacent areas is recommended. The results indicate the potential for water redistribution from surplus areas (IKN) to deficit areas (Sepaku) as a mitigation measure against spatial imbalances in water availability between IKN and its surrounding buffer zones. The transfer of excess water from the IKN water supply system to Sepaku can be considered a medium-term option or a conditional policy option to bridge the water demand gap in the buffer zones, with a feasibility study requiring further assessment of technical, ecological, economic, and institutional aspects.
socio-economic disparities, clean water accessibility, water quality, system dynamics, the Nusantara Capital City, clean water management
The relocation of Indonesia’s national capital (Nusantara Capital City, IKN) from Jakarta to East Kalimantan represents a major national strategic agenda aimed at promoting equitable development and reducing interregional economic disparities [1]. Jakarta, one of the world’s 33 megacities, has long faced a range of complex challenges, including a population exceeding 33 million inhabitants [2], severe traffic congestion [3], land subsidence reaching up to 15 cm per year, and increasing vulnerability to flooding and sea-level rise [4]. These conditions have rendered Jakarta less viable as a long-term seat of government, thereby underscoring the urgency of establishing a new capital city that is both sustainable and globally competitive. The selection of East Kalimantan as the site for IKN was based on several strategic considerations, such as its low disaster risk and geographically central position within Indonesia [5] and substantial ecological potential to be developed into a green and smart city [6]. Furthermore, the capital relocation is expected to create a new economic growth pole beyond Java Island, which currently accommodates more than 56% of the population and contributes 58% of the Regional Gross Domestic Product (GRDP) per capita [7]. The government envisions IKN as a prototype of a future-oriented city that integrates the principles of a smart city, green economy, and digital governance [6].
The capital relocation also symbolizes a broader effort toward administrative and symbolic decentralization, expected to strengthen national identity and accelerate the transition toward sustainable development [8, 9]. The concept of the IKN capital city emphasizes harmony between humans and nature, with approximately 75% of its territory designated as green areas [10-12]. This initiative aligns with Indonesia’s commitment to achieving net-zero emissions by 2060 [7, 13]. Within the framework of smart and green economy principles, the availability of clean water management emerges as one of the key challenges in the development of a sustainable new capital city in East Kalimantan [14, 15]. Land-use conversion and rapid development in the IKN and Sepaku region have the potential to alter the hydrological functions of the watershed by reducing infiltration and increasing surface runoff [11, 16, 17]. These changes can affect raw water quality and the ability of aquatic ecosystems to maintain their functions [18-21]. Ecosystem-based management and nature-based solutions, including riverbank restoration, protection of recharge areas, erosion control, and artificial retention systems, are integral to long-term water planning [22, 23].
The prospective capital area is characterized by complex hydrological conditions, with a high dependency on the Sepaku Watershed (DAS Sepaku), which is particularly vulnerable to land-use changes and sedimentation. The potential raw water supply from the Sepaku Semoi Dam is estimated at 2,500 liters per second [24]. However, the clean water demand during the initial development phase of IKN is projected to reach 4,000 liters per second and further increase to approximately 12,000 liters per second by 2045 [25]. This indicates a potential clean water deficit unless accompanied by comprehensive water conservation and efficiency strategies.
Beyond meeting the water needs of the IKN population, ensuring equitable access for surrounding communities must remain a priority, because low-income households lacking piped water connections may face additional costs to obtain water that is difficult to access and of uncertain quality [14]. Simanjuntak et al. [26] reported that approximately 43% of households in the IKN buffer zones still rely on shallow groundwater sources that are highly susceptible to contamination and declining quality. This situation could exacerbate socio-ecological disparities between local residents and new settlers, unless IKN development continues to accommodate the needs and priorities of affected local residents, including basic access to clean water [27]. The Indonesian government, under the IKN Authority, has developed an integrated water management strategy based on the principles of Water Sensitive Urban Design (WSUD) to ensure the sustainability of water resources in the region. This approach includes the construction of green infrastructure, rainwater harvesting systems, wastewater recycling, and the conservation of infiltration zones surrounding the Sepaku Semoi Dam [24, 28]. However, the effectiveness of these policies largely depends on cross-sectoral coordination and active participation of local communities in safeguarding aquatic ecosystems, particularly amid the rapid urbanization accompanying the IKN development process [29].
Equitable access to clean water remains a critical aspect of the new capital’s development trajectory [15, 30]. Disparities in water distribution between the IKN core area and its surrounding zones may create social and ecological inequalities, especially for local communities that have historically depended on natural water sources [31]. Public perception studies indicate that, despite optimism toward the modernization of water infrastructure, there remains considerable concern regarding the long-term sustainability of water resources due to environmental degradation and rapid land-use change [32]. Hence, a development approach solely focused on technical efficiency should be balanced with social justice and ecosystem-based management to prevent the emergence of new inequalities in the future. The urgency of sustainable clean water provision in IKN should be viewed not only as a technical infrastructure challenge but also as a socio-environmental issue requiring multi-stakeholder collaboration.
Previous studies indicate that the development of IKN has been extensively researched as a new urban transformation project that emphasizes a green city agenda, smart city initiatives, forest city concepts, energy efficiency, emissions reduction, environmentally friendly construction, and smart building systems to support urban sustainability [33-36]. Other studies have also highlighted the social dimensions of IKN development, such as the rights of indigenous peoples, land conflicts, and the importance of inclusive governance to ensure that development does not lead to the marginalization of affected communities [11, 27, 37]. Regarding water resources, previous studies have addressed the adequacy of raw water supply through 2045, the potential for long-term deficits, the role of the Sepaku Semoi Dam, rainwater harvesting, the seasonal nature of the Sepaku River’s water quality, integrated flood control, and nature-based solutions to maintain water quality and the ecological resilience of the region [17, 23, 25, 38, 39]. However, these studies still tend to address urban planning, water infrastructure, environmental quality, and social impacts separately. They have not yet comprehensively integrated the relationships between the development of the IKN, the availability and quality of raw water, household economic affordability, and the socioeconomic impacts on disparities in access to clean water among local communities in the IKN area and surrounding settlements.
This study contributes by integrating evidence across three interrelated analytical scales, such as household affordability and water-use behavior at the micro level, water-source quality constraints at the local environmental level, and long-term water supply-demand dynamics at the regional level. This multiscalar approach addresses gaps in understanding the interconnections among household drinking water access, ecological change, and sustainable water governance, thereby providing a basis for assessing water-access disparities. Therefore, a remaining research gap is the need for an integrated analysis of equitable and sustainable access to clean water that positions local communities as the primary stakeholders in water governance within the National Capital’s buffer zone.
Active local participation, transparent water governance, and the implementation of Integrated Water Resources Management (IWRM) principles are essential to achieving water justice within the IKN region. IKN can only succeed as a “sustainable forest city” if water ecosystem sustainability becomes the basis of spatial planning and resource management. Strengthening inclusive and adaptive water governance represents a strategic pathway toward a just, green, and water-resilient future city. This study bridges and contextualizes the existing gap between community experiences and actual water availability in IKN. Moreover, given its adoption of smart city, green economy, and digital governance frameworks, water resources play a crucial role in supporting the sustainable development of Indonesia’s new capital city.
1.1 Research urgency
The issue of clean water availability and affordability in the IKN region is closely linked to the environmental and socio-economic dimensions of the surrounding communities [30, 40]. Local residents in buffer zones such as Sepaku and Samboja Districts generally belong to lower-middle-income groups, which affects their ability to access adequate clean water services [41]. Dependence on dug wells and untreated surface water sources remains high, while the cost of piped water connections and tariffs is perceived as burdensome by the majority of households [25]. Therefore, an economic affordability analysis of clean water access becomes a crucial aspect in understanding potential social inequalities that may arise between indigenous residents and new settlers of IKN in the future.
Based on an environmental perspective, the availability of clean water sources in terms of quality, quantity, and continuity constitutes a critical issue for ensuring proper sanitation and sustainable water supply within the IKN and adjacent communities [42]. Water quality in the Sepaku Watershed and Sepaku Semoi Dam has shown an increasing trend in turbidity, primarily due to land conversion and intensive construction activities. On the other hand, the current raw water availability of approximately 2,500 liters per second remains insufficient to meet the projected long-term demand of 12,000 liters per second by 2045 [25]. This supply instability poses a significant risk to the continuity of clean water services, both in the core IKN area and in its buffer zones.
Given these conditions, there is an urgent need to examine water inequity and local community perceptions regarding the achievement of sustainable clean water access: A case study of IKN, Indonesia. Accordingly, this study seeks to address the following research questions:
(1) What are the socio-economic characteristics of local communities in relation to the affordability of clean water access?
(2) What are the key factors influencing the quality, quantity, and continuity of raw water sources to meet IKN’s clean water needs?
(3) How do gaps between clean water demand and supply reflect the sustainability of water resources in the IKN area?
1.2 Overview of research location
IKN, Indonesia, is located within the administrative areas of North Penajam Paser Regency and partly in Kutai Kartanegara Regency, East Kalimantan Province, Indonesia [43]. The site lies between two major cities, Balikpapan and Samarinda, covering a total area of approximately 256,142 hectares, which includes the central government core area of 6,600 hectares [38, 44]. The selection of this location was based on geostrategic considerations due to its position at the center of the Indonesian archipelago, stable geological conditions, and lower natural disaster risks compared to Java Island. Moreover, the region’s undulating topography and numerous river systems make it highly suitable for development as an ecologically oriented and environmentally sustainable city [45].
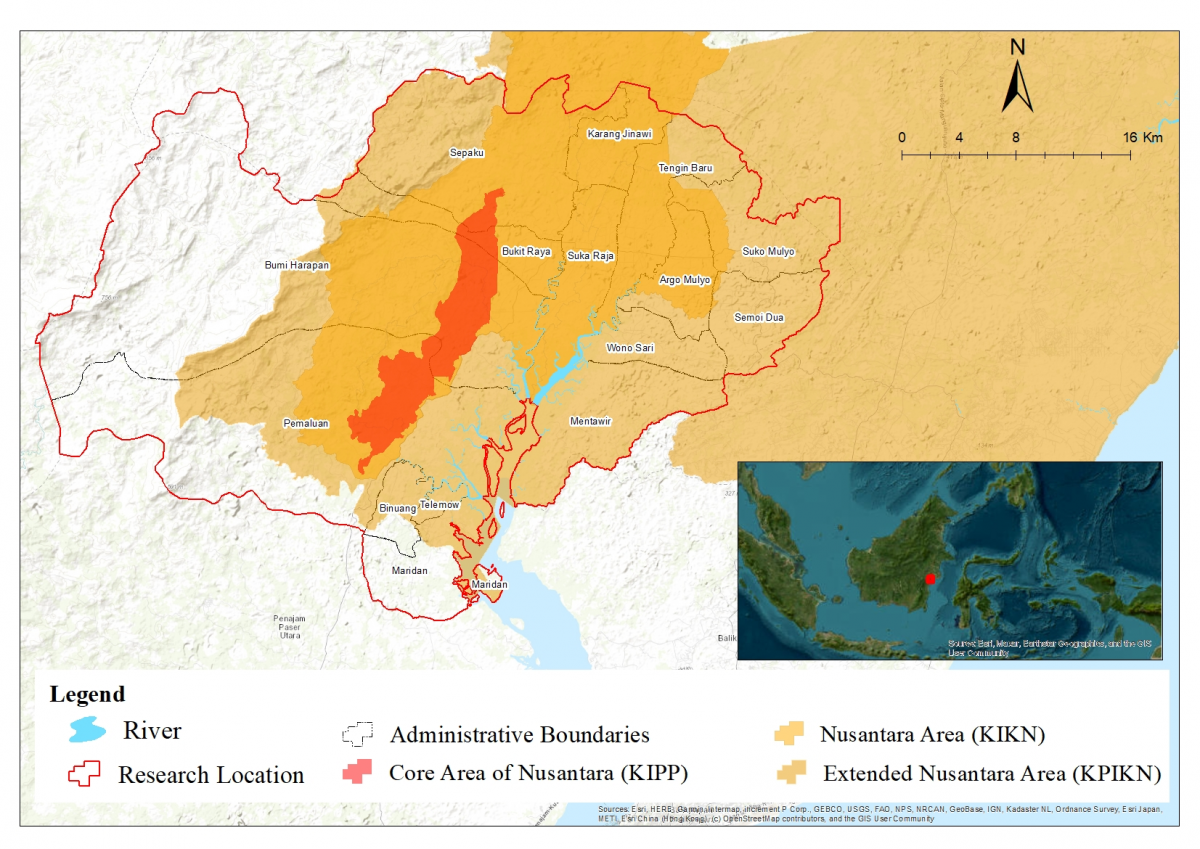
Figure 1. The Nusantara Capital City (IKN) in North Penajam Paser Regency and partly in Kutai Kartanegara Regency, East Kalimantan Province, Indonesia
Figure 1 illustrates the location of the IKN, situated in Sepaku District, Penajam Paser Utara Regency, East Kalimantan Province. The area marked in red represents the Core Government Area (Kawasan Inti Pusat Pemerintahan, KIPP), which serves as the central hub of governmental activities within IKN. The orange area denotes the Nusantara Area (Kawasan Ibu Kota Nusantara, KIKN), while the light-yellow area indicates the Extended Nusantara Area (KPIKN), functioning as a supporting zone for the broader development of the IKN region. Sepaku District holds a strategic position as it lies at the centre of the IKN development area and is traversed by major rivers such as the Sepaku River and the Tengin River, shown in light blue on the map. The district consists of 15 villages (11 villages and 4 urban villages), with Bukit Raya Village and Sepaku Village being the closest settlements to the KIPP. The hydrological approach to the primary raw water source for the clean water supply in the IKN relies on the Sepaku Semoi Dam, located in Sepaku Subdistrict, North Penajam Paser Regency [46]. This dam has a storage capacity of approximately 11 million cubic meters and a raw water discharge of 2,500 liters per second during its initial operational phase [25].
The raw water from the dam is treated at the Sepaku Semoi Water Treatment Plant before being distributed to the IKN core area and its supporting zones through a modern pipeline network [47]. In addition to the main dam, several alternative water sources, such as the Sepaku River and rainwater harvesting systems, are being developed to ensure supply continuity, particularly during the dry season [25, 46]. This strategy forms part of the WSUD concept implemented in IKN’s planning framework to maintain water resource sustainability and long-term environmental resilience.
The water management strategy for IKN adopts the WSUD concept, emphasizing rainwater utilization, watershed conservation, and domestic wastewater recycling systems [48]. The implementation of this concept aims to balance human needs with the sustainability of aquatic ecosystems in East Kalimantan. Additionally, the city’s clean water infrastructure will be gradually expanded through the construction of modern distribution pipelines and water treatment plants in several key zones [7]. The government also collaborates with the private sector in managing the drinking water supply system through public–private partnership schemes to enhance financial efficiency and service quality [49]. Nonetheless, a major challenge remains in ensuring equitable access to water among local communities in buffer areas, many of whom currently lack piped water systems. Such inequality could lead to social disparities if not addressed through inclusive water policies [30].
The clean water management in IKN represents an integrative effort between modern infrastructure development and environmental protection. The government’s strategy of positioning water as a central element in spatial planning reflects a strong commitment toward sustainable urban development. However, the success of IKN’s water management system will largely depend on effective inter-agency coordination, rigorous water quality monitoring, and active community participation in water resource conservation. If these social, technical, and ecological aspects can be harmoniously integrated, IKN has the potential to become a model for sustainable urban water management in tropical regions [50].
2.1 Data collection
To address the research questions, this research employed a mixed-method approach by combining qualitative and quantitative analyses and addressing the three complementary research methods to answer each component of the research inquiry, which aims to bridge the gap between water demand and availability in assessing water sustainability in the IKN against buffer zone districts using a dynamic systems perspective. The socio-economic approach was conducted through interviews and questionnaires, while the assessment of raw water resources was based on laboratory analyses to evaluate the quality of raw water at selected sampling points (quality), and community perceptions of water reliability were measured using a questionnaire. Meanwhile, system dynamics modelling was developed based on the researchers’ interpretation, supported by secondary data obtained from government agencies, private sector reports, and relevant scholarly publications.
Table 1. Population proportion across the 11 villages and 4 urban villages
|
No. |
Subdistrict |
Number of Households |
Population Proportion (%) |
Number of Respondents |
|
Villages |
||||
|
1 |
Karang Jinawi |
398 |
3 |
11 |
|
2 |
Telemow |
1249 |
9 |
35 |
|
3 |
Binuang |
765 |
6 |
22 |
|
4 |
Bumi Harapan |
789 |
6 |
22 |
|
5 |
Wonosari |
459 |
3 |
13 |
|
6 |
Semoi Dua |
1129 |
8 |
32 |
|
7 |
Argo Mulyo |
1169 |
9 |
33 |
|
8 |
Suko Mulyo |
758 |
6 |
22 |
|
9 |
Tengin Baru |
1430 |
11 |
41 |
|
10 |
Sukaraja |
1451 |
11 |
41 |
|
11 |
Bukit Raya |
1040 |
8 |
30 |
|
Urban Villages |
||||
|
1 |
Maridan |
1389 |
10 |
39 |
|
2 |
Mentawir |
271 |
2 |
8 |
|
3 |
Pemaluan |
628 |
5 |
18 |
|
4 |
Sepaku |
641 |
5 |
18 |
|
Total |
13566 |
100 |
385 |
|
2.1.1 Socio-economic factors for accessibility of clean water to the community
This study was conducted in Sepaku District to provide the socio-economic structure of the region, which is significantly impacted by the development of the IKN. The research design employed a cross-sectional household survey approach to capture the current conditions of clean water usage, socio-demographic characteristics, and service accessibility. The target population consisted of native residents permanently living in each village or ward within Sepaku Subdistrict. Based on the Krejcie and Morgan sampling table, 350 respondents were required. To anticipate potential non-responses or unusable questionnaires, a 10% allowance was added to the minimum sample size. Therefore, the final target sample was increased to 385 respondents [350 + (10% × 350) = 385]. The inclusion criterion for respondents was permanent residency within the study area. Respondents were selected from among heads of household or adult household members aged 18 years or older who understand household water procurement, income, and expenditures. Samples were collected using stratified proportional sampling at the village/ward level. Each village or ward was treated as a stratum, with sample allocation following the proportional population distribution of each stratum. The sample size for each stratum was calculated using the following Eq. (1):
$n_h=\frac{N_h}{N} \times n$ (1)
where, $n_h$ is the sample size for the village/ward h, $N_h$ is the population of the village/ward h, N is the total population of Sepaku Subdistrict, and n is the total sample (385 respondents; Table 1).
Households within each stratum were selected through simple random sampling from the household sampling frame. Due to the proportional allocation, descriptive estimates were self-weighted at the subdistrict level. Data were collected using a structured questionnaire that was pretested outside the sample area to assess readability and internal consistency. The main variables measured in the study included:
•Socio-demographics, such as age (years), occupation type (categorical), highest education level (categorical), and household size (persons).
•Household economics, such as average monthly income (IDR), average monthly expenditures (IDR), monthly expenditure on clean water (IDR), and monthly expenditure on drinking water (IDR).
The questionnaire records expenditures on clean water and drinking water as separate components so that they can be compared with one another. Expenditures on clean water include water used for sanitation, while expenditures on drinking water include water consumed for drinking and cooking. Next, expenditures on drinking water and clean water are summed and then compared to the UN’s water affordability standard, which should not exceed 3 percent of household income [51]. Household monthly income categories are converted into numerical values using the midpoint of a range.
2.1.2 Identification of the reliability of raw water resources
To address the challenges of ensuring the reliability of raw water sources in meeting the clean water demand in the IKN and existing community water supplies, a triangulation approach was employed by combining two (2) types of data: water quality samples were collected once at three purposively selected locations, one location on the Sepaku River and two household wells in Sepaku and Bukit Raya. These locations were selected to represent one surface water source and two groundwater sources used for domestic purposes by the community in the IKN development area. This study design was intended to provide a preliminary location-specific overview and was not designed to estimate the prevalence of water quality across the entire IKN buffer zone or seasonal variability. Water samples were collected during the field survey period under normal weather conditions. Samples were collected using standard sampling procedures and stored in appropriate containers prior to laboratory analysis. The laboratory tests included both physico-chemical parameters and microbiological indicators. The results were compared against national water quality standards: groundwater quality was evaluated based on the Regulation of the Minister of Health of the Republic of Indonesia No. 2 of 2023 concerning the implementation of Government Regulation No. 66 of 2014 on Environmental Health, while surface water quality followed the provisions of Government Regulation No. 22 of 2021 on Environmental Protection and Management.
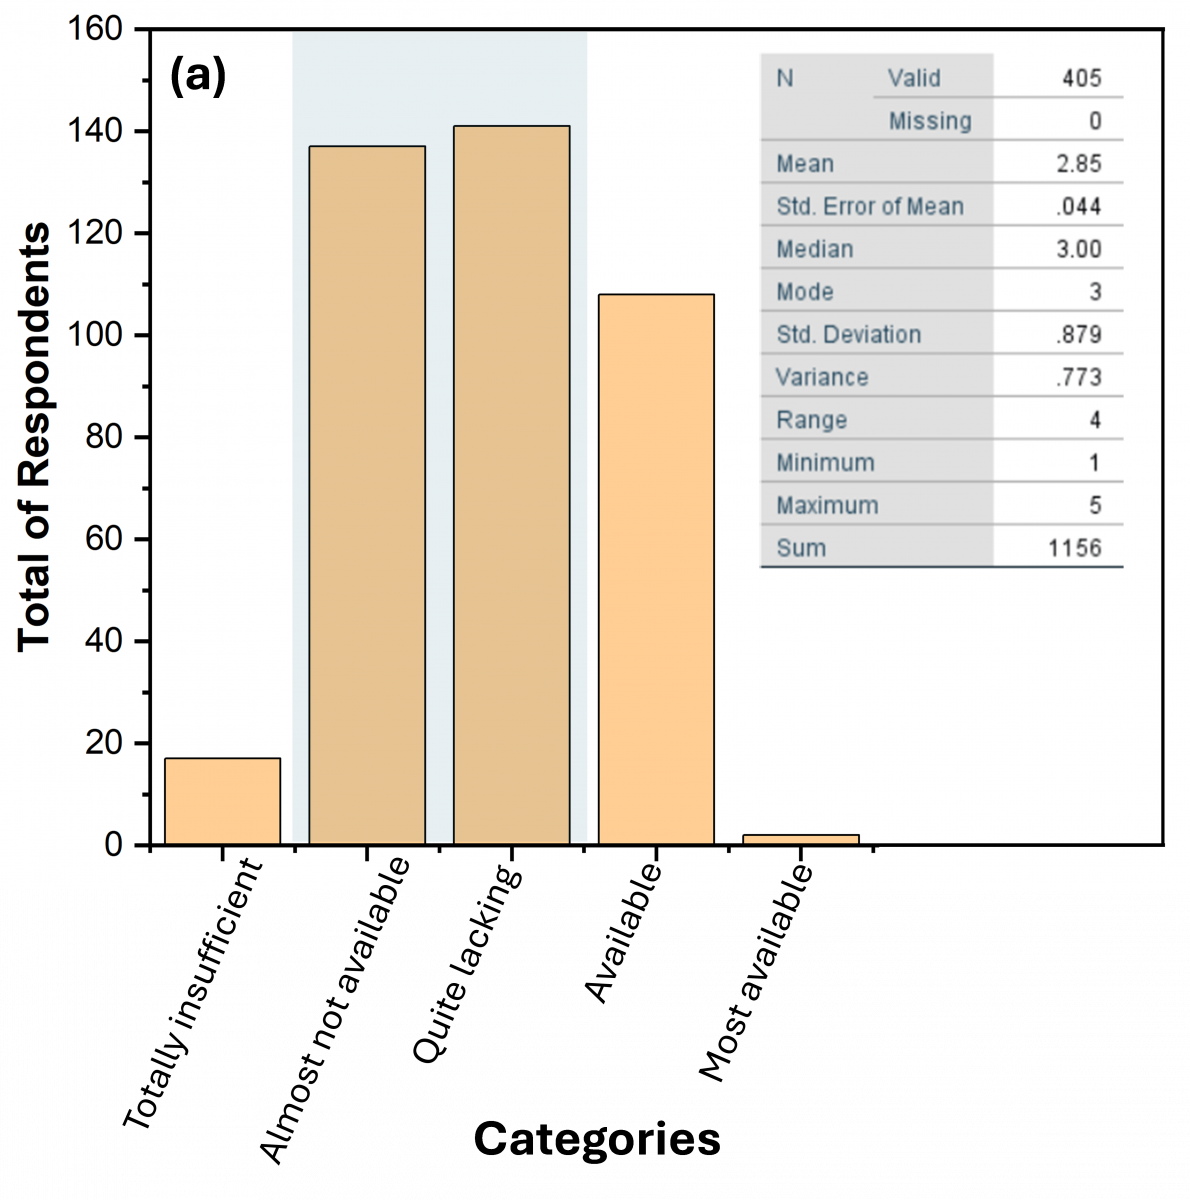
Furthermore, a community perception survey was conducted using a single-item, five-point ordinal measure with 405 respondents (1 = Totally insufficient; 2 = Almost not available; 3 = Quite lacking; 4 = Available; and 5 = Most available) to assess the community’s perception in Sepaku Subdistrict regarding water availability and accessibility in terms of time and distance. The number of actual respondents was increased to strengthen the reliability and validity of the survey results [52]. Respondents were selected using the same village-level stratification frame, resulting in 405 valid responses for descriptive analysis of perceptions. The survey aimed to capture how residents perceive the difficulty of access to clean water for drinking and domestic activities. Meanwhile, accessibility was assessed through respondents’ perceptions of the ease of access to primary water sources based on travel time and distance (1 = Very difficult: >30 minutes/day; 2 = Difficult: 15–30 minutes/day; 3 = Sufficient: 5–15 minutes/day; 4 = Easy: <5 minutes; and 5 = Very easy (affordability).
2.1.3 System dynamics model for analyzing water availability and demand in IKN and surrounding areas
A system dynamics modelling approach was employed to simulate the interactions between raw water availability (supply) and water demand from both the IKN and the surrounding local communities (Sepaku district). The model integrates population projections through 2045 and the functional components of water demand. The main model outputs include annual water surplus or deficit, which is demonstrated using PowerSim Studio 10 software. Supporting datasets were incorporated into the system dynamics model to analyze the evolving relationship between the water demand–supply gap in IKN between Sepaku district and the sustainability of water resources in IKN and its neighbouring areas. The primary data inputs for the model included raw water availability (supply) and continuity, demographic data, and assumptions regarding water demand and losses.
2.2 Data analysis
2.2.1 Data analysis for qualitative and quantitative perspectives
This study employed a quantitative descriptive approach to provide a comprehensive profile of socio-economic characteristics among the local residents of Sepaku District, East Kalimantan. The analysis was structured to capture both continuous and categorical variables representing demographic and economic aspects related to water access and consumption. Meanwhile, the analysis of water quality employed both laboratory-based assessments and community-based perception surveys. Each water quality parameter was compared against national regulatory standards. For surface water, comparisons were made using the Government Regulation of the Republic of Indonesia No. 22 of 2021 concerning Environmental Protection and Management. For groundwater quality, the parameters were assessed according to the Minister of Health Regulation No. 2 of 2023 on Environmental Health Standards, which operationalizes Government Regulation No. 66 of 2014.
Each parameter was classified dichotomously as compliant or non-compliant with applicable standards. The descriptive data were processed using SPSS version 26 to produce comprehensive data presentations, which were then presented in several formats to ensure clarity and readability. Visualizations included pie charts to display the distribution of socio-economic categories, as well as boxplots to depict the distribution of social (demographic) and economic aspects (income, outcome, and household expenditure on clean water and drinking water consumption).
2.2.2 System dynamics modelling framework
A system dynamics modelling approach was employed to simulate the interactions between population growth, water demand, and water supply capacity in the context of the IKN and surrounding local communities within Sepaku District. The model was developed to project annual dynamics from 2020 to 2045 using a discrete-time framework that was simulated using PowerSIM Studio 10. This assessment enabled a policy-relevant interpretation of the model results, linking water supply planning with long-term sustainability outcomes between the IKN and Sepaku District region.
3.1 Socio-economic demography of the Nusantara Capital City surrounding settlements
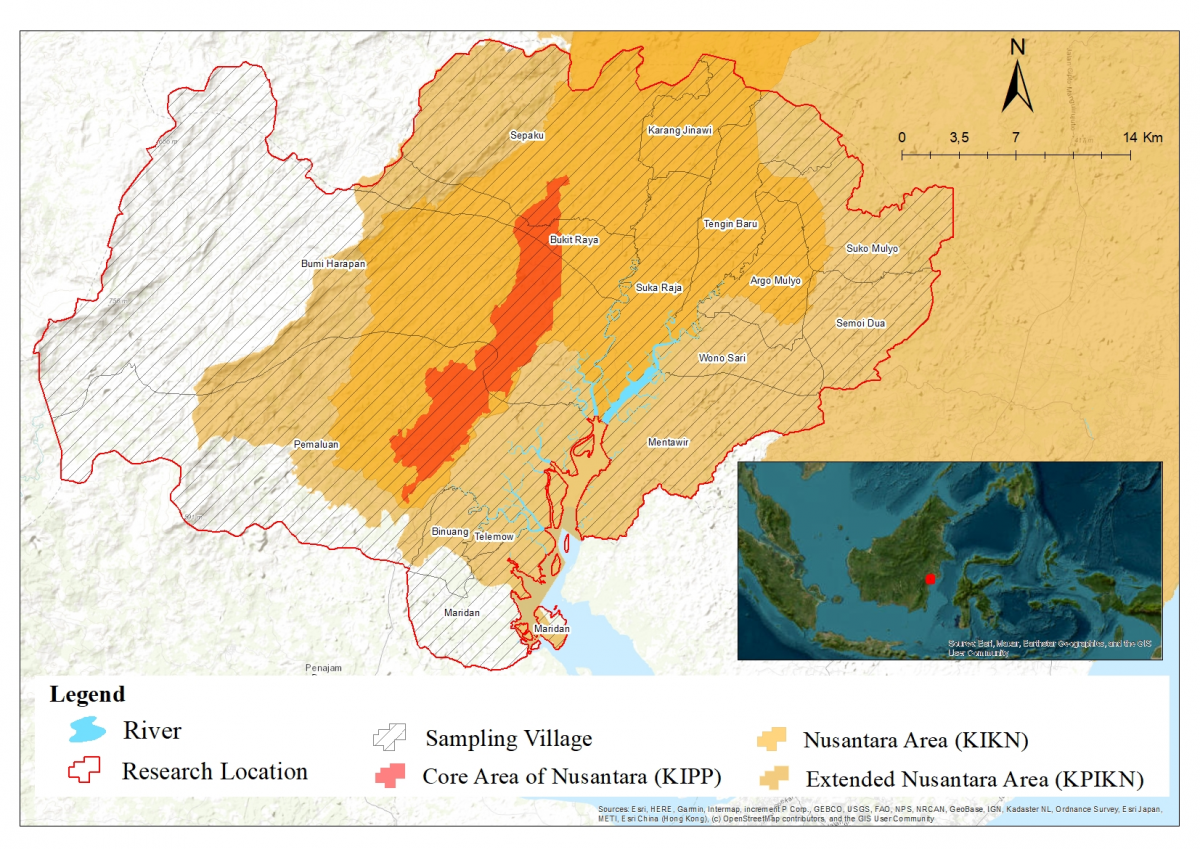
The socio-economic and demographic survey conducted in 11 villages and 4 urban villages within Sepaku District provides insight into the socio-economic structure of the region, which is significantly impacted by the development of the IKN. The survey covers a broad geographical area, representing the buffer zone of IKN, and includes both urban and rural communities. Figure 2 shows the location of the survey areas, encompassing administrative boundaries, rivers, and villages sampled for demographic and socio-economic analysis.
Figure 2. Sampling location for demographic analysis
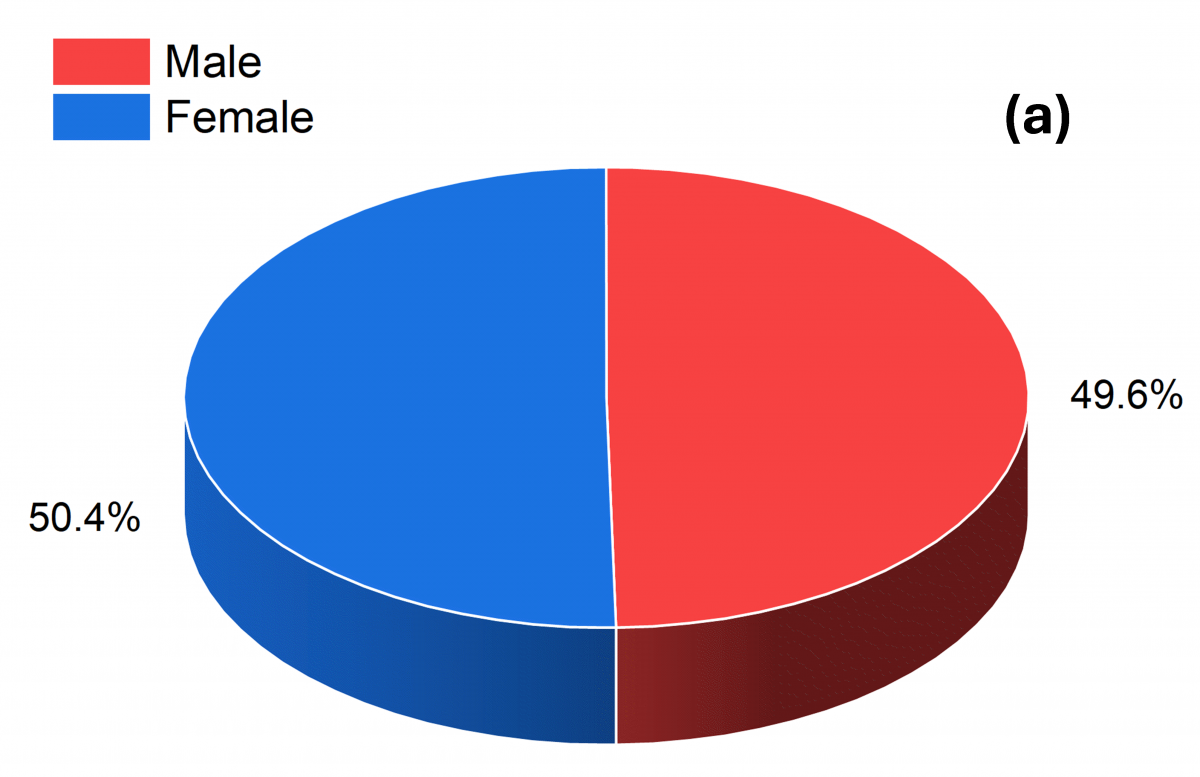
The demographic profile of household respondents in Sepaku District (Table 1), as part of the IKN area, reflects a predominantly mid-productive-age population. Based on the questionnaire responses from a total sample of 385 respondents, three (3) duplicate entries were identified; therefore, only 382 valid responses were included in the data analysis. Among the 382 respondents, females constituted 50.4%, while males accounted for 49.6% (Figure 3(a)). This slight female dominance can be attributed to the data collection being conducted during working hours, when most male household heads were engaged in employment activities. Moreover, a gender-sensitive approach was adopted in this study, recognizing that women often bear the physical and time burden of water collection, while also playing a crucial role in determining the perceived quality and adequacy of household water for daily consumption.
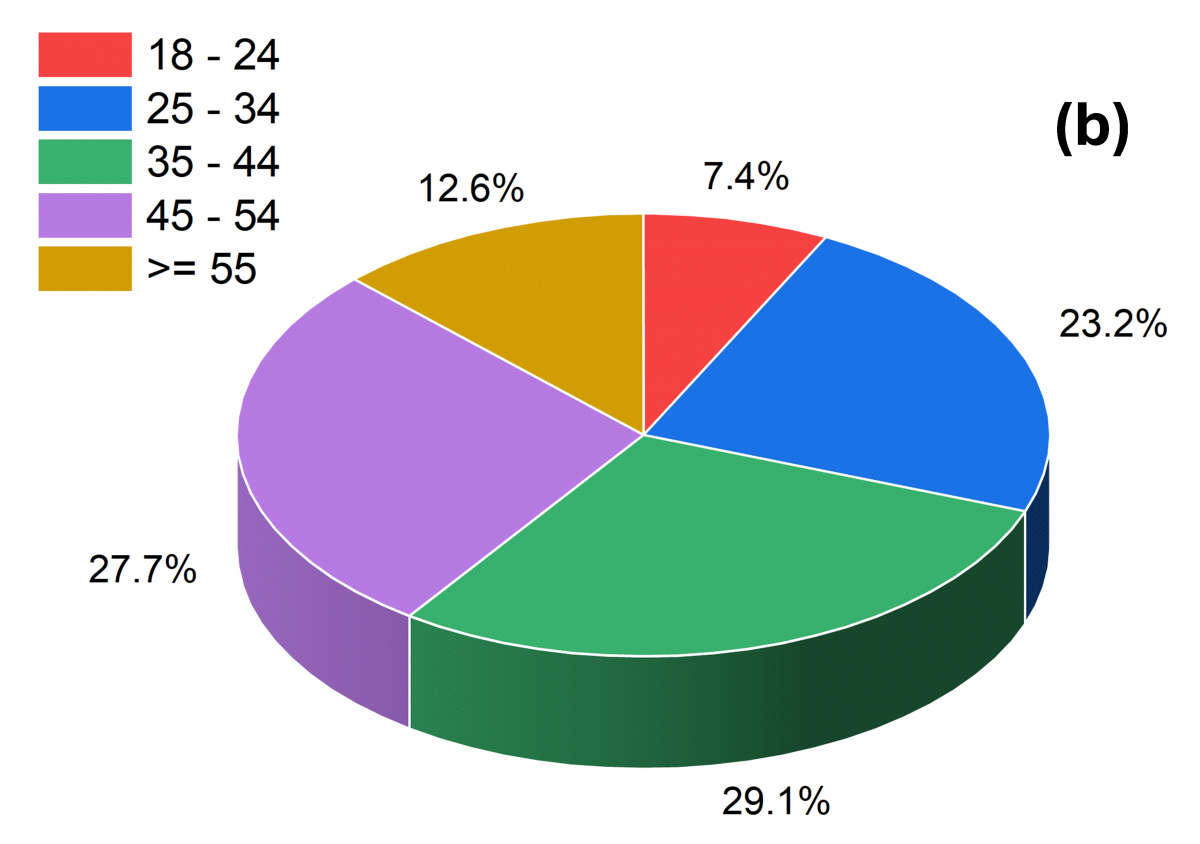
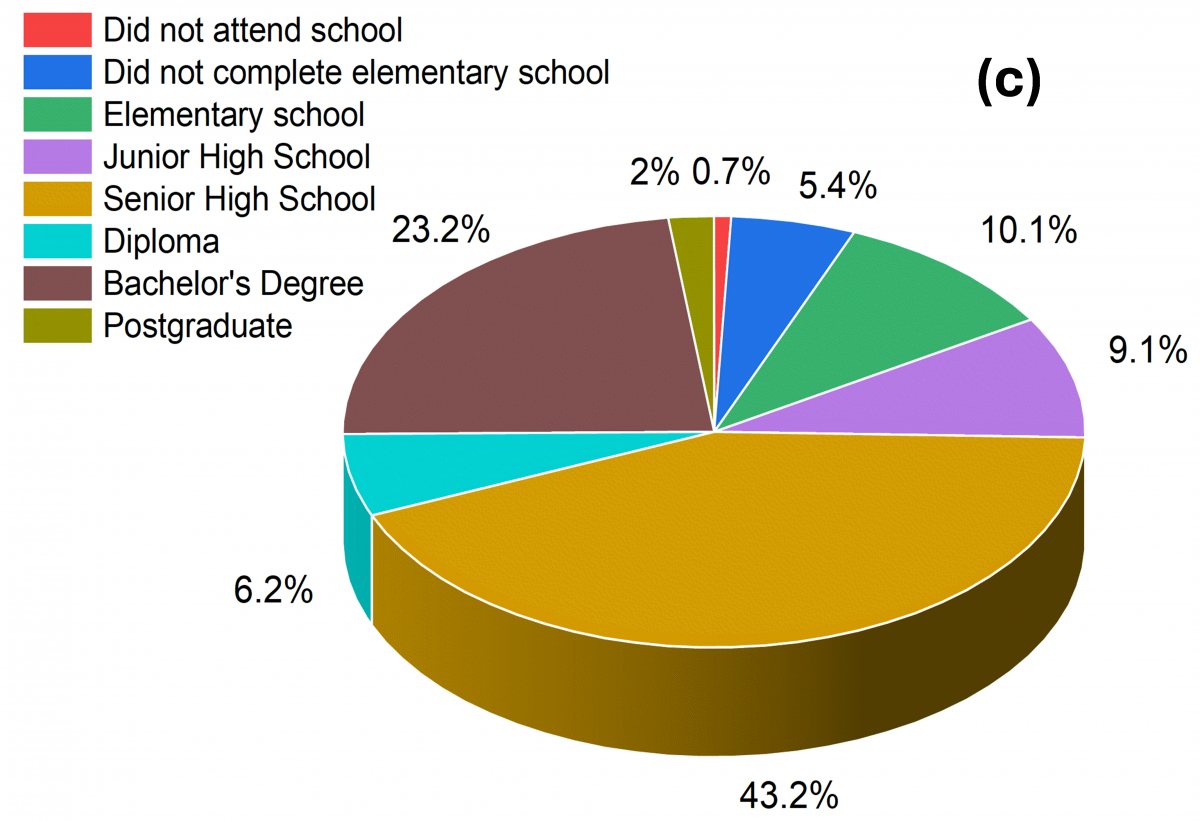
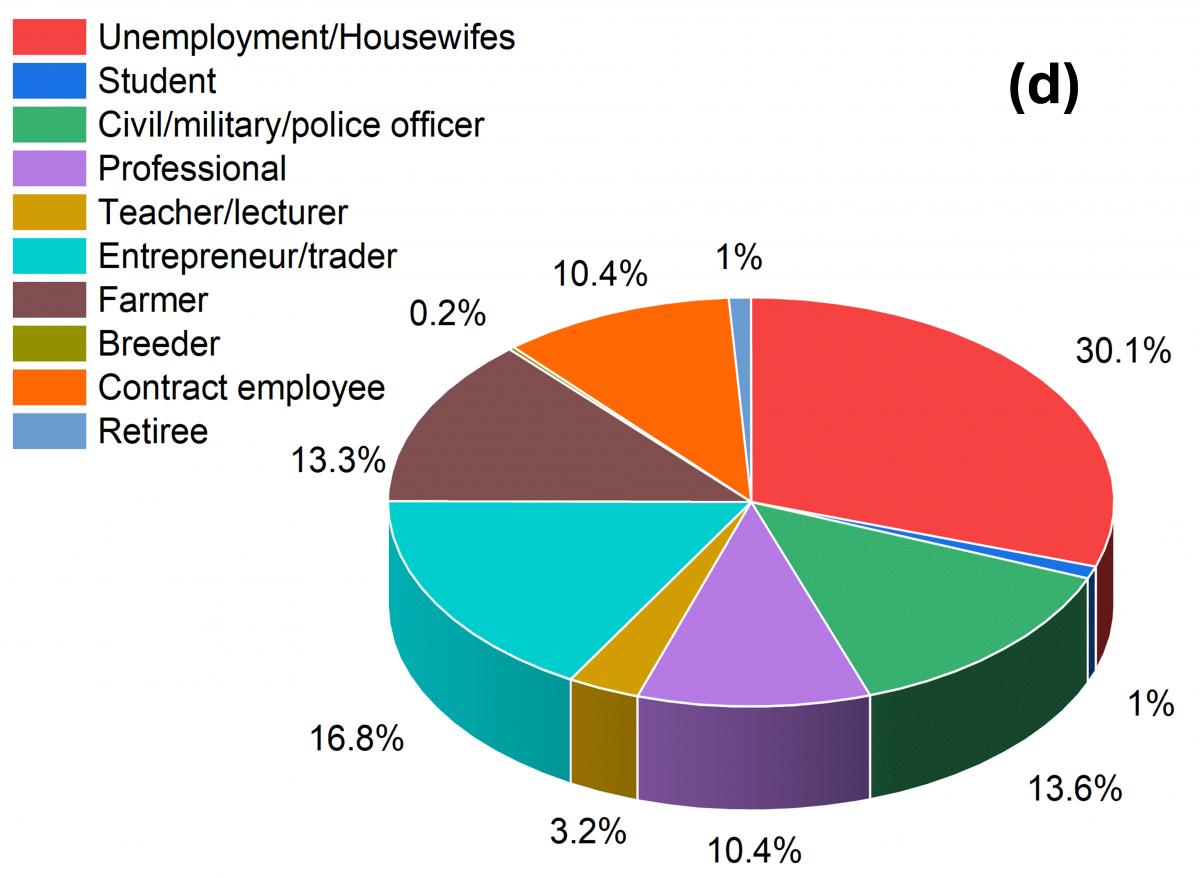
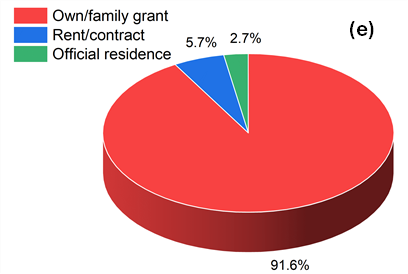
As shown in Table 2, respondents were predominantly within the 35–44 age group (Figure 3(b)), with most having attained a senior high school education (Figure 3(c)). Regarding employment status (Figure 3(d)), the majority of women were housewives (30.1%), while male household heads were mainly entrepreneurs (16.8%), civil officers (13.6%), and farmers (13.3%). This composition reflects a transitional community structure in a newly developing region, where local residents and incoming workers from the construction and service sectors converge within a shared socio-economic space. The housing status (Figure 3(e)), which is largely owner-occupied or family-granted, indicates a relatively strong spatial attachment to the area and suggests that most households are not in temporary living arrangements. Urban water governance in IKN was shaped by this demographic structure, resembling that of emerging and peri-urban cities undergoing rapid development, where productive-age groups with medium-level education and non-permanent employment constitute the backbone of household water consumption and form the primary target group for clean water provision policies.
Table 2. Demographic analysis in Sepaku Village
|
Demographic Characteristics |
Mean |
Modus |
S.D. Statistic |
|
|
Statistic |
S.D. |
|||
|
Gender |
1.5 |
0.025 |
Female |
0.501 |
|
Age |
3.15 |
0.056 |
35–44 |
1.136 |
|
Education |
5.10 |
0.075 |
High school |
1.506 |
|
Employment status |
4.41 |
0.148 |
Un |
2.987 |
|
Residential status |
1.11 |
0.019 |
Own/family grant |
0.392 |
|
Salary/Income |
2.81 |
0.052 |
60–180 USD |
1.054 |
|
Outcome Household |
2.61 |
0.040 |
60–180 USD |
0.796 |
|
Drinking Water Consumption |
3.20 |
0.043 |
6.0–15.0 USD |
0.865 |
|
Clean Water Consumption |
3.74 |
0.046 |
15.0–30.0 USD |
0.932 |
Figure 3. Socio-demographic characteristics of respondents in Sepaku District: (a) gender distribution, (b) age group distribution, (c) educational background, (d) employment status, and (e) housing ownership status
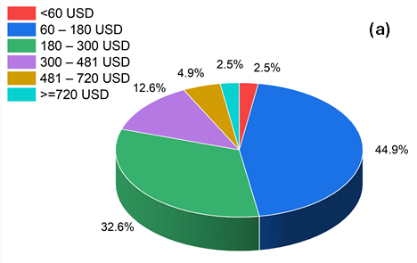
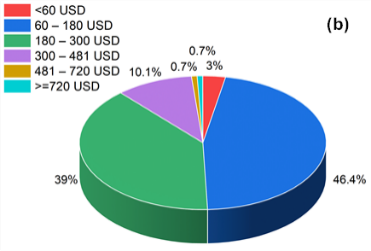
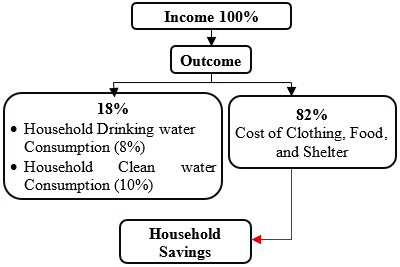
From an economic perspective, monthly household income was concentrated in the USD 60–180 category, accounting for 44.9% of respondents, followed by the USD 180–300 category at 32.6% (Figure 4(a)). Together, these two income categories represented 77.5% of the surveyed households, indicating that most respondents were concentrated in the lower monthly income categories used in this study. A similar pattern was observed for monthly household expenditure: 46.4% of households reported expenditures of USD 60–180, while 39.0% reported expenditures of USD 180–300 (Figure 4(b)). Collectively, these two expenditure categories accounted for 85.4% of respondents, indicating that household expenditures were predominantly concentrated between USD 60 and USD 300 per month. The relationship between income and household expenditure on clean and drinking water, as shown in Figure 5, reveals that respondents allocate approximately 10% of their monthly income for clean water and 8% for drinking water. This expenditure proportion reflects a relatively high economic burden compared to national urban household standards. The threshold of 3.0% is the most common value used to assess the risk of water affordability problems in developed economies, where households spending more than 3% of their resources on water are generally considered to have an affordability problem [51]. It implies that water access and affordability remain significant challenges for households in Sepaku District.
Figure 4. Monthly household income and expenditure distribution of respondents in Sepaku District: (a) monthly household income, and (b) monthly household expenditure
Figure 5. Monthly household expenditure on clean water and drinking water consumption
In this study, household income exhibits limited elasticity with respect to increases in water tariffs, implying that any rise in water service costs is likely to displace expenditure allocations from other essential needs. The conversion was performed by assigning the upper bound of each income category for household income as the representative value. This approach was selected as a conservative estimation method to avoid overestimating the proportion of water expenditure relative to household income. By using the highest value within each income interval, the calculated water-cost burden represents the minimum possible proportion of income allocated to water needs within each category.
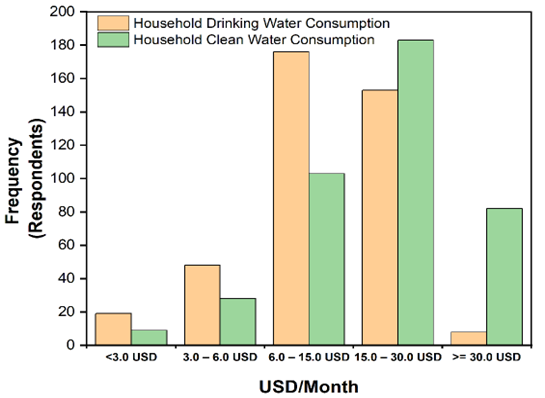
The data indicate that household economic outcomes remain within the same range as income levels, while monthly expenditures on drinking water and clean water range between USD 6–15 and USD 15–30, respectively. This pattern suggests that the proportion of water-related expenses relative to total income could undermine household economic stability, as stagnant income levels combined with high water costs may intensify the financial vulnerability of low- and middle-income families.
The diagram (Figure 6) illustrates the relationship between household income and expenditure outcomes. Income determines the allocation of household resources toward essential needs such as drinking water, food, clothing, and shelter, while the remaining portion after these expenditures constitutes household savings. When spending on clean drinking water increases, households tend to reduce expenditures on other necessities to retain some portion of disposable income (Figure 6). However, when income levels are equivalent to total expenditures, it indicates that households have little to no capacity for savings, reflecting a condition of economic vulnerability and limited financial resilience. Socio-economic disparities significantly affect people’s access to clean water.
Figure 6. Community economic flow to meet the criteria for dynamic survival
This is in line with the results of Torio and Harris [14], who found that poor households without piped water connections may pay a premium cost for water that is more difficult to access with uncertain quality. In the present study, respondents allocated approximately 10% of their monthly income to clean water and 8% to drinking water, indicating a substantial affordability burden among low-income households. According to Indonesian Government Regulation No. 2 of 2023 Regarding Implementing Regulations for Government Regulation No. 66 of 2014 on Environmental Health, water is classified based on its intended use, i.e., clean water and drinking water. Clean water is primarily used for sanitation, whereas drinking water is intended for consumption. The urgency of large-scale infrastructure in the IKN also affects the dynamics of local welfare, including the clean water demand as reported [34]. The government should make efforts through fair and sustainable water management policies for buffer communities and government centers. Another perspective from Setiadi and Pratiwiningrum [53] reports that studies in the urban area of Jakarta, Indonesia, as the national capital, show that better water management and fairer distribution can reduce socio-economic impacts, despite an unhealthy environmental carrying capacity (water pollution, air pollution, traffic congestion, and rapid urbanization).
The statistical analysis (Table 3) reveals that socioeconomic factors are more dominant than perception-based factors in influencing household water-cost burden. Household income showed a highly significant effect (Analysis of Variance (ANOVA), F = 180.144, p < 0.001), indicating that economic capacity is strongly associated with variations in water-related indicators. Education level also significantly influenced household water-cost burden (F = 6.849, p < 0.001), suggesting that households with different educational backgrounds experience varying levels of water-related burdens, which may be attributed to differences in income opportunities, employment stability, and access to improved water services.
Table 3. Comparative statistical analysis of the significance of water cost pressures
|
Variable |
Methods |
Test statistic (F/t) |
Sig. |
Summary |
Description |
|
Income |
ANOVA |
180.144 |
<0.001 |
Significant |
There are differences in water cost burden among income groups. |
|
Education |
ANOVA |
6.849 |
<0.001 |
Significant |
There is a difference between the group with lower levels of education (elementary and junior high school) and the group with higher levels of education (undergraduate and graduate). The group with lower levels of education tends to face higher water cost pressures than the group with higher levels of education. |
|
Quality of the main water source |
ANOVA |
3.197 |
0.024 |
Significant |
There are differences in water cost burden among primary water source quality levels. |
|
Groundwater/well water quality |
ANOVA |
1.222 |
0.301 |
Not significant |
There are no significant differences in water cost pressures among the various categories of groundwater or well water quality. |
|
Availability of water sources |
ANOVA |
1.946 |
0.122 |
Not significant |
The difference is not significant enough to conclude that water availability is associated with water cost pressure. |
|
Ease of access |
ANOVA |
2.099 |
0.080 |
Not significant |
There are no differences in water cost burdens across levels of water access condition. |
|
Difficulty in meeting clean water needs |
T-test |
0.826 |
0.409 |
Not significant |
There is no difference in water cost burden between households that report having difficulty meeting their clean water needs and those that do not. |
Note: ANOVA = analysis of variance; F = ANOVA test statistic; t = independent-samples t-test statistic; Sig. = p-value. Statistical significance was determined at p < 0.05.
Furthermore, the quality of the primary water source also significantly affected household water-cost burden (F = 3.197, p = 0.024), indicating that primary water source characteristics contribute to household expenditures on clean water. The better the quality of the primary water source used by a household, the lower the proportion of income that must be spent to meet drinking water and clean water needs. In contrast, groundwater quality, water availability, accessibility, and perceived difficulties in meeting water needs were not statistically significant (p > 0.05), suggesting that the physical presence of water resources alone does not necessarily determine equitable household water conditions. Water equity in the IKN buffer zone requires infrastructure development and socioeconomic interventions targeting vulnerable households.
3.2 Identification of the reliability of raw water resources
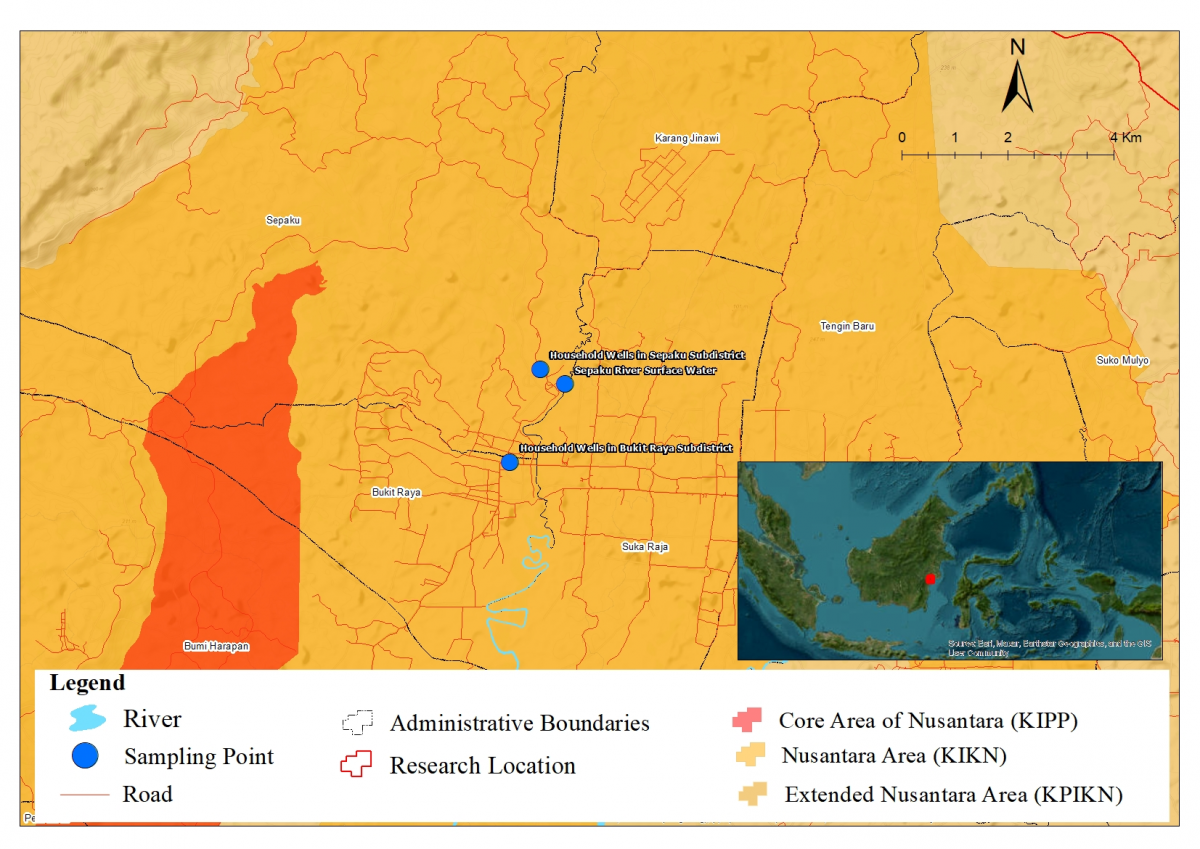
Figure 7 shows the locations of water sampling points in Sepaku Subdistrict, specifically within Sepaku Urban Village and Bukit Raya Village, Penajam Paser Utara Regency, which were purposively selected for their proximity to the KIPP development area. The Sepaku River serves as a major surface water source flowing through the KIPP area and constitutes an integral component of the hydrological system within the IKN region. The selection of sampling locations in Sepaku Urban Village, Bukit Raya Village, and the Sepaku River was based on their spatial proximity to the IKN government core area and the potential influence of development activities on groundwater and surface water quality. Since this water quality assessment was limited to three locations over a single sampling period, the data can provide a general overview and preliminary indication of water quality at those locations but cannot represent the entire IKN buffer zone or seasonal water quality conditions. These sites represent the environmental conditions most likely to be affected by construction and urbanization processes associated with IKN’s development. Groundwater samples from household wells were collected to assess the quality of water consumed by local residents, while surface water samples from the Sepaku River were analysed to monitor potential changes in raw water quality that could serve as a future water source for the government district. These locations were strategically chosen to provide the spatial dynamics of water quality within the core development zone of IKN.
Figure 7. Location of groundwater and surface water sampling points in the Nusantara Capital City (IKN) region
The quality of raw water was assessed at three locations (Sepaku River, Sepaku Village (groundwater), and Bukit Raya Village (groundwater)) to evaluate their physicochemical and biological characteristics. The analytical results were compared against the Indonesian Quality Standards stipulated in Government Regulation No. 22 of 2021 and the Minister of Health Regulation No. 2 of 2023. These results (Table 4) provide the reliability of both surface and groundwater sources as potential raw water supplies for domestic consumption. The Sepaku River sample is evaluated based on the Indonesian surface-water quality standard(*), while the Sepaku Village and Bukit Raya Village samples (groundwater sources) are compared with the relevant groundwater/domestic-water quality standard(**). Regarding the physical parameters, water temperature across all sampling points was relatively consistent (24.4–25.2 ℃), remaining within the acceptable ambient range. However, the TDS values showed noticeable variation between the Sepaku River (58.2 mg/L), Sepaku (72.6 mg/L), and Bukit Raya groundwater (172.0 mg/L), although all values were still below the permissible limit of 300 mg/L. The TSS exceeded the applicable threshold, particularly in domestic groundwater (360.9 mg/L in Sepaku Village and 254.4 mg/L in Bukit Raya Village), far exceeding the threshold of 3 mg/L, which indicates high turbidity and suspended particulate matter.
Table 4. The analysis of domestic and river water quality over sample locations
|
Parameter(s) |
Unit |
Sample Analysis Results |
Quality Standards*,** |
||
|
Sepaku River* |
Sepaku Village** |
Bukit Raya Village** |
|
||
|
Physic |
|||||
|
Temperature |
℃ |
25.2 |
24.4 |
24.4 |
±3 Ambient |
|
TDS |
mg/L |
58.2 |
72.6 |
172.0 |
<300** |
|
TSS |
mg/L |
46 |
360.9 |
254.4 |
50*; <3** |
|
|
|
|
|
|
|
|
Colour |
TCU |
54.3 |
22.5 |
25.4 |
50*; 10** |
|
Odor |
- |
Odourless |
Odourless |
Odourless |
Odourless*,** |
|
Chemical |
|||||
|
pH |
- |
7.11 |
6.72 |
7.15 |
6–9*; 6.5–8.5** |
|
Iron (Fe) |
mg/L |
0.7965 |
5.6341 |
2.9399 |
0*; 0.2** |
|
Manganese (Mn) |
mg/L |
0.0471 |
0.4330 |
3.2430 |
0*; 0.1** |
|
Nitrate (NO3-) |
mg/L |
7.0 |
2.8 |
3.1 |
10*; 20** |
|
Nitrite (NO2-) |
mg/L |
0.177 |
0.089 |
0.144 |
0.06*; 3** |
|
COD |
mg/L |
12 |
Does not include Indonesian Environmental Health Standards |
25* |
|
|
Phosphate (P) |
mg/L |
<0.03 |
0.2* |
||
|
Ammonia (NH3) |
mg/L |
0.17 |
0.2* |
||
|
Copper (Cu) |
mg/L |
<0.05 |
0.02* |
||
|
Zinc (Zn) |
mg/L |
0.17 |
0.05* |
||
|
Chloride (Cl-) |
mg/L |
4.9 |
300* |
||
|
Cyanide (CN-) |
mg/L |
<0.005 |
0.02* |
||
|
Fluoride (F-) |
mg/L |
<0.10 |
1.5* |
||
|
Sulphate (SO42-) |
mg/L |
13.2 |
300* |
||
|
Free Chlorine |
mg/L |
0.058 |
0.03* |
||
|
Chromium (Cr6+) |
mg/L |
<0.03 |
0.05* |
||
|
Phenol |
mg/L |
0.028 |
|
0.005* |
|
|
Biological |
|||||
|
Coliform MPN/100 mL |
|
9200 |
TNTC |
TNTC |
5000*; 0** |
|
Faecal Coliform MPN/100 mL |
|
46 |
TNTC |
5 |
1000*; 0** |
Note: TNTC: Too Numerous to Count; * Government Regulation of the Republic of Indonesia No. 22 of 2021 concerning Environmental Protection and Management; ** Minister of Health Regulation No. 2 of 2023 on Environmental Health Standards, which operationalizes Government Regulation No. 66 of 2014.
Furthermore, the colour intensity (54.3, 22.5, and 25.4 TCU) exceeded the standard limit of 10 TCU, indicating the presence of organic or inorganic materials (metal ions). In terms of chemical characteristics, pH levels (6.72–7.15) were within the acceptable range, indicating near-neutral water conditions. However, iron (Fe) and manganese (Mn) concentrations greatly exceeded the standards for both raw and drinking water, which may contribute to discoloration, metallic taste, and sediment deposition in domestic water systems. Meanwhile, nitrate (NO₃⁻) and nitrite (NO₂⁻) concentrations were still fulfilling their respective thresholds, suggesting limited contamination from agricultural runoff or wastewater infiltration. Other chemical constituents in the Sepaku River, including ammonia, phosphate, sulphate, chloride, cyanide, fluoride, and chromium, remained within permissible limits, although phenol slightly exceeded the standard (0.028 mg/L vs. the limit of 0.005 mg/L), indicating potential organic contamination. Biological analysis revealed substantial contamination at all sites (surface and groundwater). Total coliform was extremely high, reaching 9,200 MPN/100 mL in the Sepaku River and too numerous to count (TNTC) in both village wells, far exceeding the drinking water standard (0 MPN/100 mL). Likewise, faecal coliform concentrations surpassed acceptable limits, particularly in the Sepaku River (46 MPN/100 mL) and Sepaku Village (TNTC), confirming faecal contamination and the associated risk of waterborne diseases.
High levels of suspended solids, turbidity, and color at the assessed locations along the Sepaku River are consistent with previous evidence regarding spatial and seasonal variations in water quality within the Sepaku Watershed. Based on monitoring at 13 stations during different seasonal periods, Plamonia et al. [17] found that the raw water quality of the Sepaku River and the Sepaku Semoi Dam ranged from slightly to moderately polluted, with pollutant loads generally increasing during the rainy season. The authors reported that increased runoff, domestic wastewater discharge, land-based activities, and construction-related disturbances may contribute to elevated concentrations of TDS, TSS, organic pollutants, nutrients, and total coliforms [17].
Figure 8(a) illustrates the community’s perception in Sepaku District regarding the availability of water resources for daily needs, based on the question posed to respondents: “Is the water source you use sufficiently available?” The responses predominantly fell within the category of “Quite lacking”, indicating that water availability is still limited and has not yet reached an abundant condition. Most respondents were concentrated in the middle range between “Almost not available” and “Quite lacking”, suggesting a prevailing concern about potential shortages of clean water, particularly if water demand increases or during extended dry seasons. Only a small proportion of respondents perceived water as “Mostly available”, while a minority reported that the existing water supply was highly insufficient.
The assessment of accessibility (Figure 8(b)), based on the question “How easy is your access to clean water (time/distance)?”, reveals a similar pattern. The majority of respondents indicated that their access level was between “Difficult (15–30 minutes/day)” and “Sufficient (5–15 minutes/day)”. This result implies that many households still spend considerable time daily due to long waiting periods for water tank distribution. Only a small group reported “Very easy” access, indicating that the community has not yet experienced full ease in obtaining clean water. The water-related challenges in Sepaku encompass issues of volume, distance, time, and technical accessibility. On average, these responses indicate that many households perceived continuing constraints in water availability and accessibility.
Figure 8. Community’s perception in Sepaku District regarding water consumption: (a) water availability, and (b) water accessibility based on time and distance
3.3 System dynamics modelling framework for clean water accessibility
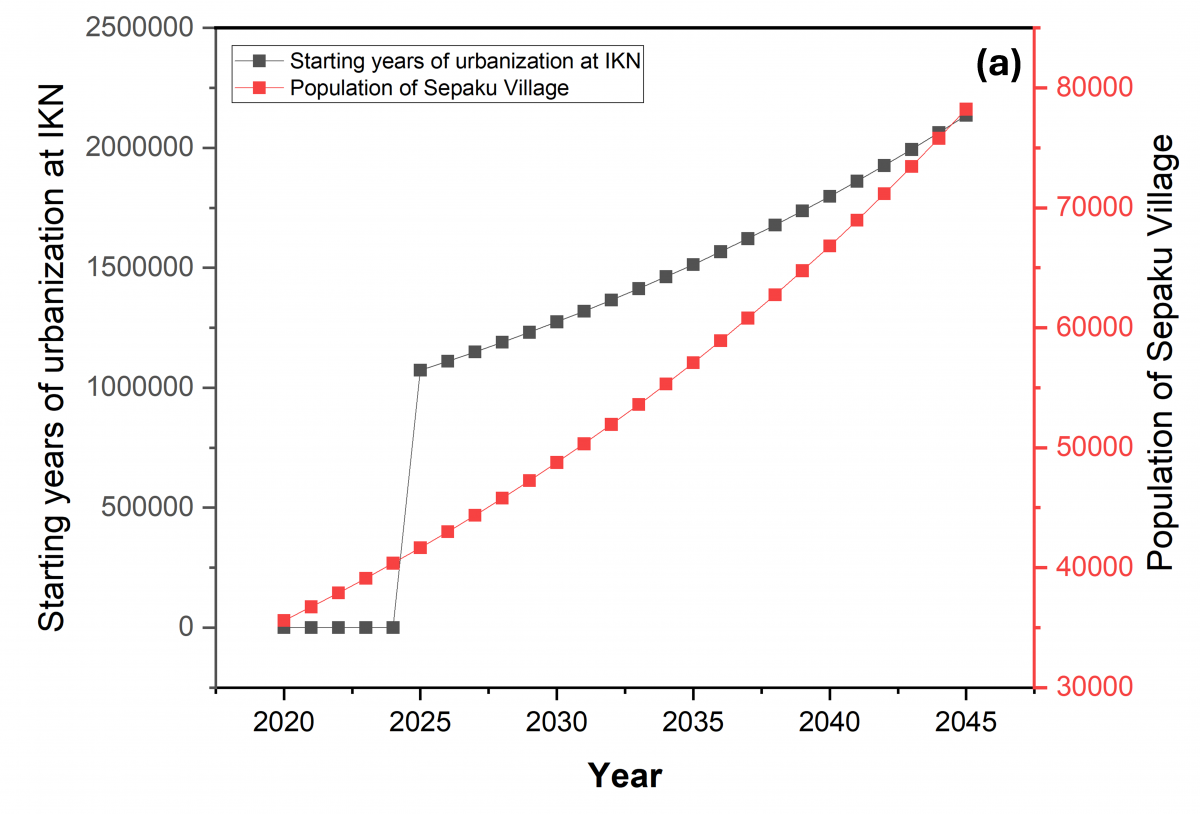
The development of the IKN area and Sepaku District reflects the dynamics of population growth and urbanization, which have a direct impact on water demand in both regions. The dynamic system model in Figure 9 illustrates the stock-flow diagram between population growth, urbanization, water availability, and strategic measures for water resource management policies in the IKN area and Sepaku District. This model was implemented in PowerSim Studio 10 using annual time steps from 2020 to 2045. The populations in IKN and Sepaku are represented as stocks, while births, deaths, and migration or urbanization are represented as flows. Key variables, parameters, and assumptions are described in Table 5. The validation method is illustrated in Figure 10(a), which models population growth from reference data for the years 2020 through 2025 using data from the Central Statistics Agency (BPS).
Figure 9. The system dynamics model shows the relationship between sustainable water resource management in the IKN area and the Sepaku District
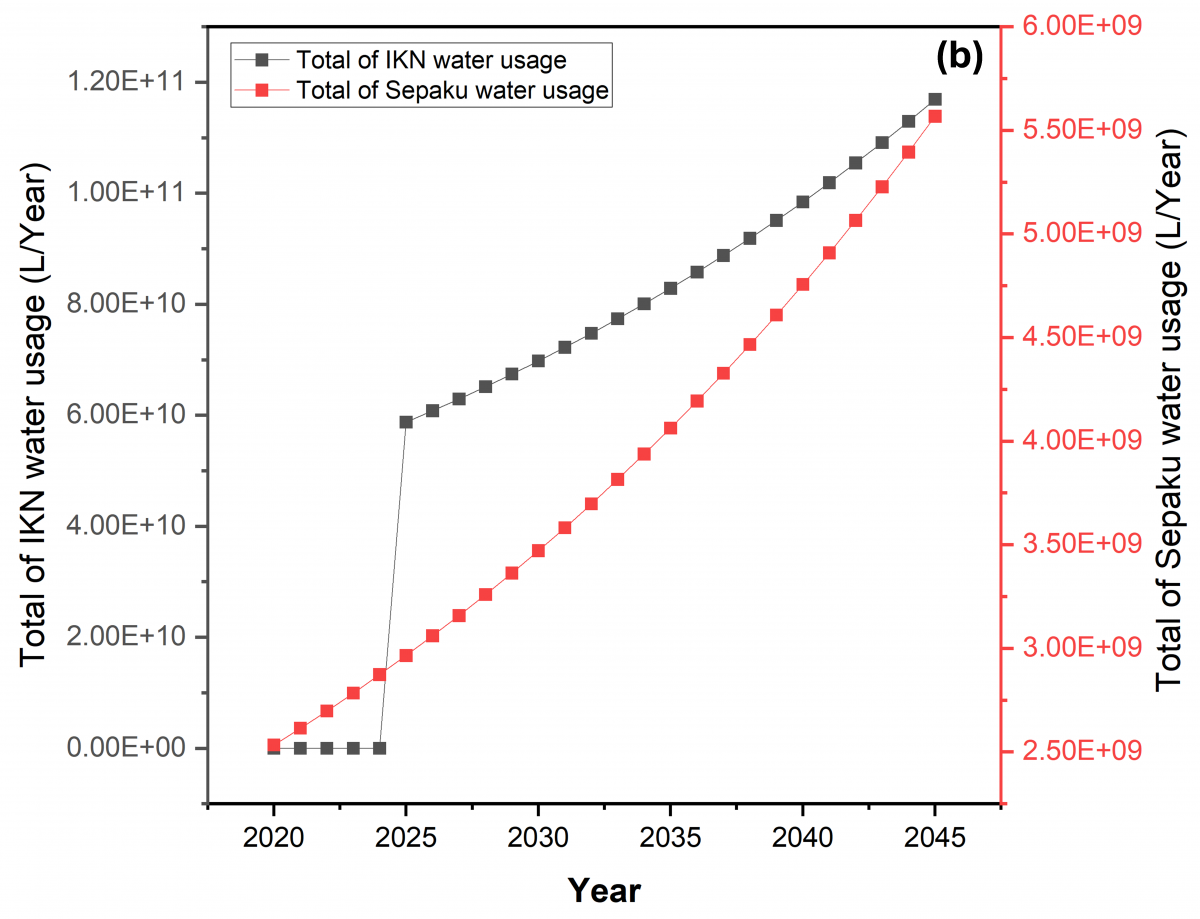
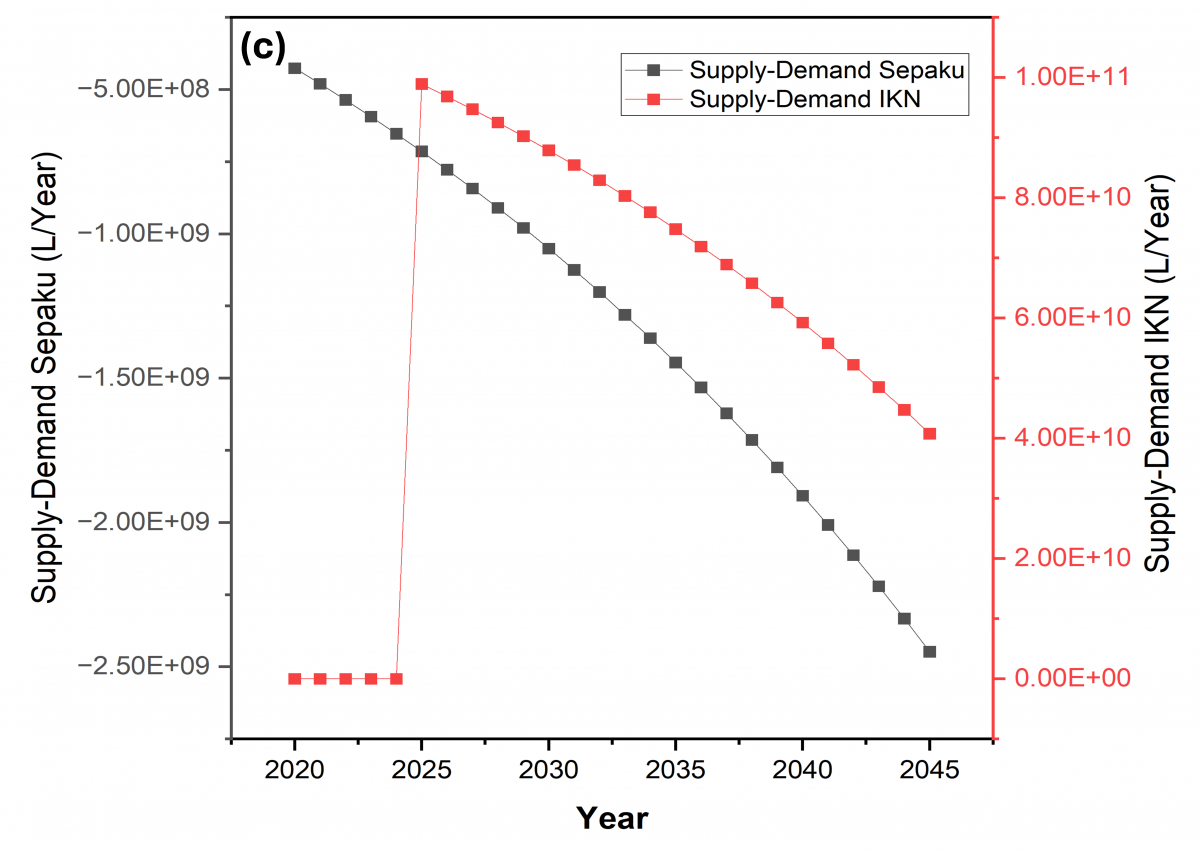
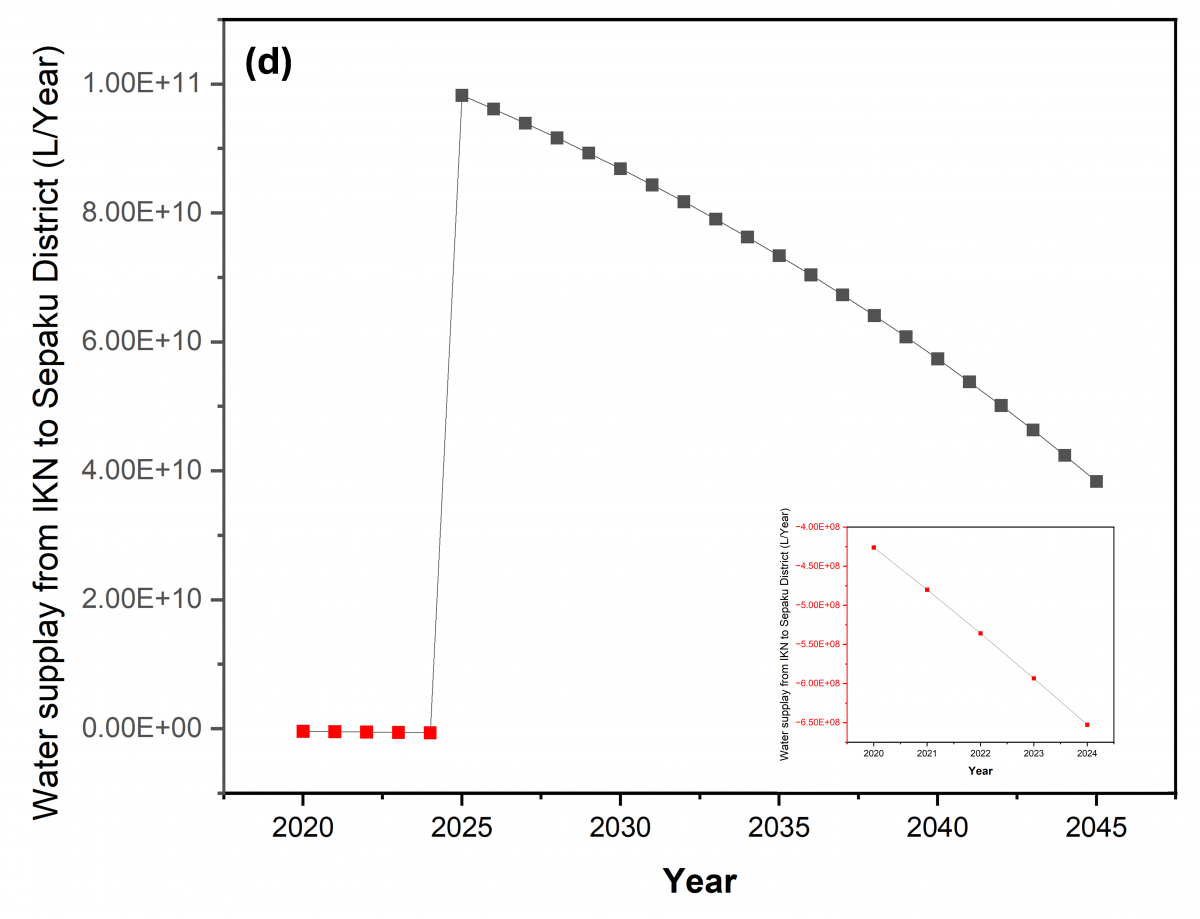
Figure 10. Projections of the impact of urbanization and population growth on water demand and availability, (a) urbanization and population growth in the Nusantara Capital City (IKN) and Sepaku District, (b) comparison of total water demand in the IKN and Sepaku District, (c) comparison of total water demand and supply in the IKN and Sepaku District, and (d) projection of water availability based on surplus water supply from IKN
This system was developed using a circular Stock and Flow Diagram (SFD) approach, which shows the interaction between cause-and-effect factors in the context of water demand and supply. Population growth and urbanization are the main drivers of increased water demand, both for domestic and non-domestic use. This increase forms a positive feedback loop that accelerates water consumption in line with economic and social development in the IKN region and its surroundings.
Table 5. The system dynamics model with main variables, equations, parameters, and assumptions
|
Main Variable |
Governing Equation |
Symbols |
Parameter Value/Data Source |
Main Assumption |
|
Population of Sepaku Village |
$P_r(t+1)=\left[P_r(t) * G_r(t)\right]-\left[P_r(t) * D_r(t)\right]$ |
|
Birth Rate, Death Rate, and Population Baseline of Sepaku Village, based on reference data from BPS for the years 2020–2025. |
Population changes annually through population growth and mortality, particularly for Sepaku Village. |
|
Population of IKN |
$P_r(t+1)=\left[P_r(t) * U_r(t)\right]-\left[P_r(t) * D_r(t)\right]$ |
|
Urbanization-related population inflow, Death Rate, and Population Baseline of Sepaku Village, based on data from the IKN planning documents. |
Population changes annually through urbanization-related population inflow and mortality, particularly for Sepaku Village. |
|
Domestic Water Demand |
$Q D_r(t)=P_r(t) \times q r \times 365$ days |
|
'Annual water usage_Sepaku' × 'Population of Sepaku Village' water requirement is based on Ministry of Public Works Regulation No. 18 of 2007; a standard of 150 liters per person per day is used to determine urban drinking water needs. |
Per-capita water demand is assumed to remain constant during the simulation period. |
|
Total of Sepaku Water Usage |
$Q S(t)=Q D(t)+(25 \% \times Q D(t))$ |
|
'Domestic water demand' + 'Non-domestic water demand'; for non-domestic water demand, a standard of 25 percent of total domestic demand is used. |
Total water usage of the Sepaku community. |
|
Total of IKN Water Usage |
$Q I K N(t)=Q D(t)+(25 \% \times Q D(t))$ |
|
'Annual water IKN' × 'Starting years of urbanization at IKN' water requirement based on Ministry of Public Works Regulation No. 18 of 2007; a standard of 150 liters per person per day is used to determine urban drinking water needs, added to non-domestic needs with a standard of 25 percent of total domestic demand. |
Total water usage of the IKN community. |
|
Supply-Demand IKN |
$SDIKN(t)=Q_{source}-QIKN(t)(starting 2025)$ |
|
DELAYMTR('Water supply for IKN';1;5;0<<l>>) - 'Total of IKN water usage'. |
The surplus of clean water from the IKN can be used to supply the Sepaku area. |
|
Supply-Demand Sepaku |
$S D S(t)=\left(Q_{source}+Q_{alternative}\right)-Q S(t)$ |
|
('Alternative water sources' + 'Water inequality of Sepaku') - 'Total of Sepaku water usage'. |
Water availability is reduced by the total water needs of the Sepaku community. |
|
Water Supply from IKN to Sepaku |
$Q_{transfer}(t)=S D I K N(t)-S D S(t)$ |
|
'Supply-Demand IKN' + 'Supply-Demand Sepaku'. |
Excess water from the IKN’s water source is transferred to meet the needs of the Sepaku community. |
The increase in the IKN population due to urbanization will begin in 2025, and the government has prepared basic infrastructure, including clean water for the IKN's needs, with an initial raw water supply of 157.7 × 10⁹ liters per year. Meanwhile, the buffer zone of Sepaku District experiences a clean water deficit because the supply of 946,080,000 L/year from the Sepaku Water Treatment Plant and 315,360,000 L/year from the Maridan Water Treatment Plant is unable to meet the overall clean water needs of Sepaku District. This water deficit has caused the community to compensate for their water needs by using alternative clean water sources, including 34.8% groundwater and 8.6% rainwater, based on a demographic survey. When a deficit occurs, water management policies and infrastructure capacity improvements function as a balancing feedback loop to reduce the negative impacts of water shortages. A strategic step for an inclusive, sustainable water resource management policy is to allocate surplus raw water from the IKN to the Sepaku region as a buffer zone experiencing a clean water deficit. Table 5 presents the main variables, equations, parameters, and assumptions that operationalize the relationships between population growth, water demand, water supply availability, regional water deficits, and the potential for water transfers between the IKN and Sepaku in the system dynamics model.
Based on the analysis in Figure 10(a), since 2025, the urbanization process in the IKN area has caused rapid growth, along with population growth in Sepaku District from around 35,592 people in 2020 to more than 75,000 people in 2045. This increase in population reflects the growing pressure on water resources, both for domestic and non-domestic needs, making adaptive water management planning increasingly important. Figure 10(b) shows that total water demand is on a sharp upward trend in both regions. Water demand in IKN will increase exponentially starting in 2025 due to rapid urbanization in the IKN region. Meanwhile, water demand in Sepaku also increases from around 2.5 × 10⁹ liters per year to more than 5.6 × 10⁹ liters per year in the same period. This phenomenon shows that the development of IKN has implications for its internal water demand, while buffer areas such as Sepaku District, which are experiencing parallel demographic and economic growth, are also experiencing water deficits. Figure 10(c) shows the balance between water availability and demand (water balance) in both regions. The analysis shows that Sepaku District consistently experienced a water deficit throughout the observation period, with the deficit value continuing to increase to around -2.4 × 10⁹ liters per year.
IKN showed a significant water surplus in the early stages of development with a prepared raw water allocation of 157.7 × 10⁹ liters per year, although this trend gradually declined as demand increased due to urbanization and population growth. This pattern indicates the potential for water redistribution from surplus areas (IKN) to deficit areas (Sepaku) as a mitigation measure against spatial imbalances in water availability between IKN and its buffer zones. The transfer of surplus water from the IKN water supply system to Sepaku can be considered a medium-term option or a conditional policy option to bridge the water demand gap in the buffer zone. The modeled transfer volume could serve as a conditional scenario, which requires a feasibility study and further assessment of technical, ecological, economic, and institutional aspects. Its implementation will depend on the amount of surplus water that can be allocated, infrastructure capacity, and institutional arrangements among the IKN Authority, local governments, and water utilities. This phenomenon of inter-regional water transfer is shown in Figure 10(d), which illustrates that the water supply from IKN to Sepaku District increases sharply from 2025 to reach its peak around 2035, then slowly declines towards 2045. This pattern illustrates the strategy of utilizing water surpluses from IKN to cover deficits in Sepaku, so that both regions can achieve balance in meeting water needs. The downward trend in water surpluses in IKN indicates that, in the long term, the sustainability of water supply for surrounding areas such as Sepaku is highly dependent on the effectiveness of the integrated water resource management system implemented by the government.
The development of IKN may generate broader environmental implications beyond water supply availability, particularly related to water equity, water quality protection, and long-term resource sustainability. The increasing water demand in the IKN area may potentially create disparities between the central development zone and surrounding buffer communities if water infrastructure and service distribution are not planned inclusively. Therefore, future water management strategies should prioritize equitable infrastructure development, improved water distribution systems, and affordability considerations to ensure that surrounding communities also benefit from regional development. Furthermore, the potential decline in water quality should be addressed through preventive measures by controlling land-use changes, implementing sustainable construction practices, protecting water catchment areas, and improving domestic wastewater management to reduce pollutant inputs into surface and groundwater systems.
The potential use of inter-regional water transfer should also be carefully evaluated by considering source-area sustainability, ecological flow requirements, and long-term water availability to avoid shifting environmental pressures from one region to another. In this regard, the application of IWRM at the local level is essential by strengthening coordination among stakeholders, promoting water conservation practices, developing decentralized wastewater treatment systems, and increasing community participation in monitoring and protecting water resources. These integrated approaches can support IKN development while maintaining regional water security, environmental quality, and social equity. The results of this analysis show that the relationship between IKN and Sepaku District forms a system of interdependence in terms of water availability. IKN acts as the main source of water that supports the surrounding buffer areas, while Sepaku is the beneficiary that experiences an increase in water demand due to population growth. The development of IKN is a symbol of national spatial transformation and an example of the implementation of sustainable and inclusive water resource management in Indonesia. Table 6 synthesizes the key changes associated with IKN development by linking their potential socio-environmental impacts to the management measures needed to ensure regional water security, environmental sustainability, and equitable water access.
Table 6. Impacts of the Nusantara Capital City (IKN) development on the water resource system in Sepaku
|
Dimension |
Changes Due to IKN Development |
Environmental and Social Impacts |
Implications for Water Toward Ecosystem-Based Management |
Ref. |
|
Water quality |
Land-use conversion, construction activities, urban expansion, and increasing domestic activities may alter runoff patterns and increase pollutant loads in local water sources. |
Increased turbidity, TSS, BOD, and microbiological contamination may reduce raw water quality, increase treatment requirements, and raise water production costs. Poor water quality also increases health risks for local communities. |
Strengthening watershed protection, erosion control, wastewater management, and continuous monitoring of raw water quality are required. |
[11, 17, 19-21] |
|
Water quantity |
Population growth and urban activities associated with IKN increase water demand and may change the balance between supply and demand in Sepaku. |
Increasing demand may create future water stress, particularly for surrounding communities if local sources cannot meet growing needs. Dependence on external supply may also increase vulnerability during dry periods. |
Water transfer should be considered as a medium-term option and complemented with demand management, rainwater harvesting, alternative sources, and local source expansion. |
[54, 55] |
|
Water accessibility |
Development may improve centralized water infrastructure but may not automatically provide equal access for surrounding settlements. |
Communities with limited infrastructure may continue depending on groundwater, rivers, or alternative sources with uncertain quality and reliability. |
Infrastructure planning should prioritize equitable service coverage, especially for vulnerable communities in the IKN buffer zone. |
[56-58] |
|
Water affordability |
Changes in water services, tariffs, and household dependence on purchased water may affect household expenditure. |
Low-income households may experience higher water-cost burdens because a larger share of income is allocated to water needs, increasing the risk of water inequality. |
Implement affordable tariff mechanisms, targeted subsidies, and pro-poor water service policies. |
[39] |
|
Governance and sustainability |
IKN transforms Sepaku’s water system from a local system into a more complex socio-hydrological system involving multiple stakeholders. |
Competition between urban demand and community needs may emerge if allocation and management mechanisms are unclear. |
Integrated Water Resources Management (IWRM) involving government, utilities, and communities is needed to balance environmental sustainability and social equity. |
[59, 60] |
The local communities surrounding the IKN area and Sepaku District exhibit diverse socio-economic characteristics, predominantly consisting of lower-middle-income households. This economic condition significantly influences households’ capacity to access clean water, both in terms of connection costs and expenses for maintenance and usage. Socio-economic disparities result in portions of the population continuing to rely on traditional water sources such as dug wells, rainwater, and rivers. The affordability of clean water in this region is primarily determined by infrastructure availability, economic capacity, and the inclusiveness of tariff policies across all social strata within Sepaku District.
Observations from a single sampling period at one river location and two household wells identified site-specific water quality issues that may require appropriate treatment and further monitoring. Since this assessment covered only three locations during a single sampling period, this data can provide an initial indication of site-specific water quality but cannot represent the entire IKN buffer zone or seasonal water quality conditions. Assessments of water quantity and continuity based on community perception surveys and interviews show that most residents still experience shortages in the clean water supply, as represented in the dynamic system modelling. This condition has led to a water deficit in Sepaku District and a potential decline in water surplus within the IKN area by the late development phase (2040–2045). These findings suggest that without effective policy interventions, the sustainability of water resources will be threatened by demographic and ecological pressures. Implementing a water transfer mechanism from surplus regions (IKN) to deficit regions (Sepaku) represents an efficient medium-term mitigation strategy. The modeling results indicate that inter-regional water transfers could be a scenario requiring further assessment as a conditional medium-term scenario, and complemented by demand management, rainwater harvesting, alternative sources, and the expansion of local sources.
This study demonstrates that clean water accessibility in Sepaku District, as a buffer zone of IKN, is shaped by the interaction between socio-economic vulnerability, declining raw water quality, increasing water demand, and uneven water supply capacity. The policy recommendations can be divided into short-term, medium-term, and long-term actions. In the short term, priority should be given to reducing immediate health and economic risks for local households. This includes routine monitoring of surface water and groundwater quality. Temporary clean water supply should be provided to villages with limited access, especially during dry periods or when local sources fail to meet safety standards. Household-level treatment support should be introduced for communities that still rely on wells, rainwater, or untreated surface water. In addition, tariff support, targeted subsidies, or lifeline tariffs should be considered for low-income households to prevent water expenditure from reducing spending on other basic needs. In the medium term, policy should focus on strengthening local water infrastructure and reducing dependence on unsafe alternative sources. This includes expanding the capacity and service coverage, improving village-level pipeline connections, reducing leakage and distribution losses, and increasing the reliability of clean water delivery. Rainwater harvesting should be promoted as a supplementary source, particularly for non-potable domestic uses and during periods of seasonal scarcity. These medium-term actions are necessary to reduce the water supply-demand gap and improve the resilience of buffer communities.
In the long term, water governance in the IKN-Sepaku system should be based on IWRM. This requires integrating water supply planning with watershed protection, land-use control, domestic wastewater management, groundwater protection, and climate adaptation. Protection of the watershed should include riparian buffer conservation, erosion control in construction areas, recharge area protection, sediment management, and regular ecological monitoring. Based on the dynamic model, the IKN water surplus may decline over time; inter-regional water transfer from IKN to Sepaku should be treated as a conditional and medium-term policy option rather than a permanent solution. A transparent water allocation mechanism is needed to define priority users, drought-period allocation rules, minimum service standards, ecological flow requirements, financing arrangements, and institutional responsibilities among the IKN Authority, local government, water utilities, and communities.
To maintain the sustainability of water resources, long-term water management policies are needed, including the application of the IWRM concept, which emphasizes efficiency, conservation, and equitable distribution of water between regions. This approach must integrate various cross-sectoral interests, such as domestic, industrial, and environmental water needs, while also considering the ecological carrying capacity of the water catchment area. The dynamic system model provides an overview of the interaction between water demand and supply in the IKN area and Sepaku District. However, the complexity of the actual system in the field, which is influenced by social, economic, hydrological, and policy variables, still requires further refinement through long-term empirical data and more in-depth spatial analysis. Water quality measurements were conducted at only three locations during a single sampling period; thus, this study has not captured seasonal variations. Future research could involve repeated water quality sampling across different seasons. In addition, further research can integrate spatial and political-economic approaches to water resources to produce more comprehensive and adaptive policy recommendations for the dynamics of change in the IKN area and its surroundings.
The authors would like to thank the IKN and Sepaku communities, who have given researchers the opportunity to carry out this research. We are also grateful to the Center for Higher Education Funding and Assessment (PPAPT) under the Indonesian Education Scholarship (BPI), and the Indonesian Endowment Fund for Education (LPDP), Ministry of Finance of the Republic of Indonesia, for funding support under Scholarship Contract No.: 011960/PPAPT.1.2/BPI.06/11/2025.
Informed consent was obtained from all subjects involved in the study.
|
nh |
the sample size for the village/ward |
|
Nh |
the population of the village/ward, peoples |
|
N |
the total population of Sepaku Subdistrict |
|
n |
the total sample |
[1] Hadiningrat, K.P.S.S., Soedarno, D., Silalahi, V.A.J.M. (2024). Strengthening the quality of human resources and economic access of local communities in improving social integration in the Capital City of Nusantara. JIPOWER: Journal of Intellectual Power, 1(2): 30-41. https://doi.org/10.63786/jipower.v1i2.11
[2] Humaira, A.N.S., Dmayo, R.A., Ain, A.S.Q. (2025). Aligning Jakarta zoning plan for coastal areas and small islands (RZWP3K) into the SDGs. IOP Conference Series: Earth and Environmental Science, 1498(1): 012020. https://doi.org/10.1088/1755-1315/1498/1/012020
[3] Michael, M., Malau, K.P.T., Anugrah, D.S.B., Prismawan, D. (2025). Analysis of commuting time and health impact in Jakarta metropolitan area: A comparative review. Jurnal Perkotaan, 17(1): 1-11. https://doi.org/10.25170/perkotaan.v17i1.6325
[4] Surtiari, G.A.K., Dalimunthe, S.A., Sasaki, D., et al. (2025). Social and political roots of loss and damage: A study of vulnerable coastal communities in greater Jakarta. Journal of Disaster Research, 20(5): 710-725. https://doi.org/10.20965/jdr.2025.p0710
[5] Wijaya, D., Al Uyun, D., Hadiyantina, S. (2025). The decentralization dilemma: Navigating challenges in building the Nusantara capital city. International Journal of Islamic Education, Research and Multiculturalism, 7(1): 152-170. https://doi.org/10.47006/ijierm.v7i1.442
[6] Sakkar, R.A., Mustafa, M., Mega, J.P.A. (2025). Comparative analysis of Bumi Serpong Damai City (BSD) and Nusantara Capital City (IKN) in the conceptual framework of sustainable cities. International Journal of Science Technology & Management, 6(1): 22-36. https://doi.org/10.46729/ijstm.v6i1.1223
[7] Helmi, D.Z.Y., Widi, R.V.M., Putri, T.S. (2025). Ibu Kota Nusantara (IKN) as a future oriented renewable clean energy-based transformation effort. Talenta Conference Series: Local Wisdom, Social, and Arts (LWSA), 8(1): 61-67. https://doi.org/10.32734/lwsa.v8i1.2348
[8] Hastira, M.F., Arsyad, A., Kambo, G., Muhammad, M., Saad, M., Arifin, M. (2025). Spatial politics: Questioning land use in the IKN region from a spatial production perspective. Journal of Government and Civil Society, 9(2): 387-405. https://doi.org/10.31000/jgcs.v9i1.14811
[9] Nainggolan, P.P., Katharina, R., Buhaerah, P., Rudiastuti, A.W., Apriani, T. (2025). Relocating Indonesia’s Capital City: The Struggle for Power and Resources in Borneo. Springer Singapore.
[10] Ahmad, A., Suhendar, B., Jumariyah, S., Delfianti, D., Ramadhan, R. (2025). Development of the archipelago capital city from an environmental ethics perspective. Journal of Geographical Sciences and Education, 3(1): 65-73. https://doi.org/10.69606/geography.v3i1.105
[11] Syaban, A.S.N., Appiah-Opoku, S. (2024). Unveiling the complexities of land use transition in Indonesia’s new capital city IKN Nusantara: A multidimensional conflict analysis. Land, 13(5): 606. https://doi.org/10.3390/land13050606
[12] Ristanto, D.A., Jatayu, A., Sihotang, R.Z.F. (2022). Towards a sustainable new state capital (IKN): Sustainable zoning plan formulation based on quantitative zoning approach. IOP Conference Series: Earth and Environmental Science, 1108(1): 012051. https://doi.org/10.1088/1755-1315/1108/1/012051
[13] Yudiartono, Y., Santosa, J., Fitriana, I., et al. (2024). Renewable energy in sustainable cities: Challenges and opportunities by the case study of Nusantara Capital City (IKN). International Journal of Renewable Energy Development, 13(6): 1136-1148. https://doi.org/10.61435/ijred.2024.60390
[14] Torio, P.C., Harris, L.M. (2025). Water tariffs and social equity: Towards water service connections and pricing instruments for the poor. World Water Policy, 11(1): 38-60. https://doi.org/10.1002/wwp2.12229
[15] Syaban, A.S.N., Appiah-Opoku, S. (2023). Building Indonesia’s new capital city: An in-depth analysis of prospects and challenges from current capital city of Jakarta to Kalimantan. Urban, Planning and Transport Research, 11(1): 2276415. https://doi.org/10.1080/21650020.2023.2276415
[16] Atmoko, T., Sitepu, B.S., Adinugroho, W.C., et al. (2025). Tree biodiversity in Bornean lowland forest: What are the key species for forest city development in the new capital city of Indonesia? PLoS ONE, 20(4): e0320489. https://doi.org/10.1371/journal.pone.0320489
[17] Plamonia, N., Anjani, R., Amru, K., et al. (2026). Seasonal dynamics of raw water quality and pollution load in the Sepaku River: Implications for treatment costs in Nusantara, Indonesia’s New Capital. International Journal of Design & Nature and Ecodynamics, 21(1): 91-104. https://doi.org/10.18280/ijdne.210109
[18] Begg, S.S., De Ramon N’Yeurt, A., Iese, V. (2022). Rainfall and land use impacts on water quality and communities in the Waimanu River Catchment in the South Pacific: The case of Viti Levu, Fiji. Regional Environmental Change, 22(3): 105. https://doi.org/10.1007/s10113-022-01961-9
[19] Bressane, A., Loureiro, A.I.S., Gomes, R.C., Ribeiro, A.I., Longo, R.M., Negri, R.G. (2022). Spatiotemporal effect of land use on water quality in a peri-urban watershed in a Brazilian Metropolitan Region: An approach considering GEP-based artificial intelligence. Pollutants, 3(1): 1-11. https://doi.org/10.3390/pollutants3010001
[20] Justin, S., Lihan, S., Mik, J., et al. (2025). Impact of land use and seasonality on faecal coliform abundance and physicochemical water quality in Batang Layar river, Sarawak, Malaysian Borneo. Research Square, 1-12. https://doi.org/10.21203/rs.3.rs-6966017/v1
[21] Widyantari, A., Marselina, M., Riawan, E., Kuntoro, A.A., Budirahardjo, E.K. (2025). Analysis of climate change and land use effect on the availability and water quality of raw water (Case study: Cibangoak intake of SPAM Ciparay at Tirta Raharja Local Public Water Supply Company, Bandung Regency). Air, Soil and Water Research, 18. https://doi.org/10.1177/11786221251341837
[22] Boyland, M., Tuhkanen, H., Green, J., Barquet, K. (2022). Principles for just and equitable nature-based solutions. SEI discussion brief. Stockholm Environment Institute, Stockholm. https://doi.org/10.51414/sei2022.016
[23] Yuanita, C.N., Sagala, S., Zawani, H., Harahap, W., Alam, K.A. (2025). Nature-based solutions for hydrometeorological risk reduction: The challenges and opportunities of riparian forest in Indonesia’s new capital city. IOP Conference Series: Earth and Environmental Science, 1447(1): 012017. https://doi.org/10.1088/1755-1315/1447/1/012017
[24] Simbolon, B., Suripin, S., Suharyanto, S. (2025). The impact of Sepaku Semoi Dam construction on the reduction of Tengin River discharge using the HEC-HMS model. Teknik, 46(2): 123-133. https://doi.org/10.14710/teknik.v46i2.67796
[25] Said, N.I., Hernaningsih, T., Sudinda, T.W., et al. (2024). Forecasting and sustainability of raw water supply for Indonesia’s new capital. International Journal of Sustainable Development and Planning, 19(1): 197-207. https://doi.org/10.18280/ijsdp.190118
[26] Simanjuntak, M., Sjaf, S., Yuliati, L.N., et al. (2025). Social dynamics, economic vulnerability, and community welfare in the buffer zone of Indonesia’s new capital (IKN): East Kalimantan. BIO Web of Conferences, 171: 04018. https://doi.org/10.1051/bioconf/202517104018
[27] Anggraeni, I., Hanson-Easey, S., Lestarianti, T., et al. (2025). Community participation, mediation and advocacy to harness the developmental benefits of relocation of new capital of Indonesia for local communities: Action research linking community and government perspectives. Health Promotion Journal of Australia, 36(4): e70104. https://doi.org/10.1002/hpja.70104
[28] Sejati, W., Pusoko, A.N., Aryadi, E.V., et al. (2024). Flood routing and dam breach parameter calculation on Sepaku Semoi Dam. Aptisi Transactions on Technopreneurship (ATT), 6(1): 136-148. https://doi.org/10.34306/att.v6i1.396
[29] Dewi, V.A.K., Rahayuningsih, T., Ng, W., et al. (2025). Integrated flood control strategy in new capital city of Nusantara (IKN) Indonesia. E3S Web of Conferences, 652: 11005. https://doi.org/10.1051/e3sconf/202565211005
[30] Prabowo, T.B., Wiratama, D.O. (2025). Impact management strategies in the development of the national capital on local communities. Side: Scientific Development Journal, 2(1): 17-26. https://doi.org/10.59613/zt9ac440
[31] Muafiroh, S., Tambunan, R.P. (2025). Systematic study of political ecology and the role of local community in the development of the Ibu Kota Nusantara. Sustainable Urban Development and Environmental Impact Journal, 2(1): 63-76. https://doi.org/10.61511/sudeij.v2i1.2025.1785
[32] Hernawan, D. (2023). Assessing the impact of land development regulations on customary land values: A case study of Rempang and IKN in Indonesia. Society, 11(2): 644-664. https://doi.org/10.33019/society.v11i2.584
[33] Akbar, I.Z., Afrianti, C., Kaswanto, R., Wiyoga, H., Mosyaftiani, A. (2025). The role of monitoring carbon storage and sequestration in advancing the vision of forest city: Lesson learned from urban forest assessment in Bandung, West Java. IOP Conference Series: Earth and Environmental Science, 1447(1): 012026. https://doi.org/10.1088/1755-1315/1447/1/012026
[34] Hutahaean, M., Sagala, S., Subrata, S.A., et al. (2025). Sustainable urban planning through green belt in IKN: A literature review. IOP Conference Series: Earth and Environmental Science, 1447(1): 012030. https://doi.org/10.1088/1755-1315/1447/1/012030
[35] Kurniawan, A., Hazmi, A.F.A., Nolasari, A.B., et al. (2025). Harmonizing urban life with natural ecosystems in new Nusantara Capital City through biodiversity sensitive urban design (BSUD). IOP Conference Series: Earth and Environmental Science, 1447(1): 012015. https://doi.org/10.1088/1755-1315/1447/1/012015
[36] Rushayati, S.B., Prasetyo, L.B., Pramesti, T.V., Wijaya, F.H., Wijayanto, A.K. (2025). Spatio-temporal analysis of land surface temperature and biomass changes in Nusantara Capital City: Challenges for forest city planning. Ecological Engineering & Environmental Technology, 26(10): 74-85. https://doi.org/10.12912/27197050/210101
[37] Warsilah, H. (2023). Reconstruction of ethnic identity in the development of a new capital city in East Kalimantan: Participation and access to city resources. In Assembling Nusantara: Mimicry, Friction, and Resonance in the New Capital Development, Springer Nature Singapore, Singapore, pp. 81-97. https://doi.org/10.1007/978-981-99-3533-8_7
[38] Virtriana, R., Ihsan, K.T.N., Anggraini, T.S., Harto, A.B., Riqqi, A., Deliar, A. (2025). Predicting suitable built-up areas in Indonesia’s new capital: Integrating ecosystems, access, and socioeconomics. Sustainable Futures, 10: 101342. https://doi.org/10.1016/j.sftr.2025.101342
[39] Syafitri, E.D., Plamonia, N., Ariyaningsih, R.P.A., et al. (2026). Designing an equitable and sustainable water tariff of drinking water utility for IKN Nusantara, Indonesia’s New Capital. Planning, 21(3): 993-1009. https://doi.org/10.18280/ijsdp.210304
[40] Hilal, N.A.D.M., Komariah, K., Ramelan, A.H. (2024). The multifaceted implications and challenges of relocating Indonesia's capital city: A comprehensive review of socio-economic, environmental, urban planning, and policy considerations. Sustinere: Journal of Environment and Sustainability, 8(3): 375-396. https://doi.org/10.22515/sustinere.jes.v8i3.403
[41] Sambo, C., Senzanje, A., Mutanga, O. (2021). Assessing inequalities in sustainable access to improved water services using service level indicators in a rural municipality of South Africa. Journal of Water, Sanitation and Hygiene for Development, 11(6): 887-901. https://doi.org/10.2166/washdev.2021.234
[42] Laksono, N.B., Latief, Y. (2024). Sustainable infrastructure development in the IKN region (Nusantara Capital): Simulation of the smart self-sustaining urban center area development. Smart City, 4(1): 3-19. https://doi.org/10.56940/sc.v4.i1.3
[43] Adinugroho, W.C., Prasetyo, L.B., Kusmana, C., Krisnawati, H. (2022). Tracking environmental quality of Indonesia’s new capital city and its surrounding area. IOP Conference Series: Earth and Environmental Science, 950(1): 012077. https://doi.org/10.1088/1755-1315/950/1/012077
[44] Susmiyati, H.R., Harjanti, W., Al Hidayah, R. (2023). Development of the Nusantara capital, sustainable extraction for East Kalimantan. In Assembling Nusantara: Mimicry, Friction, and Resonance in the New Capital Development, pp. 151-164. https://doi.org/10.1007/978-981-99-3533-8_11
[45] Rahman, A.R., Noor, F., Kosandi, M. (2023). New capital city’s geopolitical landscape. In Assembling Nusantara: Mimicry, Friction, and Resonance in the New Capital Development, pp. 215-229. https://doi.org/10.1007/978-981-99-3533-8_15
[46] Putri, D.L., Nurmawati, Dianiswara, A., et al. (2024). Towards the development of the Indonesia new capital city. BIO Web of Conferences, 92: 01024. https://doi.org/10.1051/bioconf/20249201024
[47] Kurnianto, F., Yuwono, B.E. (2026). Economic feasibility study of the Multi-Utility Tunnel (MUT) project in the new capital city of Nusantara (IKN) during the budget efficiency period. Eduvest-Journal of Universal Studies, 6(5): 5261-5273. https://doi.org/10.59188/eduvest.v6i5.52844
[48] Nguyen, T.T., Ngo, H.H., Guo, W., et al. (2019). Implementation of a specific urban water management - Sponge City. Science of the Total Environment, 652: 147-162. https://doi.org/10.1016/j.scitotenv.2018.10.168
[49] de Vries, W.T., Avila, V.C.A., Ghozali, A. (2025). Spatial assessment of wastewater requirements for the new capital city of Indonesia. Revue Internationale de Géomatique, 34(1): 125-149. http://doi.org/10.32604/RIG.2025.057970
[50] Femmilia, F., Pasule, L.E.M., Kusumawardhani, A. (2024). Sustainable water management strategies through smart technology integration: Systematic review. Research Horizon, 4(6): 381-392. https://doi.org/10.54518/rh.4.6.2024.433
[51] Vanhille, J., Goedemé, T., Penne, T., Van Thielen, L., Storms, B. (2018). Measuring water affordability in developed economies. The added value of a needs-based approach. Journal of Environmental Management, 217: 611-620. https://doi.org/10.1016/j.jenvman.2018.03.106
[52] Hobart, J.C., Cano, S.J., Warner, T.T., Thompson, A.J. (2012). What sample sizes for reliability and validity studies in neurology? Journal of Neurology, 259(12): 2681-2694. https://doi.org/10.1007/s00415-012-6570-y
[53] Setiadi, W., Pratiwiningrum, A.Z. (2019). A remunicipalization idea on water management in DKI Jakarta province. Jurnal Dinamika Hukum, 19(3): 630-648. https://doi.org/10.20884/1.jdh.2019.19.3.2657
[54] Gunawan, K.N., Kartikasari, D., Gumilar, J., Nolasari, A.B., Sugangga, M. (2024). AI-enhanced smart urban design process for salutogenic residential area: The case of capital city of Nusantara (IKN). IOP Conference Series: Earth and Environmental Science, 1394(1): 012029. https://doi.org/10.1088/1755-1315/1394/1/012029
[55] Mulyawati, M.D., Ferdinand, A., Wijaya, A.K., Saputra, H.A. (2024). Management planning water resources in Balikpapan city, Indonesia: A case study. Government & Resilience, 2(2): 41-62. https://doi.org/10.62503/gr.v2i2.17
[56] Thommandru, A., Turdialiev, M.A., Mone, V. (2025). Hydro-hegemony in the Anthropocene: Neoliberal paradigms and global south marginalization in water scarcity governance. Journal of Developing Societies, 41(3): 383-405. https://doi.org/10.1177/0169796x251326720
[57] Hutete, C., Sibanda, M.M. (2022). Water service provision and social equity in a South African rural district municipality. Africa’s Public Service Delivery and Performance Review, 10(1): 641. https://doi.org/10.4102/apsdpr.v10i1.641
[58] Hutete, C., Sibanda, M.M.M., Maramura, T.C. (2023). Water governance and social equity in South African rural municipalities: A case study of a district municipality in the Eastern Cape Province. Water Conservation & Management, 7(1): 12-18. http://doi.org/10.26480/wcm.01.2023.12.18
[59] Ruiz, E.A.S., Cremades, L.V., Benites, S.V. (2025). Inequalities in drinking water access in Piura (Peru): Territorial diagnosis and governance challenges. Sustainability, 17(16): 7542. https://doi.org/10.3390/su17167542
[60] Utami, A.N.F., Saputra, A.N., Fariaty, C.N., et al. (2026). Multi-level governance readiness and regional policy capacity in supporting Indonesia’s new capital development. Frontiers in Political Science, 8: 1758903. https://doi.org/10.3389/fpos.2026.1758903