Isolation and Molecular Identification of Rhodotorula mucilaginosa from Local Sources and Carotenoid Production Using Fruit Waste Extract

Abdalrahman Nabeel Al-Hyali* | Sumyia Khalaf Badawi | Tariq Zaid Ibrahim
© 2026 The authors. This article is published by IIETA and is licensed under the CC BY 4.0 license (http://creativecommons.org/licenses/by/4.0/).
OPEN ACCESS
This study aimed to isolate carotenoid-producing pigmented yeasts from local sources, select the most efficient isolate, identify it molecularly, and evaluate its carotenoid production using fruit waste extract (FWE). A total of 67 samples were collected from flowers, tree leaves, soil, spoiled fruits, pickles, homemade confectionery products, milk, and cheese, from which 17 pigmented yeast isolates were obtained. FWE, prepared from orange and pomegranate residues, was used in the screening medium. The concentrations of reducing and total sugars in the extract were 18.70 and 24.30 mg/mL, respectively. The secondary screening results demonstrated the superiority of isolate H1, which exhibited the highest pigmentation index of 32.06 and the highest growth index of 10.31. These values were used as comparative screening indicators and did not represent the final carotenoid concentration or biomass yield. During the final screening stage, isolate H1 produced the highest biomass yield of 12.1 g/L and the highest total carotenoid concentration of 2.9 mg/L, equivalent to 242.2 µg/g of dry biomass. Molecular identification was performed exclusively for isolate H1 using the internal transcribed spacer (ITS) region, confirming its identity as Rhodotorula mucilaginosa with 98% sequence similarity. The remaining selected isolates were not molecularly confirmed at the species level. Ultrasound treatment was used for cell disruption and carotenoid extraction. High-performance liquid chromatography (HPLC) analysis revealed a major peak for the extracted pigment at a retention time of 5.98 min, which was close to that of the β-carotene standard at 5.93 min, indicating that β-carotene was a major component of the carotenoids produced by isolate H1.
β-carotene, carotenoid production, fruit waste extract, high-performance liquid chromatography, Rhodotorula mucilaginosa, ultrasonication
Colour is a fundamental characteristic of food and beverages, directly influencing consumer acceptance and purchasing decisions [1]. Food colour often reflects its flavour and quality, explaining the widespread use of natural and artificial colorings in processed food products to enhance or correct colour. While artificial colorings continue to dominate the market due to their lower cost and favorable physical and chemical properties, growing consumer concern for safety and sustainability has led to increased demand for natural alternatives [2].
Microbial pigments are considered a very promising source for food applications and can compete with synthetic colourants [3]. According to a report published by Allied Market Research [4], the carotenoid sector alone was valued at approximately USD 1.8 billion in 2021 and is expected to reach USD 2.7 billion by 2031, with a compound annual growth rate (CAGR) of 3.9% during the period from 2022 to 2031. Furthermore, the U.S. Food and Drug Administration (FDA) has approved the use and commercialisation of some pigments derived from plants and microorganisms as food additives for human consumption, such as Arpink Red produced by Penicillium oxalicum and astaxanthin produced by Xanthophyllomyces dendrorhous [5, 6]. Under international standards, carotenoids produced naturally by yeasts and algae are considered natural colourants, since both the U.S. FDA and the European Food Safety Authority (EFSA) define natural colouring substances as materials extracted from biological sources and produced through natural metabolic pathways in living organisms [7, 8]. Carotenoids are widely used in the food industry because of their stability, safety, and high colouring capacity from yellow to orange and red colours. This coloring property is attributed to their molecular structure, which consists of a series of conjugated double bonds capable of absorbing light within the visible wavelength range, making them suitable alternatives to synthetic colorants [9]. β-carotene is used for coloring juices, butter, margarine, and dairy products, whereas lycopene is used to enhance the red color of tomato-based products and beverages. Lutein is considered one of the most important colorants used in egg products, dairy products, and bakery products because of its ability to impart a yellow color. Zeaxanthin and canthaxanthin are also used to improve coloration in fish and poultry, as well as to provide egg yolks with the desired color [10]. Therefore, the present study aims to reduce the use of synthetic colorants by replacing them with carotenoids and to minimize environmental pollution through the cultivation of Rhodotorula yeasts on wastes generated from natural juice processing.
Therefore, this study contributes to several Sustainable Development Goals (SDGs). It is linked to SDG 3, “Good Health and Well-being,” through the role of carotenoid pigments as antioxidants and free-radical scavengers. It is also associated with SDG 9, “Industry, Innovation and Infrastructure,” through the selection of optimal conditions for maximizing carotenoid production. Furthermore, it contributes to SDG 12, “Responsible Consumption and Production,” by promoting the sustainable production of pigments using biological methods and reducing the carbon footprint associated with the industrial production of synthetic colorants.
2.1 Purification of pigmented yeast isolates
Each stained yeast colony was individually transferred to dishes containing yeast malt extract agar (YMA) medium, prepared according to the method described in Section 3, using a sterile inoculation ring. The colonies were then streaked onto the agar surface and incubated at 30 ℃ for 72 hours. The inoculation and purification steps were repeated several times until pure colonies with uniform morphological characteristics were obtained. Their purity was verified by examining the external appearance of the colonies, along with microscopic examination of the cells after staining with methylene blue [11].
2.2 Preservation of yeast isolates
The isolates previously grown on YMA medium were transferred onto YMA agar slants in test tubes. The cultures were incubated at 30 ℃ for 48 h and subsequently stored at 5 ℃. The isolates were subcultured monthly to maintain their viability [12].
The samples were grouped and coded according to their sources, and the letters used in the coding system were selected by the researcher in accordance with the experimental procedures.
2.3 Isolation and purification of yeast isolates
A total of 67 samples were collected for the isolation of pigmented yeasts. The samples included flowers from different plants (41 samples), tree leaves (3 samples), soil (5 samples), spoiled fruits (6 samples), pickles (3 samples), homemade sweets (5 samples), milk (2 samples), and cheese (2 samples), which were collected from different areas of Mosul City and Telkaif District. The samples were prepared by taking 25 g of solid samples or 25 mL of liquid samples and adding them to 225 mL of peptone water in a 500 mL conical flask, followed by incubation at 30 ℃ for 3 h to activate the yeasts present in the samples. Thereafter, 0.1 mL of each sample was transferred to a Petri dish, and Potato Dextrose Agar (PDA) medium supplemented with the antibiotic chloramphenicol at a concentration of 250 mg per 1,000 mL of growth medium was added to prevent bacterial growth. The plates were incubated in an inverted position at 30 ℃ for 48 h [13].
Four plates were inoculated for each replicate, and representative colonies were selected based on differences in pigmentation and the uniformity of colony morphology observed on the plates. Subsequently, individual pigmented yeast colonies were transferred using a sterile inoculating loop onto plates containing YMA medium and streaked on the agar surface. The plates were incubated at 30 ℃ for 72 h, and the purification process was repeated until pure colonies with similar morphological characteristics and microscopic appearance were obtained after staining with methylene blue [14].
2.4 Preparation of fruit waste extract medium
The extract was prepared using wastes obtained from local juice shops in Mosul City, which included orange and pomegranate residues generated after juice processing. Briefly, 1 kg of orange pulp and pomegranate arils were combined at a ratio of 1:1 with 2 L of water and heated at 100 ℃ for 30 min. The mixture was then cooled and centrifuged at 5000 rpm for 15 min, followed by filtration. The resulting filtrate was collected and sterilized by passage through a 0.22 µm membrane filter [15].
2.5 Determination of sugars
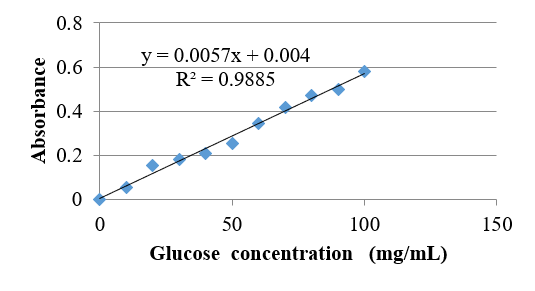
Sugars in the fruit waste extract (FWE) were determined using two methods: the first method was used to estimate reducing sugars using the colorimetric 3,5-dinitrosalicylic acid (DNS) method [16], Standard solutions were prepared using pure glucose at concentrations of 0, 10, 20, 30, 40, 50, 60, 70, 80, 90, 100, and 120 mg/mL. One milliliter of each standard solution was transferred into a test tube and mixed with 1 mL of DNS reagent. Two drops of 0.1 M sodium hydroxide solution were then added to the mixture. The tubes were heated to boiling in a water bath for 5 min, subsequently cooled, and then supplemented with 10 mL of distilled water. After thorough mixing, the absorbance was measured using a spectrophotometer at a wavelength of 540 nm. A standard calibration curve was then constructed using the corresponding glucose concentrations to determine the glucose concentration in the fruit waste extract. 1 mL of the filtrate was taken and subjected to the same procedure described above. The glucose concentration in the sample was subsequently estimated using the prepared standard calibration curve (Figure 1).
Figure 1. Standard calibration curve for glucose determination
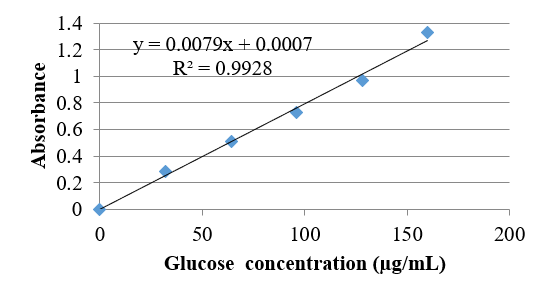
The second method was the phenol–sulfuric acid method, which was used to determine total sugars, including reducing and non-reducing sugars [17]. The procedure was carried out by transferring 1 mL of glucose standard solutions at different concentrations ranging from 32 to 192 µg/mL into test tubes. One milliliter of 5% phenol solution was added to each tube and mixed thoroughly. Subsequently, 5 mL of concentrated sulfuric acid was added to the mixture, and the tubes were shaken vigorously. The tubes were then placed in a water bath at 25–30 ℃ for 30 min. Absorbance was measured at 490 nm using a spectrophotometer to construct the standard calibration curve (Figure 2).
For the determination of carbohydrates in the fruit waste extract (FWE), 1 mL of the extract was taken, the required dilutions were prepared using distilled water, and the procedure described above was then applied.
Figure 2. Standard calibration curve for total carbohydrate determination
2.6 Preparation of yeast inoculum
The inoculum used throughout the different screening stages was prepared according to the method described in reference [18]. Ten loopfuls were taken from a 48-h-old pure culture grown on YMA and incubated at 30 ℃. The inoculum was transferred to a 250 mL flask containing 50 mL of YMB, previously adjusted to pH 5.0. The culture was then incubated in a shaking incubator at 100 rpm for 24 h at 30 ℃, with the inclusion of an additional screening stage. During the primary screening, the inoculum was prepared in Yeast Malt Extract Broth (YMB), whereas yeast extract–malt extract–fruit waste extract (YMF) medium was used during the secondary screening. The YMF medium was prepared by dissolving 3 g of malt extract, 3 g of yeast extract, and 5 g of peptone in 100 mL of distilled water. The resulting basal mixture was autoclaved and aseptically supplemented with 900 mL of filter-sterilized FWE. The pH was adjusted to 5.0. The yeast isolates were then grown in YMF medium under static conditions until reaching an optical density of 1.0 at 570 nm (OD570 = 1.0) to acclimatise the isolates to the presence of FWE in the cultivation medium. In the final stage of screening, the same YMF medium was used with pH adjusted to 5.0. Cultures were incubated in a shaking incubator at 30 ℃ and 100 rpm for 24 h. The yeast growth was then determined after measuring the absorbance at 570 nm, and the incubation was further continued under the same conditions for another 7 days.
2.7 Quantitative screening of isolates for carotenoid production
The YMB and YMF media used for the primary and secondary screening, respectively, were adjusted to pH 5.0. A flask-to-medium volume ratio of 5:1 was maintained, and the inoculum size was set at 10% (v/v). The cultures were incubated under static conditions at 30 ℃ for eight days.
Growth and pigment production were measured by reading the absorbance of diluted culture medium (1:9, v/v) with distilled water after 2 and 8 days of incubation. For each reading, the same uninoculated culture medium diluted in the same way was used as the spectrophotometric blank, and the absorbance readings were corrected accordingly. Absorbance was measured at 450 nm for estimation of cellular pigment production and 570 nm for estimation of growth. The results were expressed as the corrected absorbance value × 10, and the pigment production index and growth index were calculated as follows:
Pigmentation ratio $=\frac{A_{450}(8 d)}{A_{450}(2 d)}$ (1)
Growth ratio $=\frac{A_{570}(8 d)}{A_{570}(2 d)}$ (2)
where, A₄₅₀(8d) and A₄₅₀(2d) are the absorbance readings at 450 nm after 8 and 2 days, respectively, whereas A₅₇₀(8d) and A₅₇₀(2d) are the corresponding absorbance readings at 570 nm.
This approach was used to select the most promising isolates with the greatest ability to grow and produce carotenoids during the primary and secondary screening stages, and the tables were designed accordingly.
2.8 Determination of total carotenoids
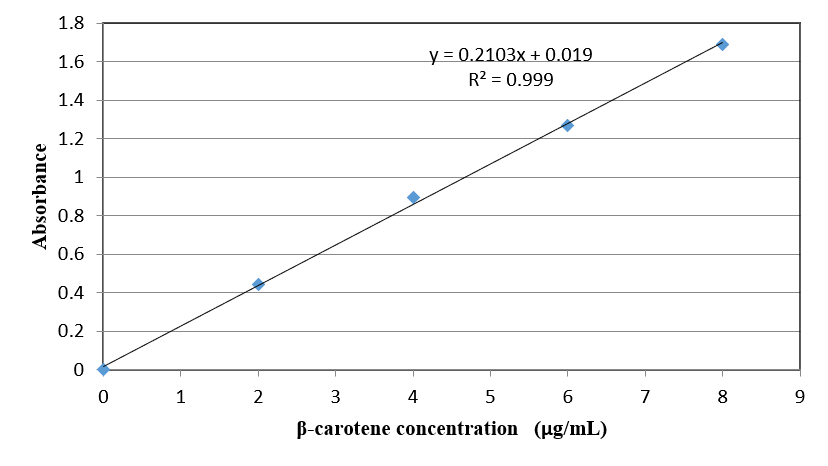
The carotenoid content was determined using a β-carotene calibration curve prepared at concentrations of 2, 4, 6, and 8 µg/ml. The amount of carotenoids in the samples was subsequently calculated from the resulting standard curve. The β-carotene stock standard solution was prepared by accurately weighing 0.1 g of β-carotene standard and transferring it into a 100 mL volumetric flask. The standard was dissolved in a small volume of hexane, and after complete dissolution, the volume was made up to the calibration mark with hexane. The resulting solution was designated as solution A. Subsequently, 1 mL of solution A was transferred into another 100 mL volumetric flask, and the volume was made up to the calibration mark with hexane. The solution was mixed thoroughly and designated as solution B. Each milliliter of solution B contained 10 µg of β-carotene standard. A series of standard solutions with concentrations of 2, 4, 6, 8, and 10 µg/mL was then prepared from solution B using hexane, as follows:
Subsequently, the absorbance was measured at 450 nm, as shown in Figure 3, and the following equation was applied to calculate the total carotenoid content:
$M=\frac{R F V_s \times 1000}{V_c}$ (3)
where,
M = total carotenoid content (µg/L).
R = spectrophotometric absorbance reading at 450 nm.
F = conversion factor, equivalent to 4.80 µg carotene/mL solvent.
Vₛ = total volume of solvent used for carotenoid extraction (mL).
Vc = volume of the culture used for carotenoid extraction (mL).
The β-carotene standard calibration curve used for carotenoid determination is shown in Figure 3.
Figure 3. Standard calibration curve for β-carotene determination
The total carotenoid concentration was converted from micrograms per liter (µg/L) to micrograms per gram of dry cell weight (µg/g) by dividing the carotenoid concentration obtained from the above equation by the dry biomass concentration expressed in grams per liter (g/L). The total carotenoid content was calculated using the equation presented above.
Carotenoid extraction was carried out according to the method [19], with slight modifications aimed at reducing the use of organic solvents in accordance with Sustainable Development Goal 12 (Responsible Consumption and Production). The modification was supported by recent studies demonstrating the effectiveness of ultrasound treatment in cell wall disruption and improvement of extraction efficiency [20]. A 50 mL aliquot of the fermentation culture was centrifuged at 3500 rpm for 15 min. The resulting supernatant was discarded, and the cell pellet was washed repeatedly with distilled water until the wash water became colorless. After removing the wash supernatant, a hexane–acetone solvent mixture (1:1, v/v) was added at a ratio of 10 mL of solvent per gram of cell pellet, and the mixture was thoroughly homogenized. Cell disruption was then performed by ultrasonication at a frequency of 30 kHz for 60 min at 40 ℃. The mixture was subsequently kept overnight in the flask to allow greater penetration of the solvent into the cells and thereby enhance extraction efficiency.
The sample was then centrifuged, and the solvent-containing top layer was collected and filtered using suitable filter paper. The extraction process was repeated several times until the cells were completely decolorized. The cell residue was discarded, while the filtrate was collected, and a 15% sodium chloride solution was added to aid in the purification and separation of the hexane layer. The mixture was transferred to a separation funnel, and the layers were separated to obtain the pure solvent layer. Finally, the purified hexane layer was collected, and its absorbance was measured at 450 nm using a spectrophotometer.
2.9 Determination of dry cell weight
The dry weight of the cells was estimated using 50 mL of fermentation culture. The sample was centrifuged at 3500 rpm for 15 minutes. The sedimented cells were collected and washed twice with distilled water, discarding the supernatant after each centrifugation. The washed biomass was then dried at 85 ℃ until its weight stabilized, and the dry weight of the cells was expressed in grams per liter of culture.
2.10 Analysis of carotenoids produced by the selected isolate using high-performance liquid chromatography
Carotenoids were analyzed using a SYKAM high-performance liquid chromatography (HPLC) system, Germany, equipped with a C18-ODS column (250 × 4.6 mm, 5 µm) and a UV–Visible detector. The column temperature was maintained at 30 ℃. Detection was performed at 485 nm. The mobile phase consisted of acetonitrile, isopropanol, and ethyl acetate at a volumetric ratio of 20:40:40 (v/v/v), with a flow rate of 1 mL/min. The injection volume was 0.1 mL (100 µL), and the total chromatographic run time was 20 min [21].
2.11 Molecular identification
The isolate was identified by extracting deoxyribonucleic acid (DNA) from yeast isolate H1 using a specific DNA extraction kit supplied by Geneaid and following the manufacturer’s protocol. The ITS region was amplified and sequenced using the forward primer ITS1F and the reverse primer ITS4; the size of the amplified DNA fragment produced by PCR was compared with a standard DNA ladder of different molecular sizes to estimate the approximate size of the amplified ITS region and to evaluate the efficiency and specificity of the amplification process using agarose gel electrophoresis [22]. The PCR cycling conditions used in this study are presented in Table 1.
Table 1. Polymerase chain reaction (PCR) cycles [23]
|
No. |
Stage |
Time |
Temperature (℃) |
Number of Cycles |
|
1 |
Initial denaturation |
5 min |
96 |
1 |
|
2 |
Denaturation |
30 s |
95 |
35 |
|
3 |
Annealing |
30 s |
45 |
|
|
4 |
Extension |
1 min 30 s |
72 |
|
|
5 |
Final extension |
5 min |
72 |
1 |
3.1 Isolation of pigment-producing yeasts
Table 2 shows that 17 colored yeast isolates were obtained from flowers, soil, and homemade sweets using PDA medium. In contrast, no colored yeast isolates were obtained from the other samples, including tree leaves, spoiled fruits, pickles, milk, and cheese, which were cultivated on the same medium. The colored yeast isolates were distributed as follows: 15 isolates from flowers of different plants, including rose, gardenia, oleander, and chrysanthemum; one isolate from soil; and one isolate from homemade sweets.
Table 2. Sources and codes of the isolates, total number of samples, and number of pigmented isolates
|
Sample Name |
Scientific Name |
Total Number of Samples |
Number of Pigmented Isolates |
Isolate Code |
|
Flowers |
|
41 |
15 |
|
|
•Rose |
Rosa hybrida |
11 |
5 |
Y1-Y2-Y3-Y4-Y5 |
|
•Chrysanthemum |
Dendranthema grandfloria |
5 |
2 |
R1-R2 |
|
•Oleander |
Nerium oleander |
12 |
6 |
D1-D2-D3-D4-D5-D6 |
|
•Capjasmine |
Gardenia jasminoides |
8 |
2 |
Q1-Q2 |
|
•Flowers of different plants |
|
5 |
---- |
|
|
Tree leaves |
|
3 |
---- |
|
|
Soil |
|
5 |
1 |
H1 |
|
Spoiled fruits |
|
6 |
---- |
|
|
•Banana |
Musa |
2 |
|
|
|
•Apple |
Malus domestica |
2 |
|
|
|
•Grape |
Vitis |
2 |
|
|
|
Pickles |
|
3 |
---- |
|
|
Assorted local sweets |
|
5 |
1 |
N1 |
|
Milk |
|
2 |
---- |
|
|
Cheese |
|
2 |
---- |
|
The table shows that 17 colored yeast isolates were obtained from flowers, soil, and homemade sweets using PDA medium. In contrast, no colored yeast isolates were obtained from the other samples, including tree leaves, spoiled fruits, pickles, milk, and cheese, which were grown on the same medium. The colored yeast isolates were distributed as follows: 15 isolates from flowers of different plants, including rose, gardenia, oleander, and chrysanthemum; one isolate from soil; and one isolate from homemade sweets. These results were in agreement with the findings of research [24], which reported that 12 out of 23 flower samples contained isolates belonging to the genus Rhodotorula, with colors ranging from orange-pink to red. Another study [25] indicated that Rhodotorula yeasts isolated from soil and flowers showed a greater ability to produce carotenoids compared with Rhodotorula yeasts isolated from other sources.
Fifteen orange- and red-pigmented yeast isolates that maintained stable colony coloration during successive subculturing and purification on Petri plates were selected. Isolates N1 and Y5 were excluded because their colonies exhibited a pale coloration tending toward white. The fifteen selected samples underwent macroscopic and microscopic examination, revealing a clear similarity in their morphological characteristics. When cultured on solid GYP agar, they formed circular, convex colonies ranging in color from dark orange to red, characterized by regular, complete margins. Most colonies were smooth and mucilaginous, while some exhibited a dry consistency. The surface appearance of the colonies also varied, ranging from glossy to dull.
3.2 Primary screening of isolates using yeast malt extract broth medium
Primary screening was conducted to evaluate carotenoid production and growth after 2 and 8 days of incubation. The results are presented in Table 3. Isolates showing higher pigmentation and growth ratios were considered more promising for carotenoid production. Based on these criteria, nine isolates (Y2, Y3, Y4, R1, R2, D3, D5, Q2, and H1) were selected for secondary screening as potentially efficient carotenoid-producing isolates.
Table 3. Primary screening of carotenoid-producing isolates in yeast malt extract broth (YMB) medium
|
No. |
Isolate |
Absorbance |
Pigmentation Ratio $\left(\frac{\mathrm{X} 2}{\mathrm{X} 1}\right)$ |
Growth Ratio $\left(\frac{\mathrm{Y} 2}{\mathrm{Y} 1}\right)$ |
|||
|
After 2 Days |
After 8 Days |
||||||
|
450 nm (X1) |
570 nm (Y1) |
450 nm (X2) |
570 nm (Y2) |
||||
|
1 |
Y1 |
0.407 |
0.259 |
1.772 |
1.245 |
4.35 |
4.81 |
|
2 |
Y2 |
0.172 |
0.146 |
6.235 |
5.431 |
36.25 |
37.20 |
|
3 |
Y3 |
0.325 |
0.291 |
6.468 |
5.601 |
19.90 |
19.25 |
|
4 |
Y4 |
0.291 |
0.262 |
5.879 |
5.999 |
20.20 |
22.90 |
|
5 |
R1 |
0.491 |
0.501 |
5.699 |
5.710 |
11.61 |
11.40 |
|
6 |
R2 |
0.320 |
0.271 |
5.212 |
4.632 |
16.29 |
17.09 |
|
7 |
D1 |
0.591 |
0.490 |
5.092 |
4.491 |
8.62 |
9.17 |
|
8 |
D2 |
0.745 |
0.680 |
2.092 |
5.914 |
2.81 |
8.70 |
|
9 |
D3 |
0.337 |
0.299 |
6.404 |
5.599 |
19.00 |
18.73 |
|
10 |
D4 |
0.252 |
0.209 |
0.700 |
0.590 |
2.78 |
2.82 |
|
11 |
D5 |
0.395 |
0.409 |
6.461 |
4.591 |
16.36 |
11.22 |
|
12 |
Q1 |
0.539 |
0.577 |
5.011 |
4.496 |
9.30 |
7.80 |
|
13 |
Q2 |
0.298 |
0.256 |
5.130 |
4.600 |
17.21 |
17.97 |
|
14 |
H1 |
0.390 |
0.247 |
6.873 |
5.801 |
17.62 |
23.49 |
Note: The values presented above represent the mean of two replicates.
Table 4. Secondary screening of carotenoid-producing isolates in yeast extract–malt extract–fruit waste extract (YMF) medium
|
No. |
Isolate |
Absorbance at 450 nm |
Pigmentation Ratio $\left(\frac{\mathrm{X} 2}{\mathrm{X} 1}\right)$ |
Absorbance at 570 nm After 8 Days (Growth Rate) |
|
|
After 2 Days (X1) |
After 8 Days (X2) |
||||
|
1 |
Y2 |
2.390 |
9.951 |
4.16 |
8.31 |
|
2 |
Y3 |
0.761 |
10.901 |
14.32 |
9.80 |
|
3 |
Y4 |
0.759 |
6.310 |
8.31 |
5.81 |
|
4 |
R1 |
7.401 |
7.821 |
1.06 |
7.12 |
|
5 |
R2 |
5.391 |
8.997 |
1.67 |
7.39 |
|
6 |
D3 |
1.601 |
10.981 |
6.86 |
8.90 |
|
7 |
D4 |
2.301 |
6.608 |
2.87 |
4.61 |
|
8 |
D5 |
1.340 |
10.099 |
7.53 |
9.79 |
|
9 |
Q2 |
1.062 |
5.501 |
5.18 |
4.69 |
|
10 |
H1 |
0.340 |
10.900 |
32.06 |
10.31 |
Note: The values presented above represent the mean of two replicates.
Within the nine isolates selected for secondary screening (Y2, Y3, Y4, R1, R2, D3, D5, Q2, and H1), isolate Y2 achieved the highest levels of pigmentation and growth among the nine selected isolates, with values of 36.25 and 37.20, respectively. Among these isolates, D5 recorded the lowest growth value at 11.22, while R1 recorded the lowest pigmentation value at 11.61. Isolate D4 was also added to the secondary testing phase as a comparison sample, despite not being included among the nine isolates, due to its low pigmentation and growth values of 2.78 and 2.82, respectively.
3.3 Secondary screening of isolates using yeast extract–malt extract–fruit waste extract medium
Table 4 presents the results of the secondary screening using YMF medium. The isolates selected for the final screening were H1, Y3, and D3. Isolate H1 was distinguished by recording the highest pigmentation ratio (X2/X1) of 32.06, calculated from the absorbance values measured at 450 nm on Day 8 and Day 2, as well as the highest absorbance at 570 nm, which reached 10.31. Meanwhile, isolates Y3 and D3 recorded the highest absorbance values at 450 nm after 8 days of incubation, reaching 10.901 and 10.981, respectively. In addition, isolates Y2 and D5 showed comparatively high growth and pigment production, whereas Y4, R1, R2, D4, and Q2 were excluded due to weak pigmentation and growth.
The sugar content of FWE, which was used in the preparation of the secondary screening medium (YMF), was determined using two methods: the DNS colorimetric method for reducing sugar estimation and the phenol–sulfuric acid method for total sugar determination, including both reducing and non-reducing sugars. The reducing sugar concentration was 18.70 mg/mL, while the total sugar concentration reached 24.30 mg/mL. Several studies have confirmed the successful use of agricultural wastes for the cultivation of Rhodotorula yeasts, such as the use of grape pomace for the cultivation of Rhodotorula mucilaginosa [26]. This indicates the feasibility of using FWE as one of the components of the culture medium.
3.4 Final screening of isolates using yeast extract–malt extract–fruit waste extract medium
Table 5 shows the final screening results of carotenoid-producing isolates. Isolate H1 achieved the highest carotenoid content, reaching 242.2 µg/g, and also recorded the highest biomass weight of 12.1 g/L. It was followed by isolate Y3, which recorded a carotenoid content of 230.1 µg/g and a biomass of 11.6 g/L. In contrast, isolate Y2 recorded the lowest carotenoid content, reaching 118.4 µg/g, and the lowest biomass weight, reaching 9.9 g/L. It can be observed from the table that biomass was not directly associated with carotenoid production. Isolate D5 achieved a higher biomass weight than isolate D3, with biomass values of 11.4 and 10.9 g/L, respectively. However, the total carotenoid content was lower in isolate D5, reaching 181.5 µg/g, compared with isolate D3, which recorded a carotenoid content of 198.7 µg/g. The higher carotenoid production in Rhodotorula isolates was not associated with greater biomass, but rather depended on the type of isolated strain. Variation among strains in their physiological and metabolic characteristics may lead to differences in their ability to accumulate carotenoids [27]. However, this interpretation remains observational, as the other isolates were not identified at the species level, and the potential effects of culture conditions and substrate composition were not independently examined.
Table 5. Final screening of carotenoid-producing isolates in yeast extract–malt extract–fruit waste extract (YMF) medium
|
No. |
Isolate |
Biomass (g/L) |
Total Carotenoids |
|
|
µg/g |
mg/L |
|||
|
1 |
Y2 |
9.9 ± 0.153 c |
118.4 |
1.2 ± 0.0252 b |
|
2 |
Y3 |
11.6 ± 0.252 ab |
230.1 |
2.7 ± 0.306 a |
|
3 |
D3 |
10.9 ± 0.231 b |
198.7 |
2.2 ± 0.153 a |
|
4 |
D5 |
11.4 ± 0.351 ab |
181.5 |
2.1 ± 0.219 a |
|
5 |
H1 |
12.1 ± 0.058 a |
242.2 |
2.9 ± 0.300 a |
Note: Means within the same column followed by different letters are significantly different according to Duncan’s multiple range test at p ≤ 0.05.
3.5 Molecular identification
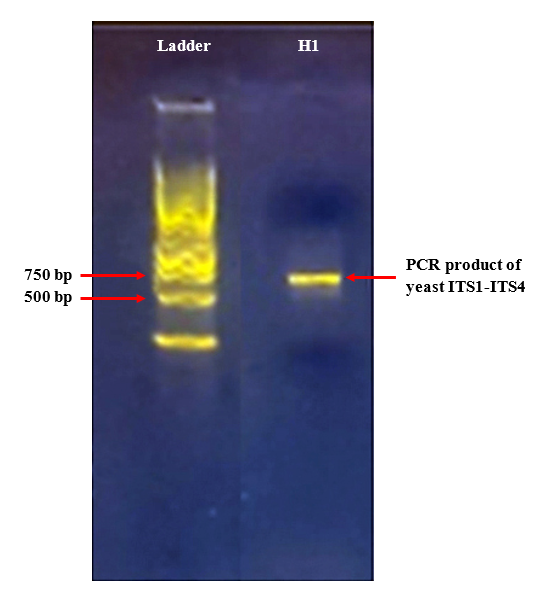
For molecular identification, genomic DNA was extracted from yeast isolate H1 using a commercial DNA extraction kit supplied by Geneaid, following the manufacturer’s protocol. The ITS region was amplified and sequenced using the forward primer ITS1F and the reverse primer ITS4. The size of the amplified DNA fragment produced by PCR was compared with a standard DNA ladder containing fragments of different molecular sizes to estimate the approximate size of the amplified ITS region and to evaluate the efficiency and specificity of the amplification process using agarose gel electrophoresis. As can be seen in Figure 4, the polymerase chain reaction (PCR) product appeared as a single band, indicating the quality of the amplification process. Comparing the position of this band with the standard DNA size scale, the size of the amplified fragment was estimated to be between 500 and 750 base pairs. This is consistent with previous studies reporting that amplification of the ITS region in Rhodotorula yeast isolates produces DNA fragments within the same size range [28].
Figure 4. Agarose gel electrophoresis showing the size of the amplified deoxyribonucleic acid (DNA) fragment of the ITS1–ITS4 region of Rhodotorula yeast isolate compared with the standard DNA ladder
The resulting 700-bp consensus ITS sequence of isolate H1 was subsequently subjected to BLASTn analysis against the nucleotide database of the National Center for Biotechnology Information (NCBI). The highest-scoring match was obtained with Rhodotorula mucilaginosa isolate 7, corresponding to the GenBank reference accession number OM523876.1. The alignment covered 100% of the query sequence and extended from positions 235 to 933 of the reference sequence. The analysis yielded a bit score of 1236 and an E value of 0.0, with 690 identical nucleotides out of 702 aligned positions, corresponding to a nucleotide identity of 98.29%. These results strongly supported the molecular identification of isolate H1 as Rhodotorula mucilaginosa.
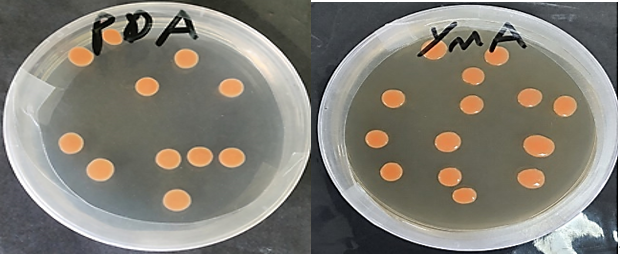
Figure 5 shows the morphological characteristics of Rhodotorula mucilaginosa colonies grown on PDA and YMA media.
Figure 5. Morphological characteristics of Rhodotorula mucilaginosa colonies grown on Potato Dextrose Agar (PDA) and yeast malt extract agar (YMA) media
3.6 Identification of carotenoids using high-performance liquid chromatography technique
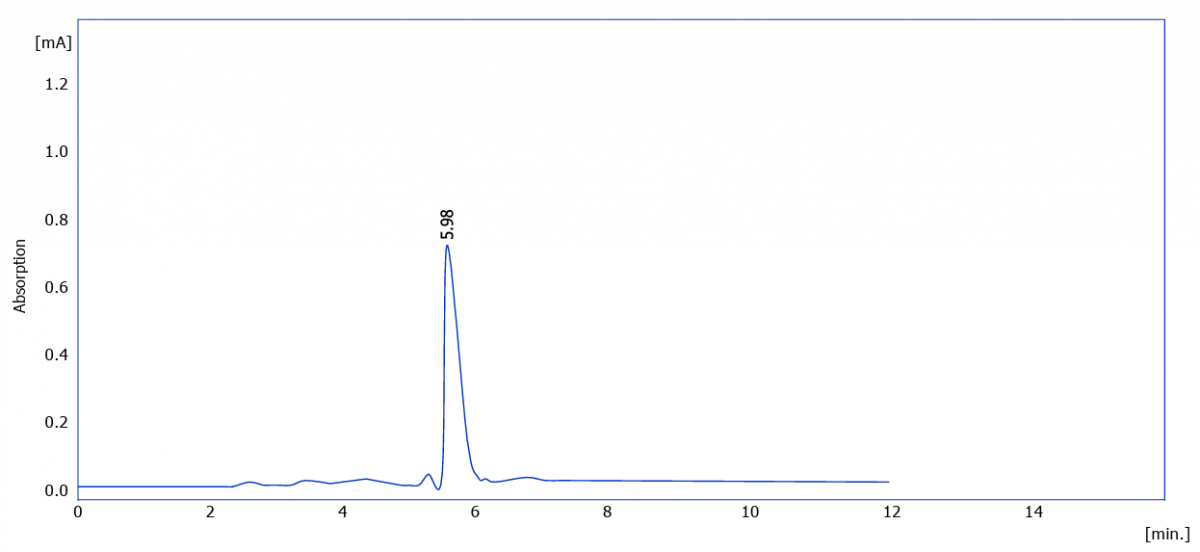
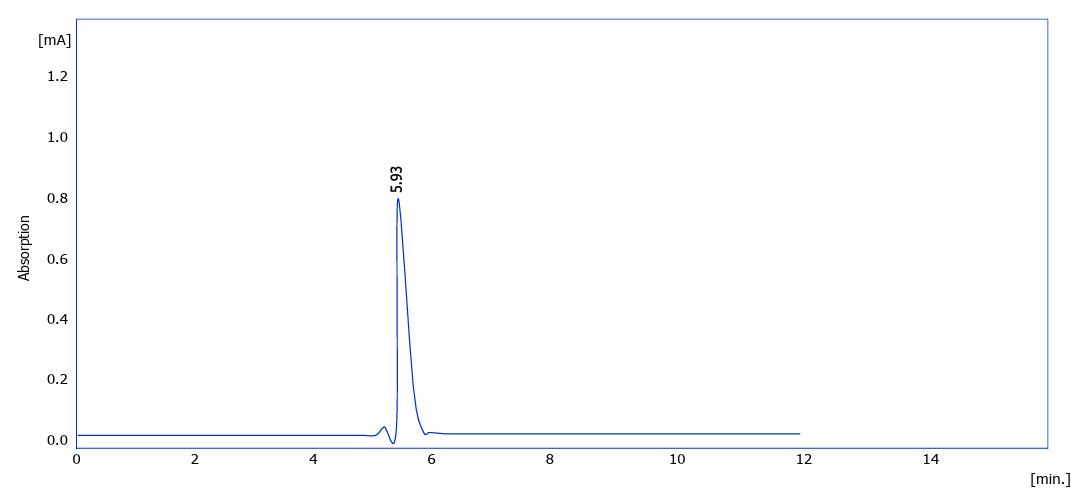
Figures 5 and 6 show the HPLC chromatograms of the carotenoid extract produced by Rhodotorula mucilaginosa H1 and the β-carotene standard, respectively. The corresponding chromatographic peak parameters are presented in Tables 6 and 7. The results showed a major peak for the carotenoids produced by the yeast at a retention time of 5.98 min, with an area of 25589.08 mAU∙s and a height of 745.98 mAU. This result was close to the chromatogram of the standard β-carotene, which showed a peak at a retention time of 5.93 min. Accordingly, the chromatographic profile of the carotenoid extract obtained from R. mucilaginosa H1 showed a peak consistent with β-carotene.
Figure 5. High-performance liquid chromatography (HPLC) chromatogram of carotenoids produced by Rhodotorula mucilaginosa
Figure 6. High-performance liquid chromatography (HPLC) chromatogram of standard β-carotene
Table 6. High-performance liquid chromatography (HPLC) peak parameters of carotenoids produced by Rhodotorula mucilaginosa H1
|
No. |
Retention Time [min] |
Area [mAU∙s] |
Height [mAU] |
Area [%] |
Height [%] |
W 05 [min] |
|
1 |
5.98 |
25589.08 |
745.98 |
100.00 |
100.00 |
0.25 |
|
|
Total |
25589.08 |
745.98 |
100.00 |
100.00 |
|
Table 7. High-performance liquid chromatography (HPLC) peak parameters of the β-carotene standard
|
No. |
Retention Time [min] |
Area [mAU∙s] |
Height [mAU] |
Area [%] |
Height [%] |
W 05 [min] |
|
1 |
5.93 |
4587.78 |
798.08 |
100.00 |
100.00 |
0.25 |
|
|
Total |
4587.78 |
798.08 |
100.00 |
100.00 |
|
This study demonstrated the preliminary ability to isolate carotenoid-producing pigmented yeasts from different local sources, including flowers, soil, and local sweets. Among the tested isolates, the soil-derived isolate H1 showed the highest biomass and carotenoid production under the experimental conditions when cultivated in YMF medium containing FWE. Molecular identification based on ITS-region analysis identified the selected isolate as Rhodotorula mucilaginosa. In addition, the close similarity between the HPLC retention time of the extracted pigment and that of the β-carotene standard suggested that β-carotene was a major component of the produced carotenoids. Preliminary results show that the local isolate R. mucilaginosa H1 is capable of producing carotenoids under the experimental conditions established in this study. However, determining its suitability for practical applications or industrial production requires further studies, including evaluating pigment stability, detecting solvent residues, verifying its safety for food use and its practical efficacy, as well as optimizing production conditions and exploring the possibility of scaling up the process.
The researchers extend their sincere thanks and appreciation to the Presidency of the University of Mosul, the Deanship of the College of Agriculture and Forestry, and the Department of Food Science, for their continuous support that contributed to the completion of this work.
The ITS sequence of the local isolate H1 was submitted to the GenBank database of the National Center for Biotechnology Information (NCBI) under submission number SUB16176960 and was still under review at the time of manuscript preparation.
|
A450 |
Absorbance at 450 nm, dimensionless |
|
A570 |
Absorbance at 570 nm, dimensionless |
|
F |
Conversion factor, equivalent to 4.80 µg β-carotene mL⁻¹ solvent |
|
M |
Total carotenoid content, µg L⁻¹ |
|
OD570 |
Optical density at 570 nm, dimensionless |
|
R |
Spectrophotometric absorbance reading at 450 nm, dimensionless |
|
RT |
Retention time, min |
|
Vc |
Volume of culture used for carotenoid extraction, mL |
|
Vs |
Total volume of solvent used for carotenoid extraction, mL |
|
Greek symbols |
|
|
β (Beta) |
as in β-carotene |
|
Subscripts |
|
|
c |
Culture |
|
s |
Solvent |
|
Abbreviations |
|
|
DNS |
5-Dinitrosalicylic acid |
|
FWE |
Fruit waste extract |
|
HPLC |
High-performance liquid chromatography |
|
ITS |
Internal transcribed spacer |
|
PCR |
Polymerase chain reaction |
|
PDA |
Potato dextrose agar |
|
YMA |
Yeast malt extract agar |
|
YMB |
Yeast malt extract broth |
|
YMF |
Yeast extract–malt extract–fruit waste extract |
[1] Singh, T., Pandey, V.K., Dash, K.K., Zanwar, S., Singh, R. (2023). Natural bio-colorant and pigments: Sources and applications in food processing. Journal of Agriculture and Food Research, 12: 100628. https://doi.org/10.1016/j.jafr.2023.100628
[2] Dey, S., Nagababu, B.H. (2022). Applications of food color and bio-preservatives in the food and its effect on the human health. Food Chemistry Advances, 1: 100019. https://doi.org/10.1016/j.focha.2022.100019
[3] Mohammadi, M.A., Ahangari, H., Mousazadeh, S., Hosseini, S.M., Dufossé, L. (2022). Microbial pigments as an alternative to synthetic dyes and food additives: A brief review of recent studies. Bioprocess and Biosystems Engineering, 45: 1-12. https://doi.org/10.1007/s00449-021-02621-8
[4] Allied Market Research. (2022). Carotenoids market expected to reach $2.7 billion by 2031. https://www.alliedmarketresearch.com/press-release/carotenoids-market.html.
[5] Fawzy, S., Wang, W.L., Wu, M.Q., Yi, G.F., Huang, X.X. (2022). Effects of dietary different canthaxanthin levels on growth performance, antioxidant capacity, biochemical and immune-physiological parameters of white shrimp (Litopenaeus vannamei). Aquaculture, 556: 738276. https://doi.org/10.1016/j.aquaculture.2022.738276
[6] Rekha, R., Nimsi, K.A., Manjusha, K., Sirajudheen, T.K. (2024). Marine yeast Rhodotorula paludigena VA 242 a pigment enhancing feed additive for the Ornamental Fish Koi Carp. Aquaculture and Fisheries, 9(1): 66-70. https://doi.org/10.1016/j.aaf.2022.05.008
[7] USFDA. (2021). Overview of food ingredients, additives and colors. http://www.foodtestingindia.com/usfda-overview-of-food-ingredients-additives-colors/.
[8] EFSA. (2021). Food colours. European Food Safety Authority. https://www.efsa.europa.eu/en/topics/topic/food-colours.
[9] Roy, S., Dora, K.C., Kumar, S., et al. (2026). A critical review on technical advances and multifaceted role of carotenoids in human health with special emphasis on metabolic diseases. Phytochemistry Reviews, 25: 1067-1092. https://doi.org/10.1007/s11101-025-10156-z
[10] Farkas, Á., Bencsik, T., Deli, J. (2020). Carotenoids as food additives. In Pigments from Microalgae Handbook, Springer, Cham, pp. 421-447. https://doi.org/10.1007/978-3-030-50971-2_17
[11] Kurtzman, C.P., Fell, J.W., Boekhout, T. (2011). The Yeasts: A Taxonomic Study (5th ed.). Elsevier.
[12] Wilachai, K., Paengkoum, P., Taethaisong, N., et al. (2025). Effect of isolation ruminal yeast from ruminants on in vitro ruminal fermentation. Veterinary Sciences, 12(2): 155. https://doi.org/10.3390/vetsci12020155
[13] Anshi, Kaur, H., Goswami, L., Kapil, S., Sharma, V. (2025). Isolation, optimization and characterization of Rhodotorula alborubescens for dietary pigment β-carotene production. Applied Microbiology, 5(2): 54. https://doi.org/10.3390/applmicrobiol5020054
[14] Radchenkova, N., Stefanova, P., Gouliamova, D. (2025). Biochemical and physiological profiles of Nakaseomyces glabratus isolates from Bulgarian clinical samples. Life, 15(6), 889. https://doi.org/10.3390/life15060889
[15] Tarangini, K., Mishra, S. (2014). Carotenoid production by Rhodotorula sp. on fruit waste extract as a sole carbon source and optimization of key parameters. Iranian Journal of Chemistry and Chemical Engineering, 33(3): 89-99. https://doi.org/10.30492/ijcce.2014.11344
[16] Miller, G.L. (1959). Use of dinitrosalicylic acid reagent for determination of reducing sugar. Analytical Chemistry, 31(3): 426-428. https://doi.org/10.1021/ac60147a030
[17] Dubois, M., Gilles, K.A., Hamilton, J.K., Rebers, P.A., Smith, F. (1956). Colorimetric method for determination of sugars and related substances. Analytical Chemistry, 28(3): 350-356. https://doi.org/10.1021/ac60111a017
[18] Khalaf, A.A., Ahmed, K.N. (2025). Isolation and diagnosis of Rhodotorula yeast and evaluation of its effectiveness on the production of beta-carotene pigment. IOP Conference Series: Earth and Environmental Science, 1449: 012156. https://doi.org/10.1088/1755-1315/1449/1/012156
[19] Park, P.K., Cho, D.H., Kim, E.Y., Chu, K.H. (2005). Optimization of carotenoid production by Rhodotorula glutinis using statistical experimental design. World Journal of Microbiology and Biotechnology, 21: 429-434. https://doi.org/10.1007/s11274-004-1891-3
[20] Hladnik, L., Vicente, F.A., Košir, A., Grilc, M., Likozar, B. (2023). Stirred, ultrasound-assisted and microwave-assisted extraction process of β-carotene from Rhodotorula glutinis in biorefinery downstream. Separation and Purification Technology, 311: 123293. https://doi.org/10.1016/j.seppur.2023.123293
[21] Li, H., Chen, M., Zhu, L., Liu, L.J., Wang, J.Y. (2006). Simultaneous determination of four carotenoids in health products by reversed-phase high-performance liquid chromatography. Se Pu, 24(5): 475-478. https://pubmed.ncbi.nlm.nih.gov/17165541/.
[22] Pumeesat, P., Nasom, L., Thongdee, K., et al. (2024). Molecular identification and extracellular enzyme production of Rhodotorula spp. Italian Journal of Mycology, 53(1): 147-159. https://doi.org/10.6092/issn.2531-7342/19363
[23] Mikić, A., Alomari, A., Gowers, D.M. (2023). Classical recombinant DNA cloning. In DNA Manipulation and Analysis. Methods in Molecular Biology, vol 2633. Humana, New York, NY, pp. 1-24. https://doi.org/10.1007/978-1-0716-3004-4_1
[24] Hoondee, P., Tedsree, N., Phuengjayaem, S., et al. (2026). Characterization of red pigmented yeasts and genes associated with astaxanthin synthesis in Rhodotorula mucilaginosa HL26-1 and Rhodotorula paludigena LL69-1. F1000Research, 14: 717. https://doi.org/10.12688/f1000research.164600.2
[25] Lucas, D.C.R., Chisté, R.C. (2025). Brazilian biomes as promising resources of Rhodotorula yeasts for the biotechnological production of carotenoids. Chemistry & Biodiversity, 22(10): e00469. https://doi.org/10.1002/cbdv.202500469
[26] Šovljanski, O., Cvetković, D., Budimac, T., et al. (2025). A potential of agro-industrial biowaste as low-cost substrates for carotenoid production by Rhodotorula mucilaginosa. Fermentation, 11(9): 531. https://doi.org/10.3390/fermentation11090531
[27] Fonseca, R.S.K., Lotas, K.M., Cortez, A.C.A., et al. (2025). Exploration of carotenoid-producing Rhodotorula yeasts from Amazonian substrates for sustainable biotechnology applications. Current Research in Microbial Sciences, 8: 100373. https://doi.org/10.1016/j.crmicr.2025.100373
[28] Hue, L.A., Nhan, N.T.T., Chon, N.M. (2023). Isolation and identification of carotenoid-producing Rhodotorula sp. from soils collected in the coastal environment of Kien Giang and Tra Vinh provinces. Vietnam Journal of Science, Technology and Engineering, 65(2): 71-78. https://doi.org/10.31276/VJSTE.65(2).71-78