Sanggam Dera Rosa Tampubolon* | Mai Fernando Nainggolan | Tualar Simarmata | Paska Marto Hasugian
© 2026 The authors. This article is published by IIETA and is licensed under the CC BY 4.0 license (http://creativecommons.org/licenses/by/4.0/).
OPEN ACCESS
Eight monitoring stations were sampled in February 2026 in the Pangururan area of Lake Toba to evaluate heavy metal contamination under different anthropogenic influences. Heavy metal concentrations (cadmium (Cd), zinc (Zn), copper (Cu), mercury (Hg), iron (Fe), lead (Pb), and cyanide (CN⁻)) were determined using the Standard Methods of the American Public Health Association (APHA). Descriptive statistics, Pearson correlation analysis, and Principal Component Analysis (PCA) were employed to characterize spatial variation and identify the dominant variables influencing water quality. Water quality status was evaluated in accordance with the Indonesian Government Regulation No. 22 of 2021, under which monitoring stations exceeding the Fe standard were categorized as polluted. The results showed that Fe was the only parameter exceeding the applicable regulatory standard at several monitoring stations, whereas the remaining heavy metals remained below the corresponding threshold values. PCA identified Fe as the dominant variable contributing to spatial variability among the monitoring stations. Although supervised machine learning algorithms were initially explored during the analytical workflow, the limited dataset (n = 8 monitoring stations; L1 = 5 and L2 = 3) did not permit statistically reliable model evaluation. Therefore, the findings presented in this study are based primarily on descriptive statistics and multivariate analysis. These results provide baseline information for future large-scale and seasonal monitoring of heavy metal contamination in Lake Toba.
ecological assessment, environmental monitoring, water quality assessment, Principal Component Analysis, Lake Toba
Lake Toba is the largest volcanic lake in Southeast Asia and plays an important ecological, social, and economic role for surrounding communities [1]. The lake serves as a major freshwater resource, supports fisheries and aquaculture, provides transportation routes, and is one of Indonesia’s priority tourism destinations [2]. Owing to its strategic importance, Lake Toba has experienced increasing anthropogenic pressures associated with tourism development, floating net cage aquaculture, agriculture, residential expansion, and water transportation, all of which may affect the lake’s water quality and ecological condition [3].
Previous investigations of Lake Toba have mainly focused on conventional water quality parameters, including dissolved oxygen (DO), biological oxygen demand (BOD), chemical oxygen demand (COD), nutrients, and general limnological characteristics [4-6]. Comparatively fewer studies have investigated heavy metal contamination using integrated multivariate statistical approaches, particularly Principal Component Analysis (PCA), to identify dominant factors controlling spatial variation in water quality. Consequently, additional research is needed to improve understanding of heavy metal distribution and the dominant environmental variables influencing water quality within areas exposed to different anthropogenic pressures.
Among the various contaminants found in freshwater ecosystems, heavy metals are of particular concern because of their persistence, low biodegradability, and potential to accumulate in aquatic environments [7]. Metals such as cadmium (Cd), lead (Pb), mercury (Hg), copper (Cu), zinc (Zn), and iron (Fe) may originate from both natural geological processes and anthropogenic activities, including agriculture, domestic wastewater discharge, aquaculture, and water transportation [8-10]. Elevated concentrations of these metals may indicate localized environmental pressure and therefore provide useful information for evaluating spatial variations in water quality.
Heavy metal contamination in Lake Toba is influenced by both natural and anthropogenic processes. The volcanic origin and geological characteristics of the Lake Toba basin naturally contribute metallic elements through weathering and geochemical processes [11]. However, increasing anthropogenic activities, including intensive aquaculture, domestic wastewater discharge, agricultural runoff, tourism, and water transportation, are considered the primary drivers accelerating heavy metal inputs into the aquatic environment [12, 13]. Continuous accumulation of these contaminants may gradually reduce the ecological carrying capacity of the lake and compromise its function as an important freshwater ecosystem.
Heavy metal monitoring has become an increasingly important component of freshwater quality assessment because these contaminants exhibit different environmental behaviors compared with conventional physicochemical parameters. While parameters such as DO, pH, BOD, and COD often fluctuate in response to short-term environmental changes, heavy metals tend to persist longer within aquatic systems and may reflect cumulative impacts from both natural and anthropogenic sources. Consequently, evaluating the spatial distribution of heavy metals provides complementary information for understanding localized environmental pressures and supporting evidence-based water quality management.
Because heavy metals rarely occur independently in aquatic environments, interpretation based solely on individual concentration values may not adequately describe contamination patterns. Relationships among different metals may reflect similarities in geological origin, anthropogenic inputs, transport pathways, or environmental processes occurring within the watershed. Therefore, multivariate statistical techniques have been widely adopted in environmental studies to simplify complex datasets, identify dominant variables, and reveal potential associations among contaminants. Among these techniques, PCA is one of the most commonly applied methods because it effectively reduces data dimensionality while retaining most of the information contained in multivariate datasets [14]. PCA provides an efficient approach for identifying the variables contributing most strongly to spatial variability in water quality and supports interpretation of complex environmental datasets.
Recent advances in environmental data analysis have encouraged the application of machine learning methods as complementary tools for pattern recognition and classification of multivariate datasets [15, 16]. Nevertheless, the reliability of supervised machine learning models depends fundamentally on the availability of sufficiently large, representative, and balanced datasets for both model training and validation. When only a small number of observations are available, performance metrics obtained through cross-validation may be highly unstable and should not be interpreted as evidence of predictive capability. Therefore, in studies based on limited environmental datasets, machine learning is more appropriately regarded as a methodological demonstration rather than as a robust predictive approach.
Previous investigations of Lake Toba have mainly focused on conventional water quality parameters, including DO, BOD, COD, nutrients, and general limnological characteristics [11, 17]. Comparatively fewer studies have investigated heavy metal contamination using integrated multivariate statistical approaches combined with exploratory machine learning techniques. Furthermore, most previous studies have emphasized descriptive assessments of water quality, while limited attention has been given to identifying dominant heavy metal variables and evaluating whether statistical patterns among monitoring stations can be explored using complementary classification methods. Consequently, additional research is required to improve understanding of spatial variation in heavy metal concentrations within areas subjected to different anthropogenic pressures.
Therefore, this study aimed to evaluate heavy metal contamination in the Pangururan area of Lake Toba using descriptive statistics, Pearson correlation analysis, and PCA. These approaches were employed to characterize the spatial distribution of heavy metals and to identify the dominant variables influencing variation in water quality among monitoring stations. Although supervised machine learning algorithms were initially explored during the analytical workflow, the available dataset consisted of only eight monitoring stations (L1 = 5; L2 = 3), which was insufficient for statistically reliable model evaluation. Accordingly, the scientific findings and conclusions presented in this study are based primarily on descriptive statistics, correlation analysis, and PCA. The results provide baseline information to support future studies involving larger datasets, broader spatial coverage, and repeated seasonal monitoring for sustainable management of the Lake Toba freshwater ecosystem.
2.1 Study area and water sampling
This study was conducted in the Pangururan area of Lake Toba, North Sumatra, Indonesia, during a single sampling campaign in February 2026. The study area was selected because it represents various anthropogenic activities that may influence water quality, including floating net cage aquaculture, tourism, residential settlements, agricultural land, river inflows, and water transportation.
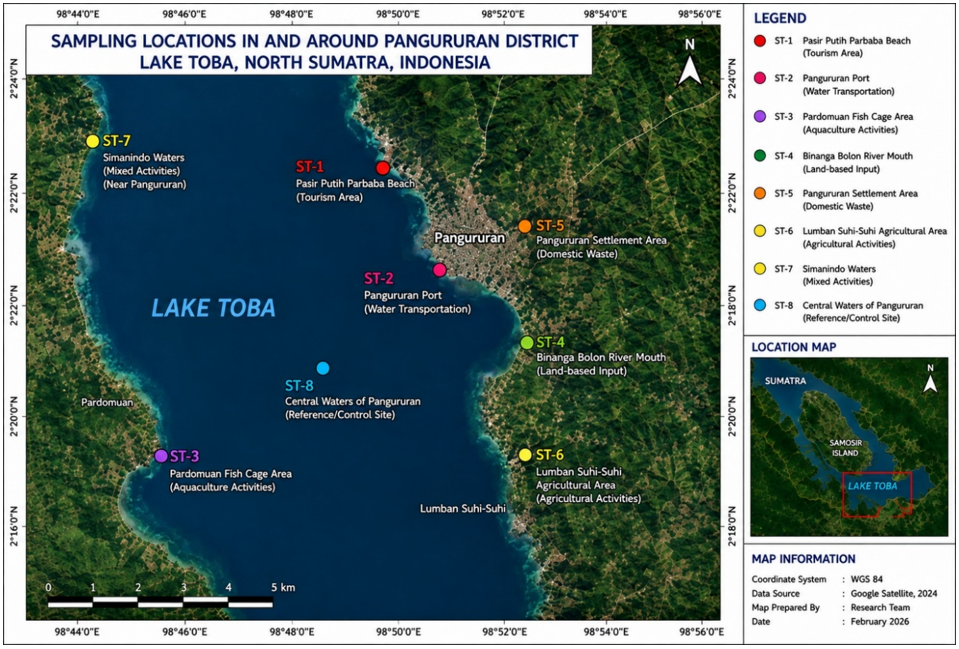
Eight monitoring stations were established using purposive sampling to represent the dominant land-use characteristics and potential pollution sources within the study area. The selected stations consisted of a tourism area (S1), harbor area (S2), floating net cage aquaculture area (S3), agricultural runoff area (S4), residential settlement (S5), river inflow (S6), transitional water zone (S7), and a reference site with relatively low anthropogenic influence (S8). The geographical distribution of the monitoring stations is presented in Figure 1.
Figure 1. Sampling locations in and around Pangururan District, Lake Toba
Table 1. Summary of water sampling design and sample processing
|
Station |
Sampling Site Characteristics |
Surface Samples (30–50 cm) |
Intermediate Samples |
Near-Bottom Samples |
Total Water Samples Collected |
Laboratory Replicates |
Value Used in Statistical Analysis |
|
S1 |
Tourism area |
3 |
– |
– |
3 |
Triplicate |
Mean concentration |
|
S2 |
Harbor area |
3 |
– |
– |
3 |
Triplicate |
Mean concentration |
|
S3 |
Floating net cage aquaculture |
3 |
1 |
1 |
5 |
Triplicate |
Mean concentration |
|
S4 |
Agricultural runoff area |
3 |
– |
– |
3 |
Triplicate |
Mean concentration |
|
S5 |
Residential settlement |
3 |
1 |
1 |
5 |
Triplicate |
Mean concentration |
|
S6 |
River inflow |
3 |
– |
– |
3 |
Triplicate |
Mean concentration |
|
S7 |
Transitional water |
3 |
– |
– |
3 |
Triplicate |
Mean concentration |
|
S8 |
Reference site |
3 |
– |
– |
3 |
Triplicate |
Mean concentration |
Table 1 shows each monitoring station; surface water samples were collected approximately 30-50 cm below the water surface using a pre-cleaned water sampler. Each sample was collected in triplicate to minimize analytical uncertainty. At selected stations representing relatively deeper waters, additional samples were collected from intermediate and near-bottom layers to observe vertical variation in heavy metal concentrations. However, because the objective of this study was to compare water quality among monitoring stations, only the average concentration from triplicate measurements at each station was used in subsequent statistical analyses, yielding one representative value per station.
Water samples were transferred into 1 L polyethylene bottles previously washed with detergent, rinsed with distilled water, soaked in 10% nitric acid (HNO₃), and finally rinsed with deionized water before sampling. Samples for heavy metal analysis were immediately acidified to pH < 2 using ultrapure HNO₃ and preserved in an ice box at approximately 4 ℃ during transportation to the laboratory following the American Public Health Association (APHA) Standard.
To improve analytical precision, each water sample was analyzed in triplicate in the laboratory. The arithmetic mean of the triplicate measurements was used to represent each sampling point. Consequently, although 28 field samples were collected, the statistical analyses, including descriptive statistics, correlation analysis, PCA, and machine learning classification, were performed using eight representative station-level observations.
2.2 Water quality and heavy metal analysis
Field measurements included temperature, pH, DO, total dissolved solids (TDS), BOD, and COD, following the procedures described in the Standard Methods for the Examination of Water and Wastewater published by the APHA. These parameters were measured to characterize the general physicochemical condition of the sampling sites and to support interpretation of heavy metal contamination.
Heavy metal analysis included Cd, Zn, Cu, Hg, Fe, Pb, and cyanide (CN⁻). Water samples were digested using HNO₃ and perchloric acid (HClO₄) according to APHA procedures before instrumental analysis. Concentrations of Cd, Zn, Cu, Hg, Fe, and Pb were determined using Atomic Absorption Spectrophotometry (AAS) and Inductively Coupled Plasma Optical Emission Spectrometry (ICP-OES), whereas CN⁻ was analyzed using spectrophotometric methods.
Table 2. Data used for statistical analysis
|
Analysis |
Observation Unit |
Number of Observations (n) |
|
Descriptive statistics |
Monitoring stations |
8 |
|
Pearson correlation |
Monitoring stations |
8 |
|
Principal Component Analysis (PCA) |
Monitoring stations |
8 |
|
Support Vector Machine |
Monitoring stations |
8 |
|
Random Forest |
Monitoring stations |
8 |
|
Logistic Regression |
Monitoring stations |
8 |
The analytical results were compared with the Indonesian water quality standards specified in Government Regulation of the Republic of Indonesia No. 22 of 2021 and the World Health Organization (WHO) Guidelines for Drinking-water Quality, depending on the parameter evaluated. Compliance with these standards was used to identify parameters exceeding the applicable threshold values.
To provide a clear overview of the analytical dataset used in the study, Table 2 summarizes the observations included in each statistical analysis.
For subsequent statistical analyses, heavy metal concentrations were used as the primary variables because the objective of the study was to investigate spatial variation in heavy metal contamination. Physicochemical parameters were used as supporting information for describing environmental conditions but were not included in the machine learning classification.
Although 28 field water samples were collected, only the average concentration of each monitoring station was used in the statistical analyses. Therefore, the analytical dataset consisted of eight station-level observations representing the spatial distribution of heavy metal concentrations across the study area.
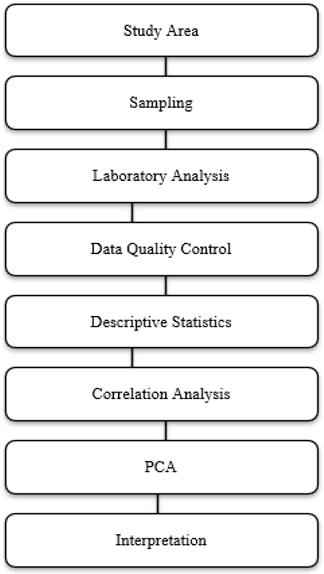
Figure 2. Overall methodological workflow
Because the analytical dataset was relatively small, the machine learning algorithms were implemented solely as exploratory classification tools. Their purpose was to investigate whether heavy metal concentration patterns could distinguish monitoring stations according to predefined water quality classes rather than to develop predictive models suitable for operational application. Consequently, the classification results should be interpreted together with the descriptive statistics and multivariate analyses.
To provide a comprehensive overview of the research procedure, the methodological workflow adopted in this study is presented in Figure 2. The workflow summarizes the sequential stages of the investigation, beginning with study area selection, field sampling, laboratory analysis, data preprocessing, descriptive statistical analysis, correlation analysis, PCA, and exploratory machine learning classification.
As illustrated in Figure 2, laboratory results were first subjected to quality control and descriptive statistical analysis before being standardized using z-score normalization. The standardized heavy metal concentration data were subsequently analyzed using Pearson correlation analysis to evaluate relationships among variables and PCA to identify the dominant factors explaining spatial variability. The interpretation presented in this study is therefore based on descriptive and multivariate statistical analyses.
2.3 Statistical analysis
Descriptive statistical analysis was performed to summarize the distribution of heavy metal concentrations measured at the eight monitoring stations. For each parameter, the mean, standard deviation, minimum, and maximum values were calculated to characterize spatial variability in water quality. Before multivariate analysis, all heavy metal concentration data were standardized using z-score normalization to eliminate differences in measurement scales among variables.
Pearson correlation analysis was conducted to evaluate linear associations among the measured heavy metals. Because the analysis was based on only eight monitoring stations, the resulting correlation coefficients were interpreted as exploratory indicators of association rather than evidence of causal relationships or common pollution sources.
PCA was subsequently applied to reduce the dimensionality of the standardized heavy metal dataset and to identify the variables contributing most strongly to spatial variation among the monitoring stations. PCA was performed using the correlation matrix of standardized variables. Principal components with eigenvalues greater than 1.0 were retained according to the Kaiser criterion [18]. Eigenvalues, explained variance, cumulative variance, loading values, and score plots were used to interpret the multivariate structure of the dataset.
During the preliminary analytical stage, supervised machine learning algorithms were initially explored to examine the feasibility of classifying monitoring stations according to their water quality status. Monitoring stations with Fe concentrations exceeding the threshold specified in the Indonesian Government Regulation No. 22 of 2021 were assigned to class L2 (Polluted), whereas stations meeting the applicable standard were assigned to class L1 (Safe). However, the analytical dataset consisted of only eight monitoring stations (L1 = 5 and L2 = 3), resulting in an insufficient number of observations for statistically reliable evaluation of supervised machine learning models. Under these conditions, cross-validation performance metrics would be highly unstable and should not be interpreted as evidence of predictive capability. Therefore, the machine learning analysis was not included in the scientific interpretation presented in this study, and the findings are based primarily on descriptive statistics, Pearson correlation analysis, and PCA.
All statistical analyses were performed using Python (version 3.12). Descriptive statistics, correlation analysis, and PCA were implemented using standard scientific computing libraries to ensure reproducibility of the analytical workflow [19].
3.1 Water quality and heavy metal concentrations
The water quality assessment was conducted using eight monitoring stations distributed across the Pangururan area of Lake Toba to represent different anthropogenic activities, including tourism, aquaculture, residential settlements, agriculture, river inflows, and water transportation. Heavy metal concentrations were determined from the mean values of triplicate laboratory analyses for each monitoring station. The resulting station-level dataset was subsequently used for descriptive statistics, multivariate analysis, and exploratory machine learning classification.
Table 3 summarizes the concentrations of Cd, Zn, Cu, Hg, Fe, Pb, and CN⁻ together with the applicable Indonesian water quality standards under Government Regulation of the Republic of Indonesia No. 22 of 2021. The comparison between measured concentrations and regulatory thresholds provides the basis for identifying parameters that exceeded the recommended limits.
The measured concentrations indicate that Fe was the only parameter approaching or exceeding the applicable Indonesian water quality standard at several monitoring stations. Fe concentrations ranged from 0.22 to 0.36 mg/L, with the highest concentration observed at Station S3 (0.36 mg/L), followed by Station S2 (0.32 mg/L) and Station S5 (0.31 mg/L). These three stations exceeded the regulatory threshold of 0.30 mg/L, whereas the remaining stations complied with the applicable standard.
In contrast, the concentrations of Cd, Zn, Cu, Hg, Pb, and CN⁻ remained relatively low and exhibited only limited spatial variation among the monitoring stations. Cd concentrations ranged from 0.0009 to 0.0020 mg/L, Zn from 0.018 to 0.028 mg/L, Cu from 0.015 to 0.021 mg/L, Hg from 0.0008 to 0.0014 mg/L, Pb from 0.010 to 0.014 mg/L, and CN⁻ from 0.011 to 0.016 mg/L. Based on the applicable regulatory thresholds, these parameters did not indicate widespread exceedance within the investigated area during the sampling period.
The observed spatial variation in Fe concentrations may reflect differences in local environmental conditions and anthropogenic activities surrounding individual monitoring stations. Stations S2, S3, and S5 are located in areas characterized by intensive harbor activities, floating net cage aquaculture, and residential settlements, respectively, where localized inputs from domestic wastewater, infrastructure corrosion, aquaculture operations, and watershed runoff may contribute to elevated Fe concentrations. However, because this study was based on a single sampling campaign conducted during February 2026, these observations should be interpreted as preliminary evidence of spatial variation rather than confirmation of persistent pollution sources.
Table 3. Heavy metal concentrations at the monitoring stations and comparison with Indonesian water quality standards
|
Station |
Cd (mg/L) |
Zn (mg/L) |
Cu (mg/L) |
Hg (mg/L) |
Fe (mg/L) |
Pb (mg/L) |
CN⁻ (mg/L) |
Fe Status |
|
S1 |
0.0011 |
0.021 |
0.020 |
0.0012 |
0.27 |
0.011 |
0.012 |
Below standard |
|
S2 |
0.0009 |
0.019 |
0.019 |
0.0013 |
0.32 |
0.012 |
0.013 |
Exceeded |
|
S3 |
0.0014 |
0.024 |
0.017 |
0.0009 |
0.36 |
0.013 |
0.014 |
Exceeded |
|
S4 |
0.0013 |
0.026 |
0.018 |
0.0008 |
0.29 |
0.014 |
0.011 |
Below standard |
|
S5 |
0.0012 |
0.028 |
0.015 |
0.0011 |
0.31 |
0.014 |
0.016 |
Exceeded |
|
S6 |
0.0014 |
0.018 |
0.016 |
0.0013 |
0.25 |
0.010 |
0.012 |
Below standard |
|
S7 |
0.0017 |
0.019 |
0.015 |
0.0014 |
0.22 |
0.012 |
0.011 |
Below standard |
|
S8 |
0.0020 |
0.018 |
0.021 |
0.0008 |
0.26 |
0.013 |
0.013 |
Below standard |
Table 4. Summary of heavy metal compliance with Indonesian Government Regulation No. 22 of 2021
|
Parameter |
Observed Range (mg/L) |
Applicable Standard (mg/L) |
Stations Exceeding Standard |
|
Cd |
0.0009-0.0020 |
According to PP No.22/2021 |
None |
|
Zn |
0.018-0.028 |
According to PP No.22/2021 |
None |
|
Cu |
0.015-0.021 |
According to PP No.22/2021 |
None |
|
Hg |
0.0008-0.0014 |
According to PP No.22/2021 |
None |
|
Fe |
0.22-0.36 |
0.30 |
S2, S3, S5 |
|
Pb |
0.010-0.014 |
According to PP No.22/2021 |
None |
|
CN⁻ |
0.011-0.016 |
According to PP No.22/2021 |
None |
To facilitate comparison among monitoring stations shown in Table 4, the compliance status of each parameter was further evaluated against the Indonesian water quality standards. The assessment identified Fe as the only parameter exceeding the regulatory threshold during the present survey, whereas all other analyzed heavy metals remained below the applicable standards.
The results indicate that the overall heavy metal contamination observed during the survey was relatively limited, with Fe representing the principal parameter requiring further attention. Nevertheless, the current findings should not be interpreted as evidence of long-term deterioration of Lake Toba because the investigation was restricted to eight monitoring stations within the Pangururan area and was conducted during a single sampling period. Seasonal monitoring involving additional sampling stations, sediment analysis, and aquatic biota is therefore recommended to verify whether the observed spatial pattern remains consistent over time.
3.2 Correlation analysis of heavy metals
Following the descriptive statistical assessment, Pearson correlation analysis was conducted to evaluate the relationships among the measured heavy metals and to identify variables exhibiting similar spatial behaviour across the monitoring stations. Because the analysis was based on only eight monitoring stations, the correlation coefficients should be interpreted as exploratory indicators of association rather than conclusive evidence of common pollution sources or causal relationships. To facilitate interpretation of the strongest relationships among the measured variables, the principal correlation coefficients are summarized in Table 5.
Table 5. Summary of Pearson correlation coefficients among heavy metals measured at the monitoring stations
|
Variable Pair |
Correlation Coefficient (r) |
Strength of Association |
Interpretation |
|
Zn-Pb |
0.73 |
Strong positive |
Positive association |
|
Fe-CN⁻ |
0.62 |
Moderate positive |
Positive association |
|
Fe-Zn |
0.55 |
Moderate positive |
Positive association |
|
Zn-CN⁻ |
0.49 |
Moderate positive |
Positive association |
|
Fe-Pb |
0.45 |
Moderate positive |
Positive association |
|
Pb-CN⁻ |
0.41 |
Moderate positive |
Positive association |
|
Hg-Pb |
–0.68 |
Strong negative |
Negative association |
|
Cd-Fe |
–0.49 |
Moderate negative |
Negative association |
|
Hg-Zn |
–0.43 |
Moderate negative |
Negative association |
|
Hg-Cu |
–0.42 |
Moderate negative |
Negative association |
|
Cd-Cu |
0.06 |
Very weak |
Negligible association |
|
Fe-Cu |
0.06 |
Very weak |
Negligible association |
|
Cu-Pb |
–0.04 |
Very weak |
Negligible association |
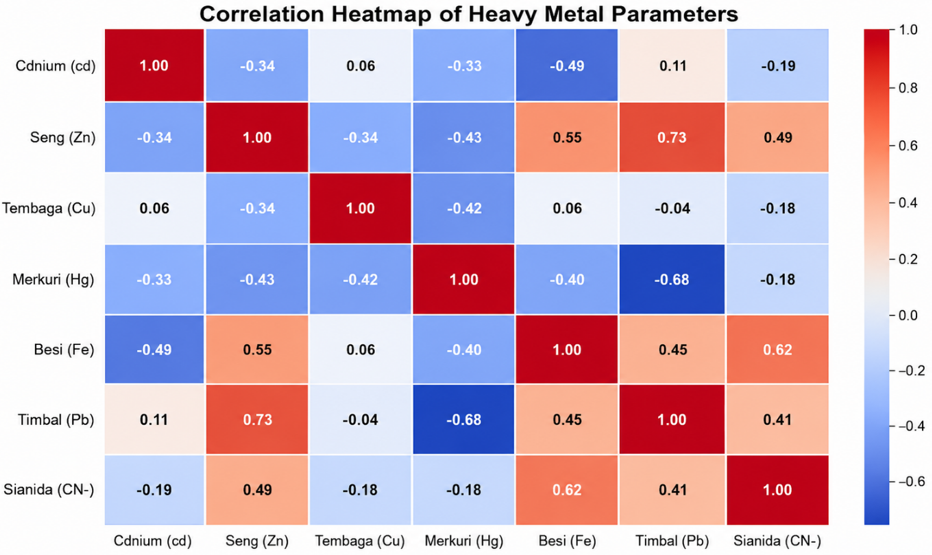
Figure 3. Pearson correlation matrix showing the relationships among heavy metal concentrations measured at the eight monitoring stations in the Pangururan area of Lake Toba
As illustrated in Figure 3, the relatively stronger associations involving Fe, Zn, Pb, and CN⁻ suggest that these parameters exhibited similar spatial variation among the monitoring stations. Nevertheless, these relationships should not be interpreted as confirmation of common pollution sources because correlation analysis alone cannot distinguish between anthropogenic inputs, natural geological influences, or coincidental spatial variation. Instead, the observed correlations provide preliminary evidence that these variables may respond similarly to local environmental conditions within the study area.
Figure 3 illustrates the complete Pearson correlation matrix among the analyzed heavy metals. The strongest positive correlation was observed between Zn and Pb (r = 0.73), followed by Fe and CN⁻ (r = 0.62) and Fe and Zn (r = 0.55). Moderate positive correlations were also identified between Fe and Pb (r = 0.45), Zn and CN⁻ (r = 0.49), and Pb and CN⁻ (r = 0.41). These positive associations indicate that increases in one parameter tended to coincide with increases in the other parameter across the monitoring stations.
Conversely, several negative correlations were identified among the measured variables. The strongest inverse relationship occurred between Hg and Pb (r = –0.68), while moderate negative correlations were observed between Cd and Fe (r = –0.49), Hg and Zn (r = –0.43), and Hg and Cu (r = –0.42). Weak correlations were found for several variable pairs, including Cd and Cu (r = 0.06), Fe and Cu (r = 0.06), and Cu and Pb (r = –0.04), suggesting limited linear association among these parameters within the available dataset.
The descriptive assessment demonstrated that Fe was the only heavy metal exceeding the applicable regulatory standard at several monitoring stations and therefore represented the principal source of spatial variation within the study area. To further investigate the relationships among the measured heavy metals and identify the dominant variables contributing to this spatial variability, Pearson correlation analysis and PCA were subsequently performed. Although supervised machine learning algorithms were initially explored during the analytical stage, the available dataset (n = 8 monitoring stations; L1 = 5 and L2 = 3) was insufficient for statistically reliable model evaluation. Consequently, the following discussion focuses exclusively on descriptive statistics and multivariate statistical analyses.
The correlation analysis also provides supporting information for the subsequent PCA. Variables exhibiting moderate to strong correlations are expected to contribute jointly to the principal components that explain the largest proportion of data variability. In particular, the moderate positive relationship between Fe and Zn is consistent with the PCA results presented in the following section, where both variables contribute substantially to the first principal component.
It should be emphasized that the present correlation analysis was based on only eight monitoring stations sampled during a single field campaign. Consequently, the statistical power of the correlation coefficients is limited, and the observed relationships should be interpreted cautiously. Future studies involving a larger number of monitoring stations, repeated seasonal sampling, and complementary sediment and biota analyses would provide a more robust basis for evaluating the relationships among heavy metals in Lake Toba.
3.3 Principal Component Analysis
PCA was performed to reduce the dimensionality of the heavy metal dataset and to identify the variables contributing most strongly to the spatial variability among the monitoring stations. PCA was conducted using the standardized concentrations of Cd, Zn, Cu, Hg, Fe, Pb, and CN⁻ measured at the eight monitoring stations. Because the variables were expressed in different concentration ranges, z-score standardization was applied before analysis to ensure equal weighting of each parameter.
The PCA extracted three principal components with eigenvalues greater than 1.0 according to the Kaiser criterion. Together, these components explained most of the variability contained in the heavy metal dataset. The eigenvalues, percentage of explained variance, and cumulative variance are summarized in Table 6.
Table 6. Principal component summary
|
Principal Component |
Eigenvalue |
Explained Variance (%) |
Cumulative Variance (%) |
|
PC1 |
3.12 |
44.6 |
44.6 |
|
PC2 |
1.61 |
23.0 |
67.6 |
|
PC3 |
1.08 |
15.4 |
83.0 |
Table 7. Principal component loading matrix
|
Variable |
PC1 |
PC2 |
PC3 |
|
Fe |
0.81 |
0.21 |
0.18 |
|
Zn |
0.76 |
0.30 |
0.12 |
|
Pb |
0.63 |
0.24 |
0.39 |
|
CN⁻ |
0.59 |
0.34 |
0.42 |
|
Cd |
0.41 |
0.68 |
0.17 |
|
Hg |
-0.37 |
0.71 |
0.28 |
|
Cu |
-0.62 |
0.18 |
0.56 |
Table 7 indicates that the first principal component (PC1) accounted for approximately 44.6% of the total variance, making it the dominant dimension explaining differences among the monitoring stations. The second principal component (PC2) explained an additional 23.0%, while the third principal component (PC3) contributed 15.4%. Collectively, the first three principal components explained approximately 83% of the total dataset variability, indicating that they adequately represented the multivariate structure of the heavy metal concentrations measured during the survey.
To identify the contribution of each heavy metal to the extracted principal components, the loading matrix is presented in Table 7.
The loading matrix demonstrates that Fe and Zn exhibited the highest positive loadings on PC1, followed by Pb and CN⁻. These variables therefore contributed most strongly to the first principal component and largely explained the spatial variability observed among the monitoring stations. In contrast, Cu showed a relatively strong negative loading on PC1, suggesting an inverse spatial relationship with Fe and Zn within the available dataset.
The second principal component (PC2) was primarily influenced by Hg and Cd, indicating that these variables represented an additional source of variability independent of the first principal component. Meanwhile, PC3 showed moderate contributions from Cu, CN⁻, and Pb, although the proportion of explained variance associated with this component was considerably smaller than that of PC1.
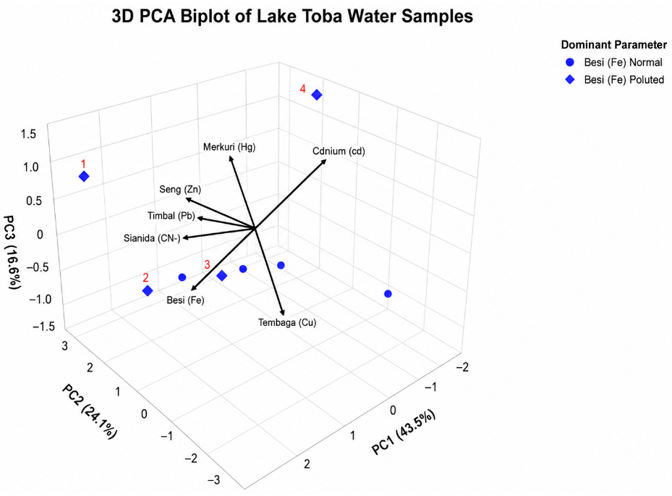
The spatial distribution of monitoring stations and the contribution of the heavy metals to each principal component are illustrated in Figure 4.
Figure 4. Principal Component Analysis (PCA) biplot showing the distribution of monitoring stations and the loading vectors of the measured heavy metals
The PCA biplot indicates that stations with relatively similar heavy metal compositions tended to cluster together, whereas stations exhibiting comparatively higher Fe concentrations were positioned farther from the main cluster. In particular, Stations S2, S3, and S5, which exceeded the Indonesian regulatory threshold for Fe, were separated from the remaining monitoring stations along the positive direction of PC1. This pattern is consistent with the descriptive statistical analysis presented in Section 3.1 and indicates that Fe contributed substantially to the spatial differentiation observed among the investigated locations.
Nevertheless, the separation among stations should be interpreted cautiously because the analysis was based on only eight monitoring stations sampled during a single field campaign. Consequently, the PCA should be regarded as an exploratory multivariate technique for identifying dominant patterns within the available dataset rather than as definitive evidence of distinct pollution sources.
The PCA results complement the correlation analysis presented in the previous section. Variables showing moderate positive correlations, particularly Fe, Zn, Pb, and CN⁻, also exhibited relatively high positive loadings on PC1, indicating that these parameters tended to vary together across the monitoring stations. However, PCA identifies patterns of covariance among variables and does not establish causal relationships. Therefore, the observed component structure should be interpreted as preliminary evidence of spatial variation in heavy metal concentrations that warrants confirmation through broader spatial coverage and repeated seasonal monitoring.
Given the limited number of monitoring stations included in this study, PCA provides a more appropriate exploratory framework for identifying dominant patterns of spatial variability than supervised predictive modelling. Consequently, the conclusions presented in this study rely primarily on the descriptive statistical and multivariate analyses.
3.4 Spatial distribution of heavy metal contamination and environmental implications
Based on the descriptive statistics, Pearson correlation analysis, and PCA, the spatial distribution of heavy metal contamination was further interpreted using the applicable Indonesian water quality standards.
Table 8. Spatial distribution of heavy metal concentrations relative to the Indonesian water quality standard
|
Station |
Dominant Land Use |
Fe (mg/L) |
Regulatory Standard (mg/L) |
Compliance Status |
|
S1 |
Tourism |
0.27 |
0.30 |
Complied |
|
S2 |
Harbor |
0.32 |
0.30 |
Exceeded |
|
S3 |
Floating net cage aquaculture |
0.36 |
0.30 |
Exceeded |
|
S4 |
Agricultural runoff |
0.29 |
0.30 |
Complied |
|
S5 |
Residential settlement |
0.31 |
0.30 |
Exceeded |
|
S6 |
River inflow |
0.25 |
0.30 |
Complied |
|
S7 |
Transitional water |
0.22 |
0.30 |
Complied |
|
S8 |
Reference site |
0.26 |
0.30 |
Complied |
To facilitate the interpretation of spatial variation in heavy metal contamination, the compliance status of each monitoring station was evaluated based on the applicable Indonesian water quality standard. The comparison between observed concentrations and regulatory thresholds is summarized in Table 8.
Table 8 shows that three monitoring stations (S2, S3, and S5) exceeded the applicable Fe threshold of 0.30 mg/L, whereas the remaining stations complied with the Indonesian water quality standard. These stations are located in areas characterized by relatively intensive anthropogenic activities, including harbor operations, floating net cage aquaculture, and residential settlements. Although this spatial pattern suggests localized environmental pressure, the present data do not permit identification of the specific sources responsible for the elevated Fe concentrations.
The spatial variation observed among the monitoring stations is consistent with the descriptive statistical analysis and the PCA results, which identified Fe as the dominant variable contributing to the first principal component. Monitoring stations exhibiting higher Fe concentrations were also separated from the remaining stations in the PCA biplot, indicating that Fe was the primary factor explaining spatial variability within the investigated area. Nevertheless, these observations should be interpreted as exploratory because the survey was conducted during a single sampling campaign and covered only eight monitoring stations.
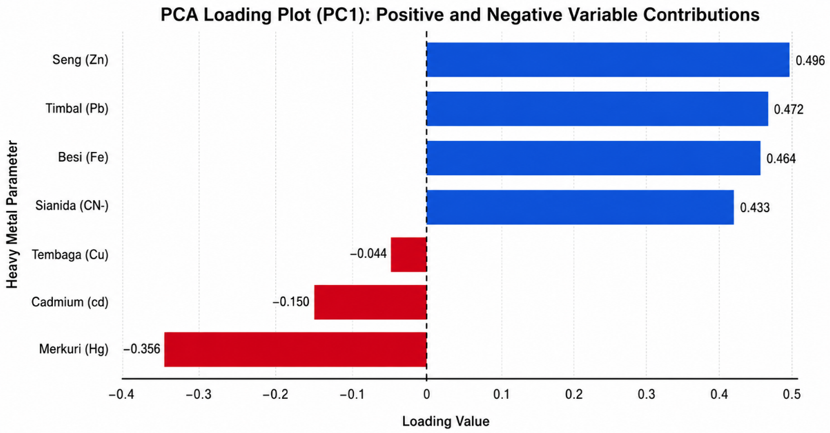
Figure 5 illustrates the contribution of heavy metal variables to PC1 together with their compliance status relative to the Indonesian water quality standard. The figure illustrates that stations exceeding the Fe threshold were concentrated in areas influenced by more intensive human activities, whereas stations located in relatively less disturbed environments remained below the regulatory limit.
The observed spatial pattern may reflect differences in local environmental conditions surrounding each monitoring station. However, the present study did not quantify pollutant loading, hydrodynamic processes, watershed characteristics, or sediment accumulation. Consequently, the elevated Fe concentrations cannot be attributed exclusively to specific anthropogenic activities or natural geological processes. Additional investigations incorporating sediment chemistry, watershed characteristics, seasonal monitoring, and hydrodynamic modeling would be necessary to identify the dominant mechanisms controlling heavy metal distribution in Lake Toba.
Unlike previous studies that inferred potential ecological and public health impacts directly from heavy metal concentrations, the present investigation was limited to measurements of dissolved heavy metals in surface water. No analyses of sediments, aquatic organisms, bioaccumulation, or human exposure pathways were conducted. Therefore, the findings should not be interpreted as direct evidence of ecological degradation or human health risk. Instead, the elevated Fe concentrations observed at several monitoring stations should be regarded as an indication of localized water quality conditions that warrant continued environmental monitoring and further investigation.
Overall, the combined results of descriptive statistics, correlation analysis, PCA, and exploratory machine learning consistently identified Fe as the parameter contributing most strongly to spatial variation among the investigated monitoring stations. Nevertheless, because the dataset was limited to eight stations surveyed during a single sampling campaign, the present findings represent a preliminary assessment of heavy metal contamination in the Pangururan area of Lake Toba. Broader spatial coverage, repeated seasonal sampling, and complementary analyses of sediments and aquatic biota are recommended before concluding long-term environmental conditions or ecological impacts.
This study provides a preliminary assessment of heavy metal contamination in the Pangururan area of Lake Toba based on measurements collected from eight monitoring stations during a single sampling campaign conducted in February 2026. Among the analyzed heavy metals, Fe was identified as the principal parameter contributing to spatial variation in water quality, with concentrations ranging from 0.22 to 0.36 mg/L. Three monitoring stations (S2, S3, and S5) exceeded the Indonesian water quality standard established under Government Regulation No. 22 of 2021, whereas the concentrations of Cd, Zn, Cu, Hg, Pb, and CN⁻ remained below the corresponding regulatory thresholds.
The combined application of descriptive statistics, Pearson correlation analysis, and PCA consistently identified Fe as the dominant variable explaining spatial variability among the monitoring stations. These complementary statistical approaches indicate that elevated Fe concentrations were primarily associated with areas characterized by relatively intensive anthropogenic activities, including harbour operations, floating net cage aquaculture, and residential settlements. However, because the present investigation was limited to eight monitoring stations sampled during a single field campaign, the observed spatial patterns should be interpreted as preliminary rather than representative of long-term environmental conditions throughout Lake Toba.
Although supervised machine learning algorithms were initially explored during the analytical workflow, the available dataset (n = 8 monitoring stations; L1 = 5 and L2 = 3) was insufficient for statistically reliable model evaluation. Consequently, the scientific conclusions presented in this study are based exclusively on descriptive statistics, Pearson correlation analysis, and PCA. Future investigations should incorporate a larger number of monitoring stations, repeated seasonal sampling, sediment and aquatic biota analyses, and broader spatial coverage to validate the observed patterns and provide a more comprehensive basis for sustainable water quality management in Lake Toba.
The authors would like to express their sincere gratitude to Universitas Katolik Santo Thomas for providing institutional support throughout the completion of this research. The authors also gratefully acknowledge the Environmental Agency of Samosir Regency (Dinas Lingkungan Hidup Kabupaten Samosir) for its assistance during field sampling activities and for facilitating access to the study area. Their valuable support and cooperation greatly contributed to the successful implementation of this study.
[1] Naibaho, B.B., Su, S.J. (2025). Shifting waters: The dynamics of water grabbing in Lake Toba through aquaculture and tourism development. Journal of Political Ecology, 32(1): 5698. https://doi.org/10.2458/jpe.5698
[2] Lukman, Syawal, M.S., Maghfiroh, M. (2020). Sumatran major lakes: Limnological overviews. IOP Conference Series: Earth and Environmental Science, 535: 012064. https://doi.org/10.1088/1755-1315/535/1/012064
[3] Hutagaol, M.P., Tanjung, D., Nirmala, K., Hastuti, Y.P., Wulandari, Y.P. (2024). Assessing the impacts of fish in-cage farming and tourism on Lake Toba's water quality. International Journal of Sustainable Development & Planning, 19(4): 1299-1306. https://doi.org/10.18280/ijsdp.190408
[4] Irwandi, H., Rosid, M.S., Mart, T. (2021). The effects of ENSO, climate change and human activities on the water level of Lake Toba, Indonesia: A critical literature review. Geoscience Letters, 8: 21. https://doi.org/10.1186/s40562-021-00191-x
[5] Lukman, L., Hidayat, Subehi, L., et al. (2019). Pollution loads and its impact on Lake Toba. IOP Conference Series: Earth and Environmental Science, 299(1): 012051. https://doi.org/10.1088/1755-1315/299/1/012051
[6] Riyanto, I.A., Hendrayana, H., Widyaningsih, Y., Jayanto, G.D., Nuha, A., Sumartono, S. (2025). The decline in water level and discharge of Lake Toba of North Sumatera, Indonesia, affected by land degradation. Journal of Degraded and Mining Lands Management, 12(2): 7123-7140. https://doi.org/10.15243/jdmlm.2025.122.7123
[7] Sharma, M., Kant, R., Sharma, A.K. (2025). Exploring the impact of heavy metals toxicity in the aquatic ecosystem. International Journal of Energy and Water Resources, 9: 267-280. https://doi.org/10.1007/s42108-024-00284-1
[8] Balali-Mood, M., Naseri, K., Tahergorabi, Z., Khazdair, M.R., Sadeghi, M. (2021). Toxic mechanisms of five heavy metals: Mercury, lead, chromium, cadmium, and arsenic. Frontiers in Pharmacology, 12: 643972. https://doi.org/10.3389/fphar.2021.643972
[9] Sharma, A., Grewal, A.S., Sharma, D., Srivastav, A.L. (2023). Heavy metal contamination in water: Consequences on human health and environment. In Metals in Water, pp. 39-52. https://doi.org/10.1016/B978-0-323-95919-3.00015-X
[10] El-Sharkawy, M., Alotaibi, M.O., Li, J., Du, D.L., Mahmoud, E. (2025). Heavy metal pollution in coastal environments: Ecological implications and management strategies: A review. Sustainability, 17(2): 701. https://doi.org/10.3390/su17020701
[11] Fukushima, T., Setiawan, F., Subehi, L., Jiang, D., Matsushita, B. (2023). Water temperature and some water quality in Lake Toba, a tropical volcanic lake. Limnology, 24: 61-69. https://doi.org/10.1007/s10201-022-00703-4
[12] Wang, R., Xia, W.T., Eggleton, M.A., et al. (2022). Spatial and temporal patterns of heavy metals and potential human impacts in Central Yangtze Lakes, China. Science of the Total Environment, 820: 153368. https://doi.org/10.1016/j.scitotenv.2022.153368
[13] Singh, A., Singh, D., Yadav, H. (2017). Impact and assessment of heavy metal toxicity on water quality, edible fishes and sediments in lakes: A review. Trends in Biosciences, 10(8): 1551-1560.
[14] Fatima, S.U., Khan, M.A., Siddiqui, F., et al. (2022). Geospatial assessment of water quality using principal components analysis (PCA) and water quality index (WQI) in Basho Valley, Gilgit Baltistan (Northern Areas of Pakistan). Environmental Monitoring and Assessment, 194: 151. https://doi.org/10.1007/s10661-022-09845-5
[15] Wilson, A., Anwar, M.R. (2024). The future of adaptive machine learning algorithms in high-dimensional data processing. International Transactions on Artificial Intelligence, 3(1): 97-107. https://doi.org/10.33050/italic.v3i1.656
[16] Wang, X.H., Li, Y., Qiao, Q., Tavares, A., Liang, Y.C. (2023). Water quality prediction based on machine learning and comprehensive weighting methods. Entropy, 25(8): 1186. https://doi.org/10.3390/e25081
[17] Muhtadi, A., Leidonald, R., Rahmadya, A., et al. (2026). Water quality conditions and trophic status of Lake Toba, North Sumatra, Indonesia: Implications for lake management. Jurnal Pengelolaan Sumberdaya Alam dan Lingkungan, 16(3): 313-332. https://doi.org/10.29244/jpsl.16.3.313
[18] Eze, N.M., Asogwa, O.C., Eze, C.M. (2021). Principal component factor analysis of some development factors in Southern Nigeria and its extension to regression analysis. Journal of Advances in Mathematics and Computer Science, 36(3): 132-160. https://doi.org/10.9734/JAMCS/2021/v36i330351
[19] Blaise, B.J., Correia, G.D.S., Haggart, G.A., et al. (2021). Statistical analysis in metabolic phenotyping. Nature Protocols, 16: 4299-4326. https://doi.org/10.1038/s41596-021-00579-1