Tili Karenina* | Zepri Ariadi | Sri Maryani | Achmad Ubaidillah | Wenni Tania Defriyanti | Desri Yesi | Oom Komalasari | Hendrixon | Popo Marinda | Dian Novriadhy | Karmelina
© 2026 The authors. This article is published by IIETA and is licensed under the CC BY 4.0 license (http://creativecommons.org/licenses/by/4.0/).
OPEN ACCESS
The performance of a phytochemical mixture (PM) as a biostimulant in agriculture can be inconsistent due to complex interactions with different growing media. This study evaluated the effects of a PM derived from ten plant species on the growth, yield, post-harvest quality, and disease incidence (DI) of shallots (Allium cepa var. aggregatum) across three organic growing media: cocopeat (CP), rice husk (RC), and sawdust (SW). A preliminary bioassay using Vigna radiata showed a slight positive tendency of the mixture. Field experiments compared three treatments: synthetic inputs (SI), PM, and phytochemical mixture-synthetic input (PMSI), arranged in a completely randomized design. There were 20 replicates for growth/yield measurements and 30 replicates for DI. The results indicated significant media-dependent effects (p < 0.05 for treatment × media interactions). In CP, the PMSI treatment increased the number of tillers by 78% and the number of bulbs per clump by 40%, reduced weight loss during curing by 55%, and resulted in a low DI of 3.33%. In RC, the PM treatment exhibited negative growth response effects in all variables studied except the harvest index, which remained unchanged, with a DI reaching 20% even under PMSI conditions. SW provided a high-risk, high-reward scenario: PMSI yielded the highest production (43.72 g of fresh weight), increased dry bulb by 36% and harvest index by 7%, but also had the highest DI at 26.67%. The PM alone did not suppress disease in any of the media used. Two-way Analysis of Variance (ANOVA) confirmed significant interaction effects for most parameters (Partial η² = 0.067–0.299). These findings demonstrate that the same PM can act as either a positive growth response or exhibit negative growth response properties, depending on the growing medium. This has important implications for sustainable shallot cultivation and the development of media-specific biostimulant formulations.
disease incidence, growing media-dependent response, phytochemical mixture, shallot, synthetic input
Shallots (Allium cepa var. aggregatum) are a strategic horticultural commodity in Indonesia, playing a vital role in meeting household needs and ensuring economic stability [1, 2]. Their status as a key commodity drives consistent demand that grows alongside the population, necessitating efforts to expand production [3, 4]. Efforts to expand production through the application of innovation in shallot cultivation with the aim of increasing production and farmer welfare as well as food security continue to be implemented [5]. Production expansion achieved through agricultural intensification practices often leads to an over-reliance on synthetic chemicals. Meanwhile, the continuous and inefficient use of synthetic chemicals raises concerns regarding environmental and soil health [6]. The challenge of balancing the need for increased production with the imperative to safeguard environmental and soil health has prompted the exploration of sustainable agricultural alternatives capable of boosting crop productivity and restoring soil fertility while maintaining environmental well-being. In response to these challenges, one potential solution involves the use of locally produced organic inputs based on phytochemical mixtures (PM). Certain PM derived from various plant parts are known to contain secondary metabolites such as phenolics, flavonoids, and antioxidants that can stimulate plant growth and enhance nutrient uptake [7, 8]. They also promote beneficial microbial interactions, thereby improving plant resilience, productivity, and environmental sustainability [9, 10]. However, field applications often yield inconsistent results due to the complex, species-dependent nature of their bioactive properties [11]. While specific plant species demonstrate beneficial effects on seed germination and stimulate various developmental stages [12], others inhibit growth through allelopathic mechanisms [13]. Furthermore, the effects of PM compared to single-species extracts remain poorly understood; given the complexity of their bioactive properties, combining multiple species can result in varied interactions, whether additive, synergistic, or antagonistic.
The effectiveness of biostimulants and the phytotoxicity of allelochemicals are determined not only by their intrinsic chemical properties but also by the growing medium, which influences these effects. The use of various organic soil amendments such as cocopeat (CP), rice husks (RC), and sawdust (SW), which differ markedly in water holding capacity (WHC), intrinsic nutrient content, silicon concentration, and susceptibility to microbial decomposition, affects the performance of applied PM and the release of endogenous elements during organic matter decomposition. Research on total secondary metabolites in different growing media indicates that plants grown in CP media produce lower levels of total phenolics and flavonoids than those in clay loam soil [14], while plants grown in SW media exhibit higher tannin and phenol levels compared to those in RC compost media [15]. Furthermore, interactions involving PM, growing media, and synthetic inputs (SI) can yield unexpected effects. Various studies on plant disease control have examined the compatibility of organic fertilizers and biological control agents with synthetic fungicides, reporting varying degrees of success in disease suppression [16]. The presence of specific elements in the growing medium such as high concentrations of iron (Fe) and manganese (Mn) is positively correlated with the risk of Fusarium infection [17, 18]; conversely, protective elements like calcium (Ca), zinc (Zn), and silicon (Si) can enhance plant resistance [19-21], potentially mitigating the impact of such disease outbreaks. The interplay among these factors creates a complex mechanism; for instance, the effect of a PM may shift from biostimulant activity to allelopathy, demonstrating the material's dual nature as influenced by the growing medium.
Based on this background, the study was designed within the framework of optimizing sustainable shallot production by exploring the use of locally produced PM. The underlying hypothesis is that the performance of these mixtures is not universal but depends on the type of organic growing medium employed. While previous research indicates that similar mixtures have yielded varying effects on shallot growth, the specific influence of growing media (CP, RC, and SW) on the mixture's biostimulant potential, its interaction with SI, and its impact on disease severity remains poorly understood. Therefore, this study aims to evaluate the effects of PM derived from ten plant species on the growth, yield, post-harvest quality, and DI in shallots across three organic growing media: CP, RC, and SW. Three treatment combinations were compared: SI (fertilizers and fungicides), PM, and phytochemical mixture-synthetic input (PMSI). By systematically examining these interactions, the study seeks to determine whether PM from various plant species can function as effective biostimulants or if their efficacy is hindered by allelopathic or pro-pathogenic mechanisms specific to certain media types. The findings offer practical recommendations for farmers and formulate hypotheses for future research regarding the interactions between phytochemicals, growing media, and pathogens.
2.1 Study site and experimental design
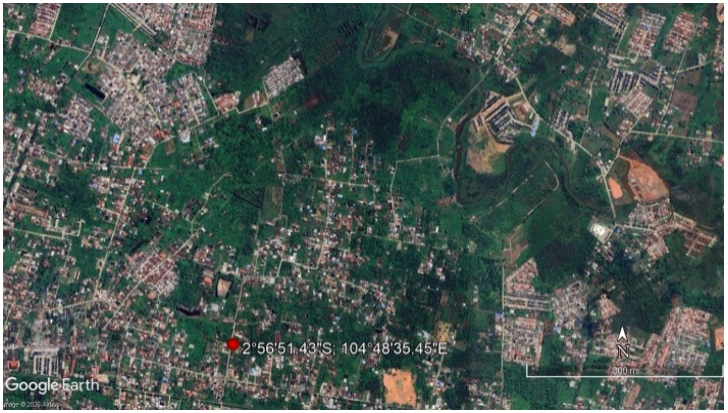
Investigation of the benefits of phytochemicals in urban shallot cultivation was carried out from June to August 2023 in two stages, namely 1) a preliminary bioassay was held at the Regional Research and Innovation Agency of South Sumatra Province, and 2) application testing on field demonstration plots conducted in Kelurahan Srimulya (Figure 1), Palembang City, South Sumatra, Indonesia. Kelurahan Srimulya is a suburban settlement affected by the tides of the Borang River, a tributary of the Musi River. Climatological conditions during the field experiment were: a) rainfall 30 - 120 mm/month; b) relative humidity 80%; c) average daily sunshine duration 8.3 hours; and d) average air temperature 32.2 ℃ [22].
Figure 1. The field experiment location
Table 1. Summary of experimental design
|
Preliminary Bioassay (Phytochemical Testing): For Initial Screening of Phytochemical Functions as Biostimulants/Allelopathy |
||||
|
Treatment |
Replication |
Number of samples for analysis |
||
|
12* |
9 |
108 |
||
|
Field Experiment (Demonstration Plot): To Assess the Effectiveness of Phytochemicals in Agricultural Applications in Various Growing Media |
||||
|
Treatment |
Replication |
Number of samples for analysis |
||
|
Disease incidence analysis |
Growth and yield analysis** |
|||
|
SI |
Cocopeat |
30 |
30 |
20 |
|
Rice Husk |
30 |
30 |
20 |
|
|
Sawdust |
30 |
30 |
20 |
|
|
PM |
Cocopeat |
30 |
30 |
20 |
|
Rice Husk |
30 |
30 |
20 |
|
|
Sawdust |
30 |
30 |
20 |
|
|
PMSI |
Cocopeat |
30 |
30 |
20 |
|
Rice Husk |
30 |
30 |
20 |
|
|
Sawdust |
30 |
30 |
20 |
|
Figure 2. Block samples arrangement and polybag layout
The research design and sample sizes at each stage are summarized in Table 1. This study used 30 polybags for each treatment to observe plant growth and yield, as well as disease attacks. For growth and yield analysis, 20 samples were randomly selected from the harvested polybags. For disease attack analysis, the entire population (30 polybags for each treatment) was used. Block sample arrangement and polybag layout are presented in Figure 2.
2.2 Preliminary bioassay: Plant collection, extract preparation, and phytochemical testing method
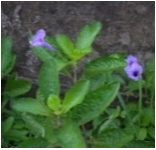
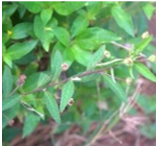
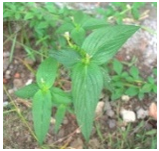
At the research site (Kelurahan Srimulya), leaves from ten different shrubs (Table 2) were collected at 7:00 a.m. Western Indonesian Time (WIB), 2nd June 2023, with each sample weighing 100 grams. The leaves were rinsed with clean water to remove any dust and dirt. Phytochemical extracts were prepared as follows:
•Single Phytochemical Extract: To prepare a single extract, 50 grams of crushed leaves from one species were dissolved in 500 mL of distilled water (10% w/v). The mixture was then macerated for 72 hours.
•Mixed Phytochemical Extract: For the mixed extract, 500 grams of a blend of leaves (50 grams from each of the ten species) were dissolved in 5,000 mL of distilled water (10% w/v). This mixture was also macerated for 72 hours.
Phytochemical potential testing was conducted following these steps:
Step 1. Each of the ten pure extracts, along with one mixed extract, was obtained by filtering each maceration solution through a filter cloth (200 mesh).
Step 2. The filtered extracts were poured separately into cups (7 cm in diameter and 10 cm in height) filled with rockwool until it becomes saturated.
Step 3. Nine mung bean (Vigna radiata) seeds, specifically marked for measurement, were soaked in the extract for 10 minutes and then planted in each cup.
Step 4. The cups were placed in a dark room, and the growth of the seedlings was measured at 24 hours and 72 hours post-planting.
Step 5. Distilled water was used as a control to compare the performance of the extracts, ensuring that an equivalent number of seeds, sowing methods, and incubation conditions were maintained.
Table 2. List of plant species used as a source of phytochemical extract
|
No. |
Plant Species |
Plant Image |
Description# |
Phytochemical Substances Based on Literature |
|
1 |
Ageratum conyzoides L. |
Herbs, annual, 50–100 cm tall, sometimes less than 10 cm. Stems robust, ca. 4 cm in diam. Leaves often with axillary abortive buds; median leaves ovate, elliptic, or oblong, 3–8 × 2–5 cm; upper leaves gradually smaller, oblong, sometimes all leaves small, ca. 1 × 0.6 cm. |
Prescocene I (7-methoxy-2,2-dimethylchromene), Precocene II (6,7-dimethoxy derivative, ageratochromene) [25] |
|
|
2 |
Alternanthera sessilis (L.) DC. |
Herb perennial, 10–45 cm tall. Stem ascending or creeping. Leaf blade linear-lanceolate, oblong-obovate, or ovate-oblong, 1–8 × 0.2–2 cm, glabrous or pilose, base attenuate, margin entire or slightly serrate, apex acute or obtuse. |
2″-O-rhamnosylvitexin, Apigenin-6,8-di-C-β-D-glucopyranoside isomer, Kaempferol monosulfate, Kaempferol monosulfate, p-Hydroxybenzoic acid, p-Hydroxycinnamoyl moiety, Protocatechuic acid, Gibberellin, Daidzein, Benzophenone-4 [26] |
|
|
3 |
Asystasia gangetica (L.) T.Anderson |
Herbs to 0.5 m tall, ascending. Stems 4-angled, pilose. Petiole 3-5 mm, pubescent; leaf blade ovate to elliptic, 3–12 × 1–5 cm, glabrous or sparsely pilose, especially on veins, adaxially with numerous cystoliths, base truncate to rounded, margin entire or slightly crenulate, apex acuminate. |
Z-(13,14-Epoxy) tetradec-11-en-1-olacetate, Octadecane, 1-(ethenyloxy), Cycloheptano[d]imidazolidine, cis-Vaccenic acid, 15-Hydroxypentadecanoic acid, proanthocyanidin, flavone, spartein, aphylidine and cyanogenic glycoside [27] |
|
|
4 |
Cleome rutidosperma DC. |
Herbs, annual or rarely perennial, 30-100 cm tall. Stems branched, often with decumbent branches, glabrous or glabrescent to slightly scabrous but sometimes glandular pubescent. Leaflets 3; leaflet blades oblanceolate to rhomboid-elliptic, 1–3.5 × 0.5–1.7 cm. |
Eugenol, n-Tetradecanol, 1-Heptadecene, n-Hexadecanol, (3Z)-Cembrene, Isopropyl hexadec-anoate, Phyllocladene, n-Octadecanol, (Z)-Phytol, Acetoxy manool, (Z,Z)-6,9-cis-3,4-Epoxynonadecadien [28] |
|
|
5 |
Euphorbia hirta L. |
Herbs, annual, 30–60(–70) cm tall, usually few-branched. Stem branched from middle or above, ascending to erect, rarely prostrate, ca. 3 mm thick. Leaves opposite; stipules membranous, triangular, 0.8-1.7 mm, caducous; leaf blade lanceolate-oblong, long elliptic, or ovate-lanceolate, 10–50 × 3–16 mm, |
Afzelin, quercitrin, myricitrin, rutin, euphorbin-A, euphorbin-B, euphorbin-C, euphorbin-D [29] |
|
|
6 |
Mikania micrantha Kunth |
Vines, slender, branched. Stems yellowish or brownish, usually terete. Leaves opposite; petiole 1-6 cm; blade ovate, 3-13 × ca. 10 cm, both surfaces glabrate with numerous glandular spots, base cordate to deeply so, margin entire to coarsely dentate, apex shortly acuminate. |
Hydroxycinnamic derivatives and octulopyranosonic acid derivatives, Quercetin O-heterosides, 5-O-caffeoylquinic acid and dicaffeoylquinic acids [30] |
|
|
7 |
Phyllanthus amarus Schumach. & Thonn. |
Herbs, annual, monoecious. Main stems terete, not winged, glabrous. Leaves on main stems spiral, scalelike. Leaves on ultimate branchlets distichous, well developed; blade elliptic-oblong to obovate, 5–11 × 3–6 mm, base obtuse or rounded, apex obtuse to rounded, often apiculate, both surfaces glabrous. |
Corilagin, geraniin, gallic acid, phyllanthin, hypophyllanthin, ellagic acid, phyltetralin, niranthin, catechin, quercetin, astragalin, and chebulagic acid [31] |
|
|
8 |
Ruellia tuberosa L. |
Herbs to 45 cm tall, perennial, erect. Roots with elongate tuberlike swellings. Stems slightly swollen above nodes, almost 4-angled, strigulose on angles. Petiole to 8 mm, glabrous; leaf blade oblong-obovate, 4-8 × 1.5–4.2 cm, both surfaces glabrous. |
Isobergapten-5-O-β-D-glucopyranoside syringaresinol, catechin, pulmatin, stigmast-4-en-3-one, verbascoside, hydroxymethylfurfural, rutin and homoplantaginin [32] |
|
|
9 |
Sida rhombifolia L. |
Subshrubs erect or prostrate, many branched, to ca. 1 m tall. Branchlets stellate. Stipules spinelike, 3-5 mm; petiole 2–5(–8) mm, stellate puberulent; leaf blade rhombic to oblong-lanceolate or obovate, rarely linear-lanceolate, 1–4.5 × 0.6-2 cm. |
Scopoletin, scoporone, ethoxy-ferulate, kaempferol, kaempferol-3-O-β-D-glycosyl-6-α-D-rhamnoside, quindolinone, 11-methoxy-quindoline, quindoline [33] |
|
|
10 |
Spigelia anthelmia L. |
Herb, annual, 15 cm–1.3 m high, the roots usually shallow and fibrous; stems ascending, leaves sessile or with petioles to 10(–20) mm long, the leaves of the terminal whorl often sessile or subsessile; blades 2–18 cm long, 0.8-6.5 cm broad, broadly ovate or rhombic-ovate to lance-oblong or lance-elliptic or lanceolate. |
Spiganthine, 20-Deoxyspiganthine, 8a-Hydroxyspiganthine, 20-Norspiganthine-5-carboxylic acid, 20-Hydroxyryanodine, 9-Hydroxy-10-epi-ryanodine, 8,9-Dehydro-10-epi-ryanodine, 8a,9a-Epoxy-10-epi-ryanodine [34] |
2.3 Field experiment
2.3.1 Growing media preparation and substrate characteristics
The field experiment used three types of growing media prepared by mixing ultisol soil and chicken manure (CM) with three different organic amendments: CP, RC, or SW. The final composition of each GM was as follows:
•Cocopeat-based (CPB): ultisol soil + CM + CP (2:1:1, v/v)
•Rice husk-based (RCB): ultisol soil + CM + RC (2:1:1, v/v)
•Sawdust-based (SWB): ultisol soil + CM + SW (2:1:1, v/v)
Ultisol soil was collected from the field site at a depth of 0-20 cm. CM was obtained from nearby farms that use concentrated feed. CP and RC were sourced from an agricultural store, while SW was acquired from a local lumberyard. All materials were air-dried and sieved before use. The growing media consisted of a mixture of organic amendments (CP, RC, and SW) and CM. These materials were obtained from different commercial suppliers prior to the experiment. Due to the agricultural origin of these components, their physical and chemical properties are subject to inherent variability, as the nutrient composition of CM, for instance, is influenced by feed type and season, while the quality of plant-based materials may vary depending on harvest period and processing methods. To ensure internal consistency within this study, all materials were produced within the same time frame and thoroughly homogenized before mixing to minimize within-batch variability. Consequently, the findings of this study are strictly representative of the specific batches tested, and conclusions should be interpreted within the context of these particular substrate characteristics, rather than being generalized to all available commercial products. The characteristics of these materials at the time of the research are presented in Table 3.
Table 3. Physical and chemical characteristics of the components used in growing media preparation
|
Parameter |
CP |
RC |
SW |
CM |
Ultisol |
|
C (%) |
29.0 |
41.6 |
54.8 |
31.35 |
4.84 |
|
N (%) |
0.26 |
1.05 |
1.08 |
4.38 |
0.21 |
|
P (%) |
0.01 |
0.14 |
0.105 |
0.6 |
0.03 |
|
K (%) |
0.76 |
0.091 |
0.19 |
0.9 |
0.02 |
|
S (%) |
0.10 |
0.17 |
0.23 |
- |
- |
|
SiO2 (%) |
2.5 |
20.4 |
0.14 |
- |
- |
|
Ca (%) |
0.25 |
1.86 |
<0.01 |
- |
0.11 |
|
Mg (%) |
0.24 |
0.42 |
<0.01 |
- |
< 0.01 |
|
Mn (ppm) |
56.5 |
340 |
0.6 |
- |
- |
|
Fe (ppm) |
0.9 |
268 |
1.7 |
- |
- |
|
Cu (%) |
<0.01 |
0.5 |
1.6 |
- |
- |
|
Zn (ppm) |
22.5 |
60.0 |
9.8 |
- |
- |
|
Na (ppm) |
5.0 |
0.52 |
6.0 |
- |
< 0.01 |
|
Porosity (%) |
83 |
43 |
45 |
- |
46 |
|
Water Holding (%) |
653 |
217 |
295 |
- |
- |
|
pH |
5.6 |
7.3 |
4.7 |
6.8 |
5.3 |
The physicochemical properties of the final mixed substrates, including porosity, WHC, and electrical conductivity (EC), were not directly measured in this study. EC was not measured at all due to equipment limitations. Consequently, the media-dependent responses reported herein reflect the compositional characteristics of the raw materials rather than the actual physicochemical conditions of the final mixtures.
2.3.2 Shallot cultivation method
The field experiment used Bima Brebes shallots obtained from the Hadi Sutomo nursery in Brebes, Central Java Province. The seeds used were visually healthy bulbs measuring 1.97–2.2 cm in diameter and weighing 5.8–6.3 g, with a dormant period of at least 60 days before planting. One bulb was planted per polybag (40 cm in diameter × 45 cm in height) at a depth of 3 cm. The cultivation method is described as follows:
•Synthetic chemical inputs:
○Fertilization was applied three times for each polybag. The first was given seven days after planting (DAP), consisting of 1.2 g of urea and 1.2 g of ammonium sulfate. The second fertilization, 2.4 g of nitrogen (N): phosphorus (P): potassium (K) (16:16:16), was applied 21 DAP, and 1.5 g of Kalium Chloride (KCl) on 35 DAP.
○Fungal control using ziram with a concentration of 3 g/L per week, starting from the first week until one week before harvest.
•PM inputs:
○The PM (prepared as described in section 2.2) was diluted with water at a ratio of 10 mL/L and applied as a foliar spray at intervals of 7 DAP.
•Synthetic chemical + PM input:
○Each polybag is treated with the right amount of chemical and phytochemical inputs at the specified intervals as previously described.
•Irrigation, weeding, and other agronomic practices were performed as needed uniformly across all treatments.
2.3.3 Post-harvest handling
The bulbs and leaves were cleaned of dirt and root residue. Each bulb and leaf per clump from each treatment was placed in separate containers. Sun drying was done by placing the containers on a drying rack inside a screenhouse for 7 consecutive days. During the drying period, the average daily sunlight exposure was 5.6 hours, with an average maximum temperature of 34.0 ℃ and a minimum temperature of 25.3 ℃. Air relative humidity was around 80% [22]. Physical observations were made to check for damage to the bulbs and leaves.
2.4 Variables and statistical analysis
Table 4 describes each variable used in the preliminary bioassay and the experiment. Table 5 further outlines the number of discarded replicates from the growth and yield study. These plants were discarded after visual confirmation showed they exhibited critical symptoms (like severe leaf chlorosis, curling, wilting, or root rot) for over a week, leading to their death before the crop could be harvested. All statistical analyses were performed using SPSS software v.22. The preliminary bioassay data were analyzed using the Kruskal-Wallis test. This choice was made because data from the early germination phase showed characteristics of the lag phase, where growth variability between individuals was very high, and the data distribution was not normal due to the presence of non-germinating seeds (value 0). The growth and yield data were analyzed using the Two-way Analysis of Variance (ANOVA) test with a 95% confidence level (α = 0.05). The number of samples selected for the Two-way ANOVA is described in Table 5. The linear model used for the two-way ANOVA in a factorial completely randomized design is as follows:
Yijk = μ + Mi + Pj + (MP)ij + εijk
where,
Yijk = observation value at the i-th level of media, j-th level of cultivation treatment, and k-th replication;
μ = general mean;
Mi= effect of the i-th level of planting media (i = 1, 2, 3);
Pj= effect of the j-th level of cultivation treatment (j = 1, 2, 3);
(MP)ij = interaction effect between planting media and cultivation treatment;
εijk = experimental error.
Table 4. Variable description and measurement method
|
Variable |
Description |
Measurement Method |
Frequency |
|
Germination (%) |
Number of seeds with radicle emergence ≥ 1 mm |
(number of germinated seeds / total seeds) × 100% |
24-hour and 72-hour after incubation |
|
Radicle length (cm) |
Length of the primary root |
Measured with a ruler |
24-hour and 72-hour after incubation |
|
Seedling vigor index |
Combined index of germination and growth |
(Germination percentage × total seedling length) / 100 |
72-hour after incubation |
|
Plant height (cm) |
Height from soil surface to the tip of the longest leaf |
Measured with a ruler |
Weekly starting at 2 WAP |
|
Number of tillers |
Count of tillers per plant |
Direct count |
Weekly starting at 2 WAP |
|
Number of leaves |
Count of fully expanded leaves per plant |
Direct count |
Weekly starting at 2 WAP |
|
Bulbs/Clump |
Total bulbs harvested per polybag |
Direct count |
one time (cleaned bulbs); after harvest |
|
Fresh Bulb Weight/ Clump (g) |
Weight of all bulbs from one polybag |
Digital balance (0.01 g precision) |
one time (cleaned bulbs); after harvest |
|
Dry bulb weight per clump (g) |
Weight after 7 days sun-drying |
Digital balance (0.01 g precision) |
one time; after sun-drying |
|
Bulb length (cm) |
Length from base to tip of bulb |
Vernier caliper |
one time (cleaned bulbs); after harvest |
|
Bulb diameter (cm) |
Maximum diameter at the equatorial region |
Vernier caliper |
one time (cleaned bulbs); after harvest |
|
Relative Growth Rate (RGR) |
The increase in plant height (28 DAP to 60 DAP) per unit of time |
$R G R=\frac{\ln \left(H_2\right)-\ln \left(H_1\right)}{t_2-t_1}$ |
one time; after harvest |
|
Harvest index (HI) |
The ratio of a plant's economic yield (dry bulb) to its total biological yield (dry bulb and dry biomass). |
Dry bulb/ (dry bulb + aboveground vegetative dry mass) |
one time; after harvest |
|
Productivity/vegetative biomass |
Ratio of the rate of biomass production to the actual mass of live or dead plant tissue accumulated at any given time |
Fresh Bulb Weight /Fresh weight biomass |
one time; after harvest |
|
Disease incidence (%) |
Percentage of plants showing disease symptoms (Symptoms of disease include under-growing seedlings and chlorosis of the shoots. Infection during the vegetative and generative phases, twisted leaves, wilting and lodging, root and basal rot). |
(infected plants / total plants) × 100% |
Weekly until harvest |
Table 5. Number and status of replicates on the day of harvest
|
Treatment |
Replication |
Number of Replicates Excluded from the Growth and Yield Analysis* [Polybag Number] |
Number of Replicates Available for the Growth and Yield Analysis** |
The Number of Replicates not Selected for Use in the Growth and Yield Analysis Following Random Selection [Polybag Number] |
|
|
SI |
Cocopeat |
30 |
1 [No: 24] |
29 |
9 [No: 1,2,6,8,9,14,20,22,30] |
|
Rice Husk |
30 |
3 [No: 1,10,24] |
27 |
7 [No: 4,8,13,18,22,26,27] |
|
|
Sawdust |
30 |
0 [No: -] |
30 |
10 [No: 1,2,4,14,15,16,21,24,28,30] |
|
|
PM |
Cocopeat |
30 |
6 [No: 2,8,18,23,24,30] |
24 |
4 [No: 4,6,26,28] |
|
Rice Husk |
30 |
6 [No: 6,14,20,21,22,25] |
24 |
4 [No: 2,3,10,16] |
|
|
Sawdust |
30 |
3 [No: 4,8,11] |
27 |
7 [No: 6,7,14,16,18,23,26] |
|
|
PMSI |
Cocopeat |
30 |
1 [No: 4] |
29 |
9 [No: 2,3,5,7,12,18,20,26,28] |
|
Rice Husk |
30 |
6 [No: 3,6,10,13,20,24] |
24 |
4 [No: 2,8,12,22] |
|
|
Sawdust |
30 |
8 [No: 1,3,4,12,15,23,24,30] |
22 |
2 [No: 16,18] |
|
3.1 Preliminary bioassay profile
The preliminary bioassay of single-species and mixed-species phytochemical extracts on radicle length and germination of V. radiata after 24-hour and 72-hour dark incubation revealed variable performance compared to the aqua distilata control (Table 6). In 24-hour incubation, M. micrantha exhibited the greatest radicle elongation, surpassing both the control and all other individual extracts. A. conyzoides and E. hirta demonstrated radicle growth roughly comparable to the control. In contrast, several species markedly suppressed radicle development, with A. sessilis showing the shortest radicle length, followed by S. rhombifolia and S. anthelmia. Regarding germination, four single-species extracts achieved complete germination, outperforming the control. Notably, C. rutidosperma, S. rhombifolia, R. tuberosa, and S. anthelmia recorded the lowest germination rates, while A. sessilis and P. amarus showed moderate germination similar to the control. The mixed-species extract produced radicle growth slightly above the control (ratio 1.02) but did not exceed M. micrantha. Its germination rate was comparable to the control but lower than extracts achieving full germination. Overall, certain single-species extracts, particularly M. micrantha, appeared more effective in promoting radicle elongation than the mixed-species combination, suggesting potential interference or dilution effects when multiple species are combined.
Table 6. Bioassay profile of single-species and mixed-species phytochemical extracts on Vigna radiata after 24-hour and 72-hour incubation in a dark setting
|
Material |
24-Hour Incubation |
72-Hour Incubation |
||||||
|
Radicle Length (cm) |
Radicle Length Ratio |
Germination (%) |
Radicle Length (cm) |
Radicle Length Ratio |
Germination (%) |
Total Seedling Length (cm) |
SVI |
|
|
Euphorbia hirta |
1.13 ± 0.25 |
0.95 |
100.00 |
5.38 ± 2.26 |
0.90 |
100.00 |
64.6 |
64.6 |
|
Cleome rutidosperma |
0.82 ± 0.61 |
0.69 |
77.78 |
4.09 ± 4.12 |
0.68 |
77.78 |
48.4 |
37.7 |
|
Sida rhombifolia |
0.68 ± 0.54 |
0.57 |
77.78 |
4.43 ± 2.73 |
0.74 |
100.00 |
55.6 |
55.6 |
|
Ageratum conyzoides |
1.18 ± 0.34 |
0.99 |
100.00 |
9.47 ± 3.49 |
1.58 |
100.00 |
105.9 |
105.9 |
|
Asystasia gangetica |
1.09 ± 0.54 |
0.92 |
100.00 |
4.84 ± 3.13 |
0.81 |
100.00 |
61.1 |
61.1 |
|
Phyllanthus amarus |
0.91 ± 0.75 |
0.77 |
88.89 |
4.17 ± 3.50 |
0.69 |
100.00 |
52.8 |
52.8 |
|
Mikania micrantha |
1.30 ± 0.19 |
1.09 |
100.00 |
5.62 ± 3.00 |
0.94 |
100.00 |
68.1 |
68.1 |
|
Alternanthera sessilis |
0.60 ± 0.58 |
0.50 |
88.89 |
3.70 ± 3.75 |
0.62 |
100.00 |
43.3 |
43.3 |
|
Ruellia tuberosa |
0.90 ± 0.67 |
0.76 |
77.78 |
5.89 ± 4.68 |
0.98 |
100.00 |
66.5 |
66.5 |
|
Spigelia anthelmia |
0.74± 0.61 |
0.62 |
77.78 |
2.40 ± 3.13 |
0.40 |
100.00 |
32.5 |
32.5 |
|
Mixed-species |
1.21 ± 0.48 |
1.02 |
88.89 |
6.38 ± 3.35 |
1.06 |
100.00 |
73.4 |
73.4 |
|
Aqua destillata |
1.19 ± 0.54 |
base |
88.89 |
6.00 ± 3.59 |
base |
100.00 |
68.8 |
68.8 |
After a 72-hour incubation period, the phytochemical extracts from both single and mixed species exhibited differences in their positive effects on growth compared to the initial 24-hour period. Notably, the mixed-species extract showed a slight positive effect, and changes in germination rates were observed. A substantial increase was noted in A. conyzoides, where the positive growth performance for radicle growth reached approximately 57.8%. M. micrantha shifted from stimulation at 24 h (ratio 1.09) to slight inhibition at 72 h (ratio 0.94). The Kruskal-Wallis Independent-Samples Test showed that phytochemical treatment after 72 hours significantly affected radicle growth (sig. = 0.027) and total seedling length (sig. = 0.026). However, pairwise comparisons between phytochemical extracts and controls showed no significant differences. The Seedling Vigor Index (SVI) indicated that the mixed-species extract performed better compared to the control. In summary, this preliminary bioassay suggests that the mixed-species phytochemical extract tends to act as a positive growth response catalyst.
3.2 Media-dependent effects of phytochemical mixture on growth, yield, and physiological parameters of shallot
Disease incidence (DI), assessed using the criteria described in Table 4, varied substantially across treatments and growth media (Table 7). Under SI alone, DI was lowest in SWB (0.00%), followed by CPB (3.33%) and RCB (10.00%), indicating that all three growing media supported relatively low disease pressure under conventional management. When the PM was applied alone, DI increased across all media: CPB (3.33% → 20.00%), RCB (10.00% → 20.00%), and SWB (0.00% → 10.00%). The combination treatment (PMSI) produced divergent, media-dependent outcomes.
Table 7. Disease incidence (DI, %) in shallot under different combinations of treatments and growing media
|
Growing Media |
Disease Incidence Based on Cultivation Method (%) |
|||||
|
Synthetic Input |
Phytochemical Mixture |
Phytochemical Mixture-Synthetic Input |
||||
|
% |
N |
% |
N |
% |
N |
|
|
CPB |
3.33 |
30 |
20.00 |
30 |
3.33 |
30 |
|
RCB |
10.0 |
30 |
20.00 |
30 |
20.00 |
30 |
|
SWB |
0.00 |
30 |
10.00 |
30 |
26.67 |
30 |
Table 8. Growth, yield, and physiological performance of shallot under different combinations of treatments and growth media
|
Treatments |
Growing Media |
Number of Tillers |
Bulbs/Clump |
Bulb Length (cm) |
Bulb Diameter (cm) |
Plant Height (cm) |
Number of Leaves |
|
SI |
CPB (n = 20) |
5.65 ± 0.99 |
7.35 ± 1.31 |
2.40 ± 0.15 |
1.45 ± 0.22 |
33.80 ± 3.00 |
26.85 ± 7.14 |
|
RCB (n = 20) |
7.60 ± 1.82 |
9.20 ± 1.47 |
2.70 ± 0.11 |
1.79 ± 0.28 |
33.40 ± 3.95 |
33.05 ± 8.24 |
|
|
SWB (n = 20) |
5.70 ± 1.75 |
7.35 ± 1.50 |
2.80 ± 0.19 |
1.72 ± 0.16 |
34.30 ± 8.27 |
28.70 ± 10.47 |
|
|
PM |
CPB (n = 20) |
5.95 ± 2.04 |
8.00 ± 1.49 |
2.33 ± 0.12 |
1.34 ± 0.12 |
35.45 ± 2.84 |
24.20 ± 2.94 |
|
RCB (n = 20) |
7.00 ± 2.13 |
8.00 ± 1.45 |
2.67 ± 0.16 |
1.42 ± 0.19 |
30.45 ± 5.36 |
19.70 ± 2.65 |
|
|
SWB (n = 20) |
6.40 ± 1.50 |
8.15 ± 1.46 |
2.83 ± 0.16 |
1.53 ± 0.20 |
35.80 ± 4.19 |
15.60 ± 2.02 |
|
|
PMSI |
CPB (n = 20) |
10.10 ± 1.25 |
10.45 ± 1.99 |
2.41 ± 0.26 |
1.38 ± 0.16 |
26.80 ± 9.56 |
22.95 ± 12.57 |
|
RCB (n = 20) |
7.25 ± 1.48 |
8.25 ± 1.02 |
2.85 ± 0.17 |
1.71 ± 0.26 |
33.45 ± 3.24 |
29.95 ± 7.40 |
|
|
SWB (n = 20) |
7.40 ± 1.31 |
8.75 ± 1.16 |
2.99 ± 0.11 |
1.76 ± 0.16 |
38.05 ± 1.54 |
28.80 ± 8.47 |
|
|
Treatments |
Growing Media |
Bulb Weight/Clump (g) |
Weight Loss (%) |
Harvest Index |
Relative Growth Rate (× 10-3) |
Productivity/Vegetative Biomass |
|
|
Fresh Bulb |
Dry Bulb |
||||||
|
SI |
CPB (n = 20) |
28.07 ± 5.24 |
20.23 ± 4.13 |
27.67 ± 7.54 |
0.93 ± 0.01 |
-2.51 ± 3.22 |
2.41 ± 0.54 |
|
RCB (n = 20) |
30.45 ± 5.98 |
25.20 ± 5.13 |
17.29 ± 2.95 |
0.91 ± 0.02 |
4.97 ± 6.52 |
1.87 ± 0.36 |
|
|
SWB (n = 20) |
34.16 ± 6.41 |
28.00 ± 5.99 |
18.43 ± 3.71 |
0.89 ± 0.03 |
7.10 ± 7.49 |
1.91 ± 0.93 |
|
|
PM |
CPB (n = 20) |
29.94 ± 4.23 |
21.24 ± 2.90 |
21.30 ± 6.18 |
0.92 ± 0.03 |
1.92 ± 4.81 |
2.23 ± 0.68 |
|
RCB (n = 20) |
25.94 ± 6.56 |
22.38 ± 2.55 |
18.76 ± 5.59 |
0.91 ± 0.03 |
3.84 ± 6.09 |
1.44 ± 0.44 |
|
|
SWB (n = 20) |
33.40 ± 7.09 |
29.06 ± 3.76 |
18.76 ± 2.97 |
0.92 ± 0.03 |
0.29 ± 6.92 |
2.30 ± 0.75 |
|
|
PMSI |
CPB (n = 20) |
28.42 ± 6.55 |
24.94 ± 6.26 |
12.54 ± 5.30 |
0.91 ± 0.04 |
2.18 ± 5.90 |
1.91 ± 0.93 |
|
RCB (n = 20) |
40.58 ± 3.64 |
31.63 ± 4.83 |
22.29 ± 8.11 |
0.93 ± 0.03 |
-0.40 ± 4.57 |
2.59 ± 0.74 |
|
|
SWB (n = 20) |
43.72 ± 7.40 |
38.19 ± 6.65 |
12.65 ± 3.76 |
0.95 ± 0.01 |
-3.84 ± 6.03 |
2.51 ± 0.64 |
|
In CPB, PMSI restored DI to SI level (3.33%). In RCB, PMSI failed to reduce DI below the PM level (20.00% in both). In SWB, PMSI unexpectedly produced the highest DI in the study (26.67%), exceeding both SI and PM. Three distinct patterns emerged. In CPB, PM was detrimental, but the addition of SI fully mitigated this effect. In RCB, PM was detrimental, and SI provided no improvement. In SWB, PM had a modest detrimental effect, but the combination unexpectedly exacerbated disease to the highest level observed.
Growth, yield, and physiological parameters of shallot exhibited considerable variation across treatment combinations and growing media (Table 8). A detailed comparative analysis per growing medium revealed distinct treatment-specific responses. In CPB, the PMSI treatment was consistently slightly higher than all other treatments in terms of number of tillers, bulbs per clump, bulb length, dry bulb weight, and relative growth rate, while also exhibiting the lowest weight loss. Conversely, the SI treatment was superior in bulb diameter, number of leaves, harvest index, and productivity per vegetative biomass. Meanwhile, the PM treatment recorded the highest values for plant height and fresh bulb weight per clump, though it remained inferior to PMSI and SI in most other parameters.
In RCB, the PMSI treatment demonstrated the most favorable performance across multiple variables, including bulb length, plant height, fresh and dry bulb weight per clump, harvest index, and productivity per vegetative biomass. The SI treatment, however, excelled only in bulb diameter, number of leaves, number of tillers, bulbs per clump, relative growth rate, and exhibited the lowest weight loss, while the PM treatment failed to produce superior results for any of the assessed variables in this growing medium.
In sawdust-based media (SWB), the PMSI treatment was clearly dominant across nearly all evaluated parameters, including number of tillers, bulbs per clump, bulb length and diameter, plant height, leaf number, fresh and dry bulb weight, weight loss, harvest index, and productivity per vegetative biomass. The only exception was relative growth rate, where the SI treatment registered the highest value, substantially exceeding both PMSI and PM.
Overall, PMSI consistently ranked first in the majority of variables across all growing media, with superiority in 11 out of 12 variables in SWB, 6 out of 12 in CPB, and 5 out of 12 in RCB. SI showed media-dependent performance, excelling in 7 out of 12 variables in RCB, 4 out of 12 in CPB, and only 1 out of 12 in SWB. Meanwhile, PM was the least effective, demonstrating superiority in only 2 variables in CPB and none in RCB or SWB. These findings indicate that PMSI offers the most consistent advantage across growing media, while SI remains particularly competitive in RCB.
Based on the treatment (SI, PM, PMSI), in general, SWB produced the best performance, followed by RCB and CPB. In the SI treatment, SWB was superior in the variables of bulb length, plant height, fresh and dry bulb weight per clump, and relative growth rate. RCB was superior in the variables of number of tillers, bulbs per clump, bulb diameter, number of leaves, and the lowest weight loss. Meanwhile, CPB was superior in the variables of harvest index and productivity per vegetative biomass. In the PM treatment, SWB produced the best results in all variables studied, except for number of tillers, plant height, and relative growth rate. RCB was superior in number of tillers and relative growth rate, while CPB was superior only in plant height. In the PMSI treatment, SWB proved to be superior to other growing media in several variables, including bulb length, bulb diameter, plant height, and both the fresh and dry weight of bulbs per clump, as well as the harvest index. RCB excelled in two aspects: the number of leaves and productivity per vegetative biomass. On the other hand, CPB showed better results in terms of the number of tillers, bulbs per clump, relative growth rate, and exhibited the smallest weight loss.
The performance ratio (PR) of PM and PMSI treatments compared to SI treatment is shown in Table 9. An evaluation of the variables across all planting media (12 variables for 3 planting media) reveals the following: When PM is used solely as a substitute for SI, performance decreased in 21 variables (58.33%), increased in 14 variables (38.89%), and showed no change in 1 variable (2.78%). Conversely, when PM is used as a complement to SI (PMSI treatment), it increased performance in 22 variables (61.11%), decreased performance in 12 variables (33.33%), and showed no change in 2 variables (5.56%). These findings suggest that PM is more effective when used as a complement to SI rather than as a substitute.
In CPB, the use of PM as a substitute for SI enhances performance in several variables: the number of tillers improves by 5%, bulbs per clump increase by 9%, plant height rises by 5%, and fresh bulb weight increases by 7%. Additionally, dry weight of bulbs per clump increases by 5%, and the relative growth rate improves by 5%, while weight loss during drying decreases by 23%. When PM is used in combination with SI (referred to as the PMSI treatment), there are even greater performance gains in some variables. For example, the number of tillers increases from 5% to 78%, bulbs per clump improve from 9% to 42%, and the dry weight of bulbs per clump rises from 5% to 23%. Moreover, weight loss during drying diminishes from a 23% reduction to a 55% reduction. However, the PMSI treatment also leads to some negative impacts compared to SI: reduced performance in bulb diameter (-5%), plant height (-21%), number of leaves (-15%), harvest index (-1%), and productivity per unit of vegetative biomass (-21%).
Table 9. Performance ratio of phytochemical mixture (PM) treatments relative to synthetic input (SI) on growth, yield, and physiological parameters of shallot
|
Performance Ratio (PR) |
Growing Media |
Number of Tillers |
Bulbs/ Clump |
Bulb Length |
Bulb Diameter |
Plant Height |
Number of Leaves |
|
PM / SI |
CPB |
1.05 |
1.09 |
0.97 |
0.92 |
1.05 |
0.90 |
|
RCB |
0.92 |
0.87 |
0.99 |
0.79 |
0.91 |
0.60 |
|
|
SWB |
1.12 |
1.11 |
1.01 |
0.89 |
1.04 |
0.54 |
|
|
PMSI / SI |
CPB |
1.78 |
1.42 |
1.00 |
0.95 |
0.79 |
0.85 |
|
RCB |
0.95 |
0.90 |
1.05 |
0.96 |
1.00 |
0.91 |
|
|
SWB |
1.30 |
1.19 |
1.07 |
1.02 |
1.11 |
1.00 |
|
|
Performance Ratio (PR) |
Growing Media |
Bulb Weight/Clump |
Weight Loss |
Harvest Index |
Relative Growth Rate (RGR) |
Productivity per Unit Vegetative Biomass |
|
|
Fresh Bulb |
Dry Bulb |
||||||
|
PM / SI |
CPB |
1.07 |
1.05 |
0.77 |
0.99 |
1.05 |
0.93 |
|
RCB |
0.85 |
0.89 |
1.09 |
1.00 |
0.99 |
0.77 |
|
|
SWB |
0.98 |
1.04 |
1.02 |
1.03 |
0.94 |
1.20 |
|
|
PMSI / SI |
CPB |
1.01 |
1.23 |
0.45 |
0.99 |
1.05 |
0.79 |
|
RCB |
1.33 |
1.26 |
1.29 |
1.02 |
0.95 |
1.39 |
|
|
SWB |
1.28 |
1.36 |
0.69 |
1.07 |
0.90 |
1.31 |
|
In RCB medium, the substitution of SI with PM generally reduced performance across most variables, except for weight loss, which increased, while the harvest index remained unchanged. Conversely, the use of PM as a supplement to SI increased performance across bulb length (5%), fresh (33%) and dry (26%) weight of bulbs per clump, and harvest index (2%). Despite the increase in harvest weight, the proportion of weight loss during drying also increased by 29%, indicating the need for further research to maintain harvest quality. In general, in RCB media, the use of PM should be directed as a supplement to SI because it increases the (absolute) weight of the harvest. In SWB media, the use of PM as a substitute for SI improved performance in most variables except for bulb diameter (-11%), number of leaves (-46%), fresh bulb weight per clump (-2%), relative growth rate (-6%), and increased drying losses (2%). Conversely, the use of PM as a supplement to SI improved performance in all variables studied except for the relative growth rate variable (-10%). These findings indicate that the use of PM as a supplement to SI in SWB is highly recommended.
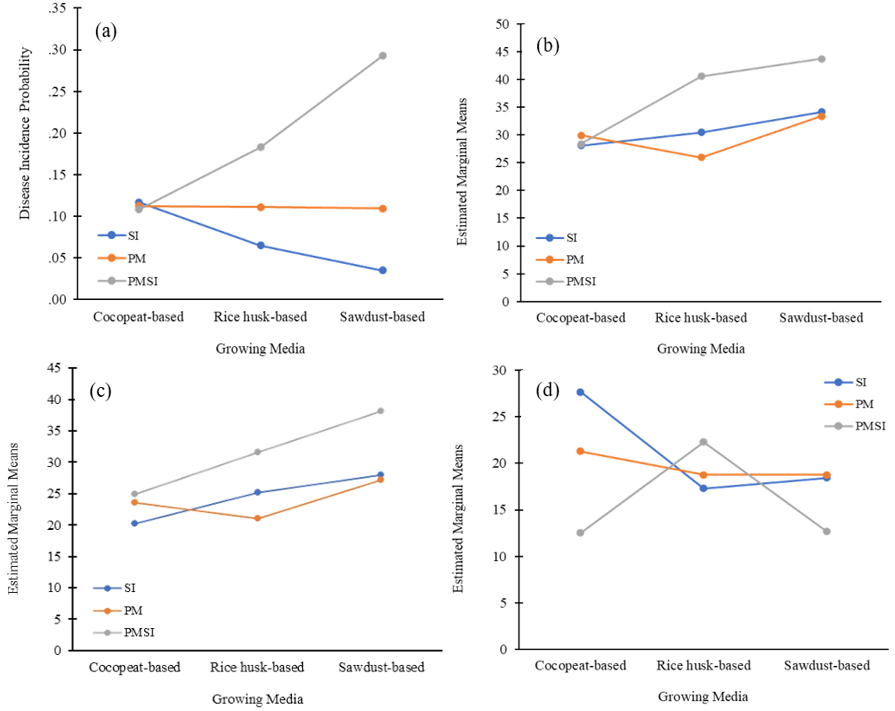
A two-way ANOVA revealed significant main effects and interaction effects for most growth and yield parameters, indicating that treatment factors, growing media, and their interaction differentially influenced shallot performance (Table 10). Figure 3 showed an interaction plot of DI probability, fresh bulb weight per clump (g), dry bulb weight per clump (g), and bulb weight loss per clump (%). The number of tillers was significantly affected by both treatment and growing media, as well as their interaction. Pairwise comparisons showed that the PMSI treatment differed significantly from both the SI and PM treatments, with post-hoc tests confirming SI-PMSI and PM-PMSI as significant pairs. For growing media, significant differences were noted between CPB-SWB and between RCB-SWB.
Table 10. Tests of between-subjects effects
|
Variable |
Source |
df |
F |
Sig. |
Partial Eta Squared |
Sig. Pairwise Comparisons (Tukey’s HSD, α = 0.05) |
|
Plant height |
Treatment |
2 |
0.868 |
0.421 (NS) |
0.010 |
No sig. pairwise |
|
Growing media |
2 |
10.565 |
<0.01 |
0.110 |
CPB-SWB, RCB-SWB |
|
|
Treatment * Growing media |
4 |
9.444 |
<0.01 |
0.181 |
|
|
|
Number of leaves |
Treatment |
2 |
1.336 |
0.266 (NS) |
0.015 |
No sig. pairwise |
|
Growing media |
2 |
2.711 |
0.069 (NS) |
0.031 |
No sig. pairwise |
|
|
Treatment * Growing media |
4 |
1.738 |
0.144 (NS) |
0.039 |
|
|
|
Number of tillers |
Treatment |
2 |
26.486 |
<0.01 |
0.237 |
SI-PMSI, PM-PMSI |
|
Growing media |
2 |
4.369 |
0.014 |
0.049 |
CPB-SWB, RCB-SWB |
|
|
Treatment * Growing media |
4 |
13.285 |
<0.01 |
0.237 |
|
|
|
Bulbs/clump |
Treatment |
2 |
12.456 |
<0.01 |
0.127 |
SI-PMSI, PM-PMSI |
|
Growing media |
2 |
2.097 |
0.126 (NS) |
0.024 |
No sig. pairwise |
|
|
Treatment * Growing media |
4 |
10.747 |
<0.01 |
0.201 |
|
|
|
Bulb length |
Treatment |
2 |
12.588 |
<0.01 |
0.128 |
SI-PMSI, PM-PMSI |
|
Growing media |
2 |
140.117 |
<0.01 |
0.621 |
CPB-RCB, CPB-SWB |
|
|
Treatment * Growing media |
4 |
1.820 |
0.127 (NS) |
0.041 |
|
|
|
Bulb diameter |
Treatment |
2 |
20.642 |
<0.01 |
0.194 |
SI-PM, PM-PMSI |
|
Growing media |
2 |
35.475 |
<0.01 |
0.293 |
CPB-RCB, CPB-SWB |
|
|
Treatment * Growing media |
4 |
3.061 |
0.018 |
0.067 |
|
|
|
Fresh bulb weight/clump |
Treatment |
2 |
29.507 |
<0.01 |
0.257 |
SI-PM, PM-PMSI |
|
Growing media |
2 |
28.608 |
<0.01 |
0.251 |
All pairwise |
|
|
Treatment * Growing media |
4 |
10.157 |
<0.01 |
0.192 |
|
|
|
Dry bulb weight/clump |
Treatment |
2 |
36.337 |
<0.01 |
0.298 |
SI-PMSI, PM-PMSI |
|
Growing media |
2 |
34.397 |
<0.01 |
0.287 |
All pairwise |
|
|
Treatment * Growing media |
4 |
5.795 |
<0.01 |
0.119 |
|
|
|
Weight loss |
Treatment |
2 |
15.174 |
<0.01 |
0.151 |
SI-PMSI, PM-PMSI |
|
Growing media |
2 |
8.223 |
<0.01 |
0.088 |
CPB-SWB, RCB-SWB |
|
|
Treatment * Growing media |
4 |
18.206 |
<0.01 |
0.299 |
|
|
|
Harvest Index |
Treatment |
2 |
7.918 |
<0.01 |
0.085 |
SI-PMSI, PM-PMSI |
|
Growing media |
2 |
.562 |
0.571 (NS) |
0.007 |
No sig. pairwise |
|
|
Treatment * Growing media |
4 |
12.781 |
<0.01 |
0.230 |
|
|
|
Relative growth rate |
Treatment |
2 |
6.898 |
<0.01 |
0.075 |
SI-PMSI, PM-PMSI |
|
Growing media |
2 |
2.403 |
0.094 (NS) |
0.027 |
No sig. pairwise |
|
|
Treatment * Growing media |
4 |
9.798 |
<0.01 |
0.186 |
|
|
|
productivity/ vegetative biomass |
Treatment |
2 |
4.450 |
0.013 |
0.049 |
No sig. pairwise |
|
Growing media |
2 |
3.056 |
0.050 |
0.035 |
RCB-SWB |
|
|
Treatment * Growing media |
4 |
8.881 |
<0.01 |
0.172 |
|
Figure 3. Interaction plots for selected variables: (a) disease incidence (DI) probability, (b) fresh bulbs weight per clump, (c) dry bulbs weight per clump, and (d) bulbs weight loss per clump
Similarly, bulbs per clump exhibited significant treatment and interaction effects, with significant pairwise comparisons observed between SI-PMSI and PM-PMSI. However, the main effect of treatment, growing media, and interaction effect of treatment * growing media on number of leaves was not significant (all p > 0.05). The treatment also showed no significant effect on plant height, and growing media had no significant effect on: bulbs per clump (p = 0.126), harvest index (p = 0.571), and relative growth rate (p = 0.094). Bulb length was significantly influenced by both treatment and growing media, with notable pairwise differences between SI-PMSI and PM-PMSI for treatments, as well as significant differences found for CPB–RCB and CPB–SWB (RCB–SWB was not significant). The treatment × media interaction was not significant (p = 0.127), indicating that the growing media effects on bulb length were consistent across treatments.
Bulb diameter demonstrated significant effects for treatment, growing media, and their interaction. Pairwise comparisons revealed that SI-PM and PM-PMSI were significant treatment pairs, and CPB-RCB and CPB-SWB were significantly different from one another. Fresh bulb weight per clump was significantly affected by treatment, growing media, and their interaction. Tukey's HSD test revealed significant pairwise differences between SI–PM and PM–PMSI, but not between SI–PMSI. In contrast, all pairwise comparisons among growing media were statistically significant. Dry bulb weight exhibited similar patterns, showing significant treatment effects, media effects, and interaction effects, with SI-PMSI and PM-PMSI as significant treatment pairs. Weight loss during drying revealed significant effects for treatment, growing media, and their interaction. Pairwise differences were significant between SI-PMSI and PM-PMSI for treatments, as well as between CPB-SWB and RCB-SWB for growing media. The Harvest Index was significantly affected by treatment and interaction, with SI-PMSI and PM-PMSI as significant pairs, although media effects were not significant (p = 0.571). Relative growth rate showed significant treatment effects and interaction effects, with SI-PMSI and PM-PMSI as significant pairwise comparisons. Media effects were not significant (p = 0.094). Productivity per unit of vegetative biomass demonstrated significant treatment effects, media effects, and interaction effects. However, no significant pairwise treatment differences were detected, although media differences were found between rice husk and sawdust (RCB-SWB). Overall, the strong interaction effects observed for most variables (η²p ranging from 0.067 to 0.299) confirm that the response of shallots to phytochemical treatments is highly dependent on the type of growing media. This supports the media-specific recommendations derived from this study. A summary matrix categorizing each of the nine treatment-media combinations by performance ratio and DI is presented in Table 11.
Table 11. Summary matrix of treatment × growth media effects on shallot growth and disease incidence (DI)
|
Growing Media |
Synthetic Alone |
Phytochemical Alone |
Phytochemical – Synthetic |
|
Cocopeat-based (CPB) |
Baseline |
It can serve as a catalyst for production, resulting in positive outcomes (fresh and dry bulb weight); however, there is an increased risk of disease. |
It can serve as a catalyst for production, resulting in greater positive outcomes (fresh and dry bulb weight); a low-risk disease. |
|
Rice Husk-based (RCB) |
Baseline |
Not recommended. It may inhibit growth and increase disease risk. |
It increases the yield but inhibits growth; disease risk may increase. |
|
Sawdust-based (SWB) |
Baseline |
It exhibits a positive growth response but a tendency to decrease the yield (mixed-effect); increased risk of disease. |
Highly recommended. It exhibits a positive growth response and increases the yield; however, there is an increased risk of disease. |
4.1 Preliminary bioassay validation
The superior radicle elongation observed in Mikania micrantha treatment suggests the presence of bioactive compounds that stimulate early root development. Previous studies identified α-Bisabolol and Eudesma-5,11(13)-dien-8,12-olide in M. micrantha extract, which possess dual bioactivity: promoting root initiation at low concentrations but inhibiting growth at higher concentrations—a characteristic feature of biostimulant compounds [36]. In the 24-hour assay, the positive effect on radicle elongation likely reflects this early-stage promoting activity. In contrast, A. sessilis is rich in water-soluble phenolic compounds (e.g., chlorogenic and gallic acids) responsible for negative growth response effects. These compounds may interfere with germination-related enzymes, inhibit mobilization of seed storage reserves, and disrupt cell membrane permeability, thereby impairing embryo development and reducing radicle elongation [37]. The severely shortened radicle length observed in A. sessilis treatment is consistent with these mechanisms. In conclusion, the bioactivity of phytochemical extracts on V. radiata is highly species-dependent. Mixing multiple species did not enhance—and may have diminished—the beneficial effects observed from individual species, highlighting the importance of species selection and concentration optimization. Nevertheless, the PM used in this study showed a tendency as a biostimulant. Future studies should investigate dose-dependent responses of purified compounds to better understand their biostimulatory and inhibitory thresholds.
4.2 Media-dependent duality: Production and post-harvest performance
The DI pattern observed appears closely related to the interaction between fungicide and WHC. In the absence of synthetic fungicide (PM treatment), high WHC increases DI [38]. When synthetic fungicide is applied (SI and PMSI), high WHC may prolong its residence time, potentially enhancing disease control. However, excessive WHC may trigger uneven fungicide distribution, thereby elevating DI risk. One possible explanation for the observed patterns is that high concentrations of iron (Fe) and manganese (Mn) could increase pathogen fungal infection risk when plants are treated with either synthetic chemicals or phytochemicals alone, but an opposite trend was observed in the PMSI. This observed reversal might be related to protective elements such as calcium (Ca), zinc (Zn), and silicon (Si) in the growing media. Conversely, SWB appears to contain only low levels of these protective elements, which could explain its reduced protection against pathogens. These results align with earlier findings that micronutrient imbalances—especially excess Fe and Mn—can worsen fungal pathogen infections, while adequate Ca, Zn, and Si strengthen plant resistance [39, 40]. The increased DI in RCB upon phytochemical supplementation (PMSI) raises the possibility of reduced Ziram fungicide activity, potentially due to chelation or binding of the Zn ion essential for Ziram's fungicidal activity [41]. Such interaction could render Ziram less effective prior to pathogen exposure. For example, quercetin (present in Euphorbia) contains hydroxyl and carbonyl groups that function as metal-binding sites [42, 43].
RCB demonstrated a higher tiller count than SWB and CPB under SI, which is consistent with its greater phosphorus content [44, 45]. However, this advantage was not observed under PMSI treatment, which may be related to phenolic acid compounds that are known to impede phosphorus absorption, thereby reducing tiller formation [46]. In contrast, the PMSI substantially elevated tiller number in CPB—an effect not observed when either treatment was applied separately—possibly due to CPB's exceptionally high WHC, which could prolong residence time of both synthetic fertilizers and phytochemicals.
Three distinct media-specific patterns emerged with clear implications for production and post-harvest parameters. CPB was the only medium where PM improved bulbs per clump compared to SI. When PM combined with SI, these improvements became substantially larger, consistent with the hypothesis that CPB high WHC may extend residence time of both inputs and enable sustained complementary action. Post-harvest quality in CPB also improved: PM and PMSI reduced weight loss during drying. Phytochemicals led to smaller bulb diameter, which reduced drying surface area per bulb, resulting in better post-drying characteristics and longer storage life [47]. For farmers, two viable options exist: using PM alone to reduce SI dependency, or using PMSI to maximize yield and post-harvest quality.
RCB presented the opposite pattern, where the PM exhibited predominantly negative growth response effects as summarized in Table 10. PM as a substitute or as a complementer of SI reduced key growth parameters below SI levels: bulbs per clump, bulb diameter, and the number of leaves. While negative growth response effects are often mediated by phytochemicals, such a mechanism appears unlikely here. An alternative hypothesis is that phytotoxicity is indirectly facilitated by microbial activity. Decomposition of RC, accelerated by microbiota from CM, might cause release and accumulation of Fe and Mn, which could exert toxic effects on plants [48, 49]. Phytochemicals (e.g., phenolics and flavonoids) are known metal chelators; it is possible that they chelated essential micronutrients or interfered with silicon uptake and translocation. Given silicon's critical role in strengthening cell walls and forming water-resistant outer skin, if disruption of silicon metabolism occurs, it could compromise bulb skin integrity and water retention [50], which may explain the higher weight loss observed during curing. The PM solely increased post-harvest weight loss, and combination with SI (PMSI) reduces this effect. For farmers, the PM offers no advantage and may be detrimental in RCB, consistent with the negative growth response effects summarized in Table 11.
SWB displayed a mixed pattern: PM alone showed positive growth with a negative yield (negative properties), while PMSI acted as a positive catalyst for both growth and yield. PMSI substantially improved both fresh and dry bulb weight parameters and reduced weight loss. However, this benefit must be weighed against elevated disease risk (26.67% under PMSI). This pattern creates a high-risk, high-reward trade-off: exceptional yield and quality performance but with the highest DI observed in the study. Unlike in RCB, phytochemicals in SWB may not have interfered with silicon metabolism, possibly due to SWB's negligible intrinsic silica content. This pattern suggests that in SWB, the mixture is only beneficial when used together with SI—a finding pointing to the unique decomposition dynamics of SWB, as discussed below.
4.3 Mechanisms underlying media-dependent effects: Water holding capacity and decomposition
The observed patterns can be explained by two interacting mechanisms: WHC and decomposition dynamics. The Performance Ratio data suggest that WHC may play a crucial role in determining the effectiveness of PM, even though WHC was not directly measured in this study. In the case of CPB, which is known for its high WHC, PM improved bulbs per clump by 9% compared to SI. However, in RCB, which has low WHC, PM resulted in a decrease in bulbs per clump by 13% and bulb diameter by 21%. SWB, which has intermediate WHC, also showed negative effects under PM; the number of leaves decreased by 46%, bulb diameter by 11%, fresh weight by 2%, and weight loss increased by 2%. These contrasting results suggest that a sufficient level of WHC may be necessary for the mixture to exhibit a positive effect. However, this hypothesis needs to be verified directly through WHC measurement.
The relationship between WHC and DI is more complex. In the case of CPB, high WHC may have acted as a protective factor when synthetic fungicide was present–potentially by extending fungicide residence time–but became a risk factor when fungicide was absent, as persistent moisture may create an ideal environment for fungal proliferation. Thus, high-WHC media may be safe only when fungicide protection is maintained. The pattern is consistent with the observation that DI in CPB decreased from 20.00% (PM) to 3.33% (PMSI) when fungicide was added.
A potential mechanism for the observed disease patterns may involve nitrogen availability. Pathogenic fungi might act as nitrogen scavengers: when nitrogen is plentiful, they could live saprophytically; when nitrogen becomes scarce, they might switch to a pathogenic mode [39]. This mechanism could explain the pattern observed in CPB, where the addition of synthetic nitrogen reduced DI from 20.00% to 3.33%. However, this hypothesis does not fully account for the behavior seen in RCB, where DI remained at 20.00% regardless of nitrogen addition, or in SWB, where nitrogen addition unexpectedly increased DI from 10.00% to 26.67%. In RCB, other factors—such as negative phytochemical–fungicide interaction—may have overridden the nitrogen effect. In SWB, active decomposition dynamics likely favored pathogen fungi regardless of nitrogen availability.
Decomposition dynamics in SWB represent a high-risk, high-reward environment. We hypothesize that SW underwent significant decomposition during the two-month experiment, in contrast to CP, which is largely inert, and RC, which is protected by silica. This hypothesis is based on the known chemical composition of SW, which contains extractable compounds such as resins, terpenes, and phenolics, as well as labile carbohydrates that support microbial activity–though the specific composition of the SW used in this study was not analyzed. Additionally, the distinct growth and disease patterns observed in SWB align with this interpretation. We propose that decomposition may have released bioavailable compounds, such as simple sugars, organic acids, and phenolic fragments, which could have contributed to enhanced root growth, nutrient uptake, and stress tolerance. The presence of PM may have accelerated this decomposition, while synthetic fertilizers provided nitrogen to prevent any immobilization that could limit growth. However, this same process might have also favored fungi: the release of simple sugars could have provided food for pathogens, temporary nitrogen immobilization may have created nitrogen stress, and the loss of natural antimicrobials could have diminished chemical defenses. The net outcome was a high-risk, high-reward environment—offering exceptional growth potential but also increasing the likelihood of disease outbreaks. This hypothesis explains the SWB paradox: while PMSI produced the strongest putative supplementary enhancer for growth, productivity, and yield, it also led to the highest DI (26.67%).
A concerning pattern has emerged in RCB and SWB regarding the compatibility of fungicides. In RCB, DI was identical at 20.00% with or without the application of fungicide. In SWB, PMSI showed a significantly higher DI of 26.67%, compared to 10.00% for PM. This negative interaction suggests that the combination may interfere with the effectiveness of fungicide through several possible mechanisms that warrant further investigation. For example, adsorptive compounds such as tannins and phenolics may bind to the active ingredient; the mixture could stimulate the microbial degradation of the fungicide, or sublethal exposure might induce cross-tolerance in pathogenic fungi. Importantly, this interaction was dependent on the media used, as it did not occur in CPB, where WHC may have allowed fungicide residues to persist long enough to mitigate interference. However, none of these proposed mechanisms were directly tested in this study and should be regarded as hypotheses that require experimental verification.
4.4. Practical recommendations for shallot farmers
Based on the observed data, the following media-specific recommendations are offered. These are derived from a single controlled study and should be validated under commercial conditions:
•CPB: Use PMSI for maximum yield and post-harvest quality while maintaining fungicide; PM alone is an option only if farmers accept moderate disease risk.
•RCB: Conventional SI remains the preferred approach. PM is not advised; if used, expect reduced growth, higher weight loss, and no disease benefit.
•SWB: PMSI is a high-risk, high-reward option. Only adopt if farmers can implement additional disease management (e.g., shorter cycles, fungicide rotation, disease-free planting material, or pre-composting SW). PM alone is not recommended.
In all growing media, PM alone does not suppress disease. Combining PM with fungicide showed media-dependent incompatibility: effective in CPB, ineffective in RCB, and detrimental in SWB. Farmers should not reduce fungicide applications when using PM, especially in RCB and SWB. Economic analyses and multicycle field validations are needed before large-scale adoption.
4.5 Limitations and future directions
Several limitations should be acknowledged when interpreting the findings of this study. These limitations relate to chemical characterization, experimental design, statistical analysis, the scope of mechanistic inference, and lack of etiological confirmation of the observed disease. First, the phytochemical composition of the mixture was not chemically analyzed, so specific bioactive compounds responsible for the observed positive or negative growth response effects remain unknown. Second, another limitation concerns the physicochemical characterization of the final mixed substrates. Parameters such as actual C/N ratio, EC, porosity, WHC, and available nutrient contents of the final growing media (CPB, RCB, and SWB) were not directly measured. In particular, EC was not measured at all due to equipment limitations, which prevented evaluation of substrate salinity as a potential factor influencing plant growth and DI. It is important to acknowledge that the components of the growing media are natural by-products with inherent batch-to-batch variation. Since the materials used in this study were obtained from multiple suppliers but within a single procurement period, the reproducibility of the absolute nutrient values is assured for those specific batches. However, caution should be exercised when generalizing these findings to materials from different suppliers, harvest seasons, or production cycles. Future studies employing substrates from varied sources are recommended to validate the consistency of these results.
Third, the study lacks pathogen isolation, microscopy, or molecular confirmation, although the symptoms were very similar to those typically caused by Fusarium sp. Conclusions regarding disease percentages are descriptive and based solely on macroscopic symptoms, which may limit our interpretative power. Fourth, the study was conducted under controlled conditions and may not fully represent commercial production systems. The two-month duration of the shallot experiment captured only a single growing cycle; longer-term studies are needed to assess the persistence of effects and potential cumulative impacts of repeated phytochemical applications. Fifth, several limitations of the statistical analysis should be acknowledged. While two-way ANOVA revealed significant main and interaction effects for most variables, the effect sizes (Partial Eta Squared) varied considerably, ranging from 0.035 (small effect) to 0.621 (very large effect). Fifth, the proposed mechanisms were not directly measured in this study. We did not measure decomposition rates (e.g., CO₂ evolution, C/N ratio), nitrogen availability over time, fungicide residues, or pathogen fungi population density. Consequently, these mechanisms should be interpreted as hypotheses requiring direct experimental verification rather than established explanations.
To address these limitations, future research should investigate the following priorities: (i) chemical analysis of the PM using LC-MS to identify specific bioactive compounds, followed by dose-response experiments with purified compounds to establish biostimulant versus phytotoxic thresholds; (ii) Future studies should prioritize direct measurement of EC, WHC, porosity, decomposition rates, and nutrient dynamics in each growing medium, including time-series measurements of Fe, Mn, Ca, Zn, and Si concentrations in soil solution on the final substrates to enable more robust interpretation; (iii) Longer-term and multi-cycle experiments to assess the persistence of biostimulant effects, potential accumulation of the phytochemicals or their degradation products, and impacts on soil microbial communities; and (iv) combines comprehensive phytopathological diagnostics, including Koch’s postulates and molecular coding, to definitively identify the pathogen involved and to establish a clear disease etiology. Despite these limitations, this study provides a valuable empirical foundation for understanding the media-dependent effects of a PM on shallot growth, DI, and post-harvest quality. The consistent patterns observed across multiple variables and the clear media-specific responses offer a robust basis for generating testable hypotheses and guiding future research. However, the proposed mechanisms should be treated as hypotheses requiring direct verification, and practical recommendations should be applied with caution pending field validation.
This study confirms that the performance of a PM on shallot is strongly media-dependent, with each growing medium exhibiting distinct response patterns. In CPB media, the combination of the PM and SI (PMSI) produced the most favorable outcomes compared to SI, with DI remaining comparable. In contrast, RCB media showed predominantly negative responses; the PM alone reduced bulbs per clump, bulb diameter, and number of leaves, while DI increased from 10.00% to 20.00%. Even when combined with SI, DI in rice-husk remained at 20.00%, indicating a potential incompatibility between the mixture and fungicide in this medium. SWB media presented a high-risk, high-reward scenario: the combination treatment produced the highest yields observed in the study, with fresh bulb weight increasing by 28% and dry bulb weight by 36%, alongside the best curing quality with a 31% reduction in weight loss. However, this was accompanied by the highest DI at 26.67%, substantially exceeding both synthetic alone and PM alone.
Across all media types, a consistent finding emerged: the PM alone did not suppress disease. DI either increased or remained unchanged relative to synthetic controls, confirming that the mixture should not be viewed as a substitute for fungicides. Furthermore, the interaction between the PM and synthetic fungicide was media-dependent- effective in CPB, ineffective in RCB, and apparently detrimental in SWB- highlighting the need for caution when combining biological and chemical applications when using this mixture, particularly in RCB and SWB. The two-way ANOVA confirmed significant treatment-by-media interactions for most yield and quality parameters, with Partial Eta Squared values ranging from 0.067 to 0.299, validating the media-specific responses observed in this study. However, the proposed mechanisms involving WHC, silicon content, and decomposition dynamics remain hypotheses, as these factors were not directly measured. Future research should prioritize chemical characterization of the mixture to identify active compounds, direct measurement of media physicochemical properties including WHC and decomposition rates, field validation under commercial production conditions, and strategies to mitigate disease risk in SWB media, such as pre-composting. Despite these limitations, this study provides an empirical foundation for developing media-tailored biostimulant formulations and offers testable hypotheses for future mechanistic investigations.
This work is supported by the Regional Research and Innovation Agency of South Sumatra Province, Indonesia and the Regional Research and Innovation Agency of Ogan Ilir Regency, Indonesia.
All authors contributed to writing the manuscript, with specific roles as follows: Tili Karenina, Karmelina, and Dian Novriadhy were responsible for concept development; Zepri Ariadi, Hendrixon, and Achmad Ubaidillah focused on soil-related analysis; Sri Maryani and Popo Marinda conducted the statistical analysis and its interpretation; and Desri Yesi, Oom Komalasari, and Wenni Tania Defriyanti engaged in phytochemical-related analysis.
The deepseek.com was used to improve readability and to correct sentences. The author performed all data and analysis, and the AI generated no artificial data.
[1] Silaban, F.A., Trilaksono, B.R., Mahayana, D., et al. (2026). Forecasting soil moisture and pH on edge for shallot cultivation using temporal fusion transformer. Smart Agricultural Technology, 13: 101884. https://doi.org/10.1016/j.atech.2026.101884
[2] Sigalingging, R., Pasaribu, R.R.I., Vinolina, N.S., Harahap, L.A., Sigalingging, C., Purwandari, K. (2025). Photosynthetic energy assessment in shallot farming using combining Sentinel-2 data with NetBeatTM in a highland tropical agroecosystem: Case study at food estate Hutajulu, North Sumatra, Indonesia. Energy Nexus, 19: 100513. https://doi.org/10.1016/j.nexus.2025.100513
[3] Domingo, A.V. (2023). Economic appraisal and strategic analysis of the onion industry in the Philippines. International Journal of Advanced and Applied Sciences, 10(8): 78-90. https://doi.org/10.21833/ijaas.2023.08.009
[4] Priyadi, R., Sunarya, Y., Juhaeni, A.H., Meylani, V. (2023). The effect of poultry manure organic fertilizer types and doses to the growth and production of shallot (Allium ascalonium L.). International Journal of Design & Nature and Ecodynamics, 18(2): 341-349. https://doi.org/10.18280/ijdne.180211
[5] Purba, S.F., Sihombing, Y., Mardiharini, M., et al. (2024). Determinants of shallot innovation adoption and yields in Temanggung Regency, Central Java. International Journal of Design & Nature and Ecodynamics, 19(4): 1167-1176. https://doi.org/10.18280/ijdne.190407
[6] Yasir, M., Hossain, A., Pratap-Singh, A. (2025). Pesticide degradation: Impacts on soil fertility and nutrient cycling. Environments, 12(8): 272. https://doi.org/10.3390/environments12080272
[7] Kosnayani, A.S., Yunianto, A.E., Rizal, M.E.A., Meylani, V. (2022). Analysis of phytochemical content and antioxidant activity in Phyllanthus niruri Linn. by different methods. International Journal of Design & Nature and Ecodynamics, 17(5): 795-800. https://doi.org/10.18280/ijdne.170519
[8] Prameswari, D., Sudrajat, D.J., Lailaty, I.Q., et al. (2026). Breaking physical dormancy in Helicteres isora seeds: Integrating scarification, morphology, and phytochemical profiling to improve germination. International Journal of Design & Nature and Ecodynamics, 21(2): 375-388. https://doi.org/10.18280/ijdne.210207
[9] Hyder, Q.U.A., Aziz, A., Azhar, M.F., Haider, M.H., Hussain, N. (2026). Plant-derived biostimulants: Emerging trends, breakthroughs and challenges in 2024. Organic Agriculture, 16(1): 12. https://doi.org/10.1007/s13165-025-00534-4
[10] Abbad, Z., Rhebbar, F.Z., Mekaoui, F.Z., Tahiri, N.E.H., Bengueddour, R., Lrhorfi, L.A. (2024). The stimulating effect of plant extracts on tomato cultivation. Ecological Engineering & Environmental Technology, 25(11): 365-376. https://doi.org/10.12912/27197050/192899
[11] Ramírez-Pérez, C., Ramírez, H., Carrillo-Lomelí, D.A., et al. (2025). Biostimulant from semi-desert plant extracts for root and aerial growth of Capsicum annuum L. and C. chinense Jacq. seedlings. Industrial Crops and Products, 236: 121881. https://doi.org/10.1016/j.indcrop.2025.121881
[12] Han, M., Kasim, S., Yang, Z., et al. (2024). Plant extracts as biostimulant agents: A promising strategy for managing environmental stress in sustainable agriculture. Phyton, 93(9): 2149-2166. https://doi.org/10.32604/phyton.2024.054009
[13] Soln, K., Dolenc Koce, J. (2021). Allelopathic root inhibition and its mechanisms. Allelopathy Journal, 52(2): 181-198. https://doi.org/10.26651/allelo.j/2021-52-2-1315
[14] Tzortzakis, N., Chrysargyris, A. (2025). Alternative growing media under the same fertigation scheme affected mineral accumulation and physiological parameters in grapevine cultivars. Horticulturae, 11(5): 479. https://doi.org/10.3390/horticulturae11050479
[15] Radha, T.K., Ganeshamurthy, A.N., Mitra, D., Sharma, K., Rupa, T.R., Selvakumar, G. (2018). Feasibility of substituting cocopeat with rice husk and saw dust compost as a nursery medium for growing vegetable seedlings. The Bioscan, 13(2): 659-663.
[16] Djaenuddin, N., Sebayang, A., Nonci, N., Muis, A. (2021). Compatibility of biocontrol agent formulas and synthetic fungicides in controlling maydis leaf blight on corn caused by Bipolaris maydis. IOP Conference Series: Earth and Environmental Science, 911(1): 012062. https://doi.org/10.1088/1755-1315/911/1/012062
[17] Yan, X., Guo, S., Gao, K., Sun, S., Yin, C., Tian, Y. (2023). The impact of the soil survival of the pathogen of Fusarium wilt on soil nutrient cycling mediated by microorganisms. Microorganisms, 11(9): 2207. https://doi.org/10.3390/microorganisms11092207
[18] Song, X., Liang, H., Huang, R., Ke, C., Tao, B., Zhang, W. (2022). Mechanism underlying the response of fungi and their Fusarium symbiotic networks to the rotations of soybean and corn. Fungal Biology, 126(9): 609-619. https://doi.org/10.1016/j.funbio.2022.07.007
[19] Yan, L., Liu, S., Li, R., Li, Z., Piao, J., Zhou, R. (2024). Calcium enhanced the resistance against Phoma arachidicola by improving cell membrane stability and regulating reactive oxygen species metabolism in peanut. BMC Plant Biology, 24(1): 501. https://doi.org/10.1186/s12870-024-05222-1
[20] Bastakoti, S. (2023). Role of zinc in management of plant diseases: A review. Cogent Food & Agriculture, 9(1): 2194483. https://doi.org/10.1080/23311932.2023.2194483
[21] Sun, S., Yang, Z., Song, Z., et al. (2022). Silicon enhances plant resistance to Fusarium wilt by promoting antioxidant potential and photosynthetic capacity in cucumber (Cucumis sativus L.). Frontiers in Plant Science, 13: 1011859. https://doi.org/10.3389/fpls.2022.1011859
[22] BMKG Sumatera Selatan. (2026). Analisis parameter iklim. https://staklim-sumsel.bmkg.go.id/analisis-parameter-iklim/.
[23] Bunbury-Blanchette, A.L., Walker, A.K. (2019). Trichoderma species show biocontrol potential in dual culture and greenhouse bioassays against Fusarium basal rot of onion. Biological Control, 130: 127-135. https://doi.org/10.1016/j.biocontrol.2018.11.007
[24] Hadiwiyono, H., Sari, K., Poromarto, S.H. (2020). Yields losses caused by basal plate rot (Fusarium oxysporum f.sp. cepae) in some shallot varieties. Caraka Tani: Journal of Sustainable Agriculture, 35(2): 250. https://doi.org/10.20961/carakatani.v35i2.26916
[25] Samarth, R.M., Samarth, M., Matsumoto, Y. (2017). Medicinally important aromatic plants with radioprotective activity. Future Science OA, 3(4): FSO247. https://doi.org/10.4155/fsoa-2017-0061
[26] Muniandy, K., Gothai, S., Badran, K.M.H., Suresh Kumar, S., Esa, N.M., Arulselvan, P. (2018). Suppression of proinflammatory cytokines and mediators in LPS-induced RAW 264.7 macrophages by stem extract of Alternanthera sessilis via the inhibition of the NF-κB pathway. Journal of Immunology Research, 2018: 1-12. https://doi.org/10.1155/2018/3430684
[27] Odion, E.E., Elakhe, D.E., Ambe, D.A.E., Osigwe, C.C., Odiete, E.C. (2024). Profiling of phytochemicals in the leaves of Asystasia gangetica (L) T. Anderson using GC-MS and HPLC analysis. Journal of Nepal Chemical Society, 44(2): 23-32. https://doi.org/10.3126/jncs.v44i2.68299
[28] Nguyen, T. (2023). A review on bioactive compounds and pharmacological properties of Cleome rutidosperma DC: A review on Cleome rutidosperma. Journal of Tropical Life Science, 13(3): 615-624. https://doi.org/10.11594/jtls.13.03.20
[29] Kumar, S., Malhotra, R., Kumar, D. (2010). Euphorbia hirta: Its chemistry, traditional and medicinal uses, and pharmacological activities. Pharmacognosy Reviews, 4(7): 58-61. https://doi.org/10.4103/0973-7847.65327
[30] Pereira Feitosa, L.G., Monge, M., Lopes, N.P., Rodrigues de Oliveira, D.C. (2021). Distribution of flavonoids and other phenolics in Mikania species (Compositae) of Brazil. Biochemical Systematics and Ecology, 97: 104273. https://doi.org/10.1016/j.bse.2021.104273
[31] Jantan, I., Haque, M.A., Ilangkovan, M., Arshad, L. (2019). An insight into the modulatory effects and mechanisms of action of Phyllanthus species and their bioactive metabolites on the immune system. Frontiers in Pharmacology, 10: 878. https://doi.org/10.3389/fphar.2019.00878
[32] Trinh, P.T.N., Giang, B.L., Tuan, N.T., et al. (2019). Alfa glucosidase inhibitory, anti inflammatory activities and a new furanocoumarin derivative of Ruellia tuberosa. Natural Product Research, 35(22): 4248-4255. https://doi.org/10.1080/14786419.2019.1696790
[33] Chaves, O., Teles, Y., Monteiro, M., et al. (2017). Alkaloids and phenolic compounds from Sida rhombifolia L. (Malvaceae) and vasorelaxant activity of two indoquinoline alkaloids. Molecules, 22(1): 94. https://doi.org/10.3390/molecules22010094
[34] Hübner, H., Vierling, W., Brandt, W., Reiter, M., Achenbach, H. (2001). Minor constituents of Spigelia anthelmia and their cardiac activities. Phytochemistry, 57(2): 285-296. https://doi.org/10.1016/S0031-9422(01)00020-6
[35] WFO. (2026). World Flora Online. https://www.worldfloraonline.org/.
[36] Ishak, A.H., Shafie, N.H., Esa, N.M., Bahari, H. (2016). Nutritional, phytochemical and pharmacological properties of Mikania micrantha Kunth. Pertanika Journal of Scholarly Research Reviews, 2(3).
[37] Mehmood, A., Tanveer, A., Nadeem, M.A., Zahir, Z.A. (2014). Comparative allelopathic potential of metabolites of two Alternanthera species against germination and seedling growth of rice. Planta Daninha, 32(1): 1-10. https://doi.org/10.1590/s0100-83582014000100001
[38] Goncharov, A.A., van Capelle, C., Meyer-Wolfarth, F., Schrader, S. (2026). Soil type, texture and minimum temperature are key factors shaping the interaction of Fusarium species and soil saprophages in agroecosystems. Science of The Total Environment, 1031: 181807. https://doi.org/10.1016/j.scitotenv.2026.181807
[39] Orr, R., Nelson, P.N. (2018). Impacts of soil abiotic attributes on Fusarium wilt, focusing on bananas. Applied Soil Ecology, 132: 20-33. https://doi.org/10.1016/j.apsoil.2018.06.019
[40] Nathawat, B.D.S., Sharma, O.P., Kumari, M., Shivran, H. (2021). Effect of nutrients on wilt in chickpea. Legume Research. https://doi.org/10.18805/lr-4490
[41] Malacaria, L., Bijlsma, J., Hilgers, R., de Bruijn, W.J.C., Vincken, J.-P., Furia, E. (2023). Insights into the complexation and oxidation of quercetin and luteolin in aqueous solutions in presence of selected metal cations. Journal of Molecular Liquids, 369: 120840. https://doi.org/10.1016/j.molliq.2022.120840
[42] Elleuch, J., Ben Amor, F., Chaaben, Z., et al. (2021). Zinc biosorption by Dunaliella sp. AL-1: Mechanism and effects on cell metabolism. Science of The Total Environment, 773: 145024. https://doi.org/10.1016/j.scitotenv.2021.145024
[43] Yuan, X., Hua, Y., Chen, S., et al. (2024). Sludge-derived biostimulants promote glycosylation of tricin and luteolin in the flavone and flavonol biosynthesis to enhance anti-inflammatory activities of rice. Environmental Research, 263: 120133. https://doi.org/10.1016/j.envres.2024.120133
[44] Wang, R., Wang, Y., Hu, Y., Dang, T., Guo, S. (2021). Divergent responses of tiller and grain yield to fertilization and fallow precipitation: Insights from a 28-year long-term experiment in a semiarid winter wheat system. Journal of Integrative Agriculture, 20(11): 3003-3011. https://doi.org/10.1016/s2095-3119(20)63296-8
[45] Lin, C., Hang, T., Jiang, C., Yang, P., Zhou, M. (2023). Effects of different phosphorus levels on tiller bud development in hydroponic Phyllostachys edulis seedlings. Tree Physiology, 43(8): 1416-1431. https://doi.org/10.1093/treephys/tpad055
[46] Xu, X.R., Dong, Y., Fu, W.G. (2024). Effect of phenolic acid allelochemicals on nutrient supply capacity of rhizosphere soil. Journal of Ecology and Rural Environment, 40(10): 1358-1365. https://doi.org/10.19741/j.issn.1673-4831.2023.0959
[47] Lee, C.D., Lwin, H.P., Uy, N.P., Lee, J., Lee, S. (2025). Bulb size influences the quality and bioactive compound contents in cold-stored onion (Allium cepa L.) peels. Journal of Stored Products Research, 112: 102629. https://doi.org/10.1016/j.jspr.2025.102629
[48] El-Jaoual, T., Cox, D.A. (1998). Manganese toxicity in plants. Journal of Plant Nutrition, 21(2): 353-386. https://doi.org/10.1080/01904169809365409
[49] Coelho, A., Andréia Cavalari, A., Haddad, P., do Nascimento, A.N. (2025). Nanofertilizers for enhancing food production: A case study on microgreens enrichment using superparamagnetic iron oxide nanoparticles (SPIONs). Food Chemistry, 463: 141364. https://doi.org/10.1016/j.foodchem.2024.141364
[50] Mukarram, M., Ahmad, B., Choudhary, S., et al. (2024). Silicon nanoparticles vs trace elements toxicity: Modus operandi and its omics bases. Frontiers in Plant Science, 15: 1377964. https://doi.org/10.3389/fpls.2024.1377964