Esraa Hussein Mohammed* | Faris A. Al-Wazzan
© 2026 The authors. This article is published by IIETA and is licensed under the CC BY 4.0 license (http://creativecommons.org/licenses/by/4.0/).
OPEN ACCESS
Undisturbed surface soil samples were collected from two locations in Nineveh Governorate, northern Iraq. Site 1 exhibited a clay texture, while Site 2 was classified as silty clay loam. Soils were transferred to 8 kg experimental pots and prepared for chickpea cultivation. Natural zeolite was applied at 1% and 2% (w/w) to evaluate its effects on soil physical and hydraulic properties during the 2024–2025 growing season under three levels of available water (25%, 50%, and 75%) across both textures. The study aimed to quantify the effect of zeolite on soil hydraulic and plasticity parameters under moisture stress and varying clay fractions. A randomized complete block design (RCBD) was employed. Results indicated that zeolite significantly affected both the liquid limits (LL) and plastic limits (PL), with the 2% application rate generally producing the highest values. Among irrigation levels, the 75% available-water treatment produced more consistent improvements in soil plasticity across both sites, although the magnitude of the response varied with soil texture. The higher clay content at Site 1 resulted in a more pronounced increase in plasticity index (PI) compared to Site 2. Overall, the 2% zeolite treatment showed more consistent improvements in soil moisture retention and had favorable effects depending on soil texture, indicating improved soil physical conditions under water stress.
clay activity, hydraulic properties, liquid limit, plastic limit, plasticity index, water stress, zeolite
Zeolites are highly crystalline aluminosilicate minerals belonging to the silica group, characterized by a three-dimensional framework interconnected through shared oxygen tetrahedra and containing water-filled channels [1, 2], demonstrated that ion exchange processes in zeolite or governed by several factors, including the concentration and type of anions and cations, solution pH, and the mineral's crystalline architecture. Cation attraction strength increases with higher valence. For ions of equal valence, the hydrated radius determines binding affinity. Zeolites are cost-effective, widely available, and possess a high cation exchange capacity (CEC) with excellent structural stability even under acidic conditions, making them highly effective for heavy metal immobilization [3].
Chickpea Cicer arietinum L. is a vital cool-season legume characterized by a moderate growth cycle in relatively low water demand. It ranks second globally among legumes in economic importance and serves as a crucial source of plant-based protein [4]. Like other field crops, chickpea cultivation is highly sensitive to prevailing climatic conditions and soil physical and hydraulic properties [5, 6]. Zeolites exhibit a high CEC typically ranging from 100 to 200 cmolc kg-1, along with superior water retention capacity and ion exchange potential [7]. Bhattacharyya et al. [8] reported that natural zeolite minerals possessed distinctive physical properties, including increased effective porosity, reduced bulk density, and a high CEC ranging from 150 to 250 cmolc kg-1 [9], a tribute to this high exchange capacity to the unique silicate framework of zeolites, which features open cavity structures filled with water molecules and exchangeable cations.
The application of natural soil amendments and organic fertilizers improved soil physical and chemical fertility characteristics, creating a favorable environment for plant growth by enhancing moisture retention and nutrient availability. Zeolite has garnered significant attention as a soil conditioner widely used in agriculture to ameliorate soil properties, remediate contaminated soils, regulate soil pH, and improve fertilizer efficiency [10]. Noori et al. [11] demonstrated that natural zeolite application in sailing soils improves soil properties and increases crop yields by reducing electrical conductivity (EC) through the sequestration of salt-inducing ions away from the root zone. Additionally, zeolite enhances soil nutrient content, particularly ammonium and potassium, due to its structural capacity to retain and gradually release cations to plants, thereby reducing fertilizer requirements and prolonging nutrient availability.
Zeolite also influences soil plasticity and liquidity limits, aiding in soil reclamation by reducing the plasticity index (PI) among clay particles [12]. By modifying Atterberg limits, zeolite prevents soil compaction around germinating seeds, protects roots from waterlogging induced Decay its poorest structure ensures uniform moisture distribution [10]. As the primary medium for crop growth, soil physical properties—particularly plasticity—play a critical role in root penetration and nutrient uptake. Zeolite modifies plasticity by shifting adverb limits, raising both the liquid limit (LL) and plastic limit (PL) in heavy clay soils. This extends the moisture range over which the soil remains cohesive and workable, reducing sudden drying and improving the texture of chickpea crop soils, which are typically clay to silty clay loams [13, 14]. Furthermore, zeolite reduces excessive plasticity in wet soils, enhancing root aeration and oxygen diffusion to nodules responsible for biological nitrogen fixation. Zeolite-amended soils exhibit lower mechanical resistance, facilitating deeper taproot penetration to access subsoil moisture [15]. Studies indicate that adding 5–10% zeolite by soil weight significantly reduces the PI and enhances soil tolerance to mechanical stress from agricultural machinery.
Although numerous studies have investigated the effects of zeolite on soil physical and chemical properties, most of them have focused on either hydraulic behavior or nutrient retention separately, with limited integration of soil plasticity characteristics. In particular, the combined influence of zeolite application rate, irrigation regime, and contrasting soil textures on Atterberg limits and soil hydraulic properties remains insufficiently understood, especially under field-relevant moisture stress conditions.
Furthermore, previous research has rarely linked changes in soil plasticity indices (LL, PL, and PI) with hydraulic conductivity and water retention behavior within a unified experimental framework. This is important because soil texture strongly controls zeolite effectiveness, while irrigation level determines moisture-driven structural changes in clay systems.
Therefore, this study integrates zeolite rate, irrigation level, and soil texture to evaluate their combined effects on soil hydraulic properties and Atterberg limits under controlled pot conditions. The main contribution of this work is providing a more comprehensive understanding of how zeolite modifies both soil water dynamics and plasticity behavior, which is essential for improving soil management strategies in semi-arid environments for chickpea cultivation.
2.1 Soil chemical analyses
Chemical analyses were conducted on soil samples from both study sites and all experimental treatments EC and soil pH were measured in a one to one soil to water extract using a Sony ST740 PH meter, following research [16], dissolved ions in soil extracts were quantified as follows calcium and magnesium were determined by titration with 0.01 N EDTA (di- Na- salt) using ammonium per puree as the indicator for calcium and Eriochrome Black T for calcium + magnesium with pH adjustment for each measurement [17]. Sodium and potassium were measured using a PFP7 JENWAY flame photometer calibrated with standard Solutions as described by Asch et al. [18]. Carbonates and bicarbonates were titrated with 0.01 N sulfuric acid, using phenolphthalein for carbonates and methyl orange for bicarbonates. Chlorides were determined by titration with 0.01 N silver nitrate (AgNO3) using potassium chromate (K₂CrO₄) as the indicator [18]. Sulfate concentrations were calculated by the difference between the sum of cation and anion equivalence [19]. The CEC was determined using 1 M sodium acetate (pH 8.2), with sodium quantified via flame photometry [20]. Total calcium carbonate was estimated by reaction with 1 N hydrochloric acid, and the excess acid was back-titrated with 0.5 N sodium hydroxide using phenolphthalein as the indicator [21].
2.2 Particle size distribution
Particle size distribution was determined using the hydrometer method for soil samples from both sites, following research [22].
2.3 Bulk density measurement
Undisturbed soil samples were collected in the field using metal cylinders (4.6 cm diameter × 5 cm height) as described by Klute [23]. Bulk density (ρb) was calculated using Eq. (1):
$\rho b=M s / V t$ (1)
where,
ρb = Bulk density (Mg m⁻³)
Ms = Mass of oven-dry soil solids (g)
Vt = Total volume of soil sample (cm³)
2.4 Experimental design and treatments
The experiment included 18 pots and was arranged in a randomized complete block design (RCBD) with three treatments. The first factor was soil texture, where two different textures were used: clay soil and silty clay loam soil. The second factor was zeolite application, which was added at three levels (0, 1, and 2)%. The third factor was irrigation level, where three irrigation regimes were applied (25, 50, and 75)% of available water.
2.5 Planting and fertilization
Chickpea (Cicer arietinum L.) seeds of the Azizi variety were planted at a uniform depth, with 7 seeds planted in each pot. The seeds were planted on February 15, 2025, and harvested on May 28, 2025. Three types of fertilizer were used for each pot: urea fertilizer, triple superphosphate fertilizer, and potassium sulfate fertilizer, at application rates of 0.304, 0.622, and 0.269 grams per pot.
2.6 Irrigation regimes and soil moisture control
Soil moisture levels were maintained gravimetrically by weighing pots and replenishing water to the target percentage of available water capacity. Evaporation losses were minimized by maintaining uniform environmental conditions throughout the experiment.
2.7 Total porosity
Total porosity was calculated using Eq. (2):
Total porosity (%) = [1 – (ρb / ρs)] × 100 (2)
where, ρs = particle density (assumed 2.65 Mg m⁻³ for mineral soils).
2.8 Saturated hydraulic conductivity
Saturated hydraulic conductivity (Ks) was measured post-harvest using the falling-head method on undisturbed cores (10 cm diameter × 10 cm height), following research [23]. Ks was calculated using Eq. (3):
Ks = (aL / At) · ln(H₁/H₂) (3)
where,
Ks = Saturated hydraulic conductivity (cm s⁻¹)
a = Cross-sectional area of the water column (cm²)
L = Length of the soil column (cm)
A = Cross-sectional area of the soil column (cm²)
t = Time (s)
H₁ = Initial water head height above the outflow point (cm)
H₂ = Final water head height above the outflow point (cm)
2.9 Atterberg limits and clay activity
The LL was determined for all field-collected and post-harvest pot samples using a standard Casagrande apparatus, following [24]. The PL was determined by rolling soil pastes into 3 mm diameter threads until they crumbled, as per research [24]. The PI was calculated as:
PI = LL – PL (4)
Clay activity (CA) was calculated as the ratio of PI to the percentage of clay content [24]:
CA = PI / % Clay (5)
These parameters were used to evaluate clay behavior in relation to soil moisture and salinity.
The experiment followed an RCBD with three irrigation levels (25%, 50%, and 75% of available water capacity), two zeolite rates (0%, 1%, 2%), and two soil textures.
2.10 Rationale for selected indicators
The selected soil physicochemical and hydraulic parameters were chosen to comprehensively evaluate the influence of zeolite application under different irrigation regimes and soil textures on chickpea production systems. Parameters such as pH, EC, and CEC were included to assess changes in the soil chemical environment and nutrient retention capacity, while bulk density and porosity were used to evaluate soil structural modifications. Saturated hydraulic conductivity (Ks) was measured to determine water movement and availability under varying treatments. In addition, Atterberg limits (LL, PL, and PI) were included as key indicators of soil plasticity and workability, which directly influence root penetration and soil mechanical behavior. Together, these indicators provide an integrated framework for understanding how zeolite affects both soil physical conditions and water dynamics in semi-arid environments relevant to chickpea cultivation.
2.11 Statistical analysis
Data were analyzed using a three-way analysis of variance (ANOVA) to evaluate the effects of soil type, zeolite application rate, and irrigation level, and their interactions. Means were compared using a least significant difference (LSD) test at a probability level of p ≤ 0.05. Statistical analysis was performed using statistical software (SPSS).
3.1 Chemical properties
Table 1 presents the chemical characteristics of the studied soils. Soil pH across all treatments and sites ranged from 7.1 to 7.9, indicating neutral conditions. EC values showed significant variation. At site one (clay texture), EC values were 1.55, 1.27, and 1.73 dS m-1 at 25%, 50%, and 75% of available water, respectively, in the control treatment. These values increased to 1.59, 2.07, and 1.75 dS m-1 with 1% zeolite application, attributable to the release of exchangeable cations from the aluminosilicate structure. The 2% zeolite treatment further elevated EC to 1.99, 2.24, and 2.29 dS m-1 under the same irrigation levels, demonstrating a direct positive correlation between zeolite application rate and EC. This aligns with findings by Chourasia et al. [25] at site 2 (silty clay loam); zeolite Application induced a more pronounced EC increase. Control EC values were 2.39, 2.25, and 2.42 dS m⁻¹ for the three irrigation levels, rising to 3.68, 3.52, and 3.16 dS m⁻¹ with 1% zeolite, and peaking at 3.72, 3.80, and 3.91 dS m⁻¹ with 2% zeolite. This confirms zeolite’s direct impact on soil chemical properties, particularly EC, in medium-textured soils compared to fine-textured soils.
Table 1. Selected chemical properties of the studied soils under different zeolite and irrigation treatments
|
Treatment |
pH ± SD |
EC (dS m⁻¹) ± SD |
K⁺ (mmolc L⁻¹) ± SD |
Na⁺ (mmolc L⁻¹) ± SD |
Ca²⁺ (mmolc L⁻¹) ± SD |
Mg²⁺ (mmolc L⁻¹) ± SD |
Cl⁻ (mmolc L⁻¹) ± SD |
HCO₃⁻ (mmolc L⁻¹) ± SD |
SO₄²⁻ (mmolc L⁻¹) ± SD |
Total Carbonates (g kg⁻¹) ± SD |
CEC (cmolc kg⁻¹) ± SD |
|
T1Z0I25 |
7.6 ± 0.46 abc |
1.55 ± 0.035 i |
0.171 ± 0.02 de |
0.204 ± 0.013 g |
9.4 ± 0.025 ef |
4.5 ± 0.48 c |
1.2 ± 0.016 cd |
4 ± 0.64 d |
9.02 ± 2.80 efg |
305 ± 31.23 a |
19.21 ± 3.28 ab |
|
T1Z0I50 |
7.7 ± 0.81 ab |
1.27 ± 0.026 j |
0.171 ± 0.025 de |
0.204 ± 0.035 g |
7.2 ± 0.039 fg |
4.5 ± 0.07 c |
1.0 ± 0.013 d |
5.5 ± 0.84 bcd |
4.70 ± 0.62 g |
295 ± 26.46 a |
21.13 ± 2.61 ab |
|
T1Z0I75 |
7.8 ± 0.27 ab |
1.73 ± 0.07 ij |
0.245 ± 0.014 abc |
0.449 ± 0.025 f |
10.4 ± 0.052 ef |
6.0 ± 1.52 c |
1.4 ± 0.015 bcd |
5.5 ± 1.39 bcd |
10.5 ± 3.04 efg |
290 ± 22.91 a |
22.47 ± 3.53 ab |
|
T1Z1I25 |
7.5 ± 0.05 abcd |
1.59 ± 0.031 hi |
0.294 ± 0.019 a |
0.204 ± 0.022 g |
9.0 ± 0.039 ef |
5.0 ± 0.98 c |
1.6 ± 0.095 abcd |
8 ± 2.29 abcd |
4.79 ± 0.89 g |
305 ± 32.79 a |
23.78 ± 3.90 ab |
|
T1Z1I50 |
7.6 ± 0.12 abc |
2.07 ± 0.056 fg |
0.270 ± 0.022 ab |
0.245 ± 0.026 g |
11.0 ± 0.017 def |
8.0 ± 1.80 bc |
1.4 ± 0.085 bcd |
5.5 ± 1.32 bcd |
12.51 ± 3.28 defg |
285 ± 26.46 a |
24.82 ± 4.36 ab |
|
T1Z1I75 |
7.7 ± 0.11 abc |
1.75 ± 0.044 h |
0.270 ± 0.03 ab |
0.286 ± 0.026 g |
11.0 ± 0.022 def |
6.0 ± 1.32 c |
2.4 ± 1.15 abcd |
4.5 ± 1.06 cd |
10.55 ± 2.91 gef |
280 ± 15.00 a |
25.11 ± 3.04 ab |
|
T1Z2I25 |
7.1 ± 0.08 d |
1.99 ± 0.09 g |
0.147 ± 0.028 e |
0.449 ± 0.022 f |
10.4 ± 2.21 e |
8.0 ± 2.03 bc |
1.0 ± 0.03 d |
5.5 ± 0.70 bcd |
12.40 ± 3.60 defg |
300 ± 27.84 a |
27.52 ± 4.58 ab |
|
T1Z2I50 |
7.4 ± 0.09 bcd |
2.24 ± 0.074 fe |
0.196 ± 0.03 cde |
0.245 ± 0.026 g |
12.2 ± 2.19 cdef |
9.7 ± 1.61 abc |
1.2 ± 0.018 cd |
5.5 ± 1.73 bcd |
15.54 ± 3.50 bcdef |
288 ± 25.24 a |
30.50 ± 4.58 ab |
|
T1Z2I75 |
7.2 ± 0.18 cd |
2.29 ± 0.062 e |
0.196 ± 0.019 cde |
0.245 ± 0.030 g |
13.4 ± 2.62 bcdef |
7.6 ± 1.04 bc |
1.4 ± 0.065 bcd |
5.0 ± 0.84 bcd |
15.01 ± 3.78 cdef |
280 ± 24.50 a |
31.65 ± 5.29 ab |
|
T2Z0I25 |
7.9 ± 0.07 a |
2.39 ± 0.037 e |
0.245 ± 0.026 abc |
0.572 ± 0.025 d |
11.5 ± 1.90 def |
10.5 ± 2.29 abc |
1.6 ± 0.035 abcd |
11.5 ± 2.78 ab |
9.61 ± 2.49 efg |
275 ± 23.26 a |
12.30 ± 21.98 a |
|
T2Z0I50 |
7.9 ± 0.06 a |
2.25 ± 0.04 fe |
0.245 ± 0.021 abc |
0.531 ± 0.026 de |
10.8 ± 2.08 def |
10.0 ± 1.61 abc |
1.8 ± 0.033 abcd |
10.4 ± 3.28 abcd |
9.17 ± 1.91 efg |
250 ± 25.24 a |
14.19 ± 3.47 ab |
|
T2Z0I75 |
7.9 ± 0.05 ab |
2.42 ± 0.041 e |
0.245 ± 0.018 abc |
0.449 ± 0.029 ef |
12.2 ± 0.28 cdef |
11.0 ± 2.56 abc |
2.2 ± 1.15 abcd |
14.0 ± 3.61 a |
7.59 ± 1.32 fg |
230 ± 26.10 a |
14.96 ± 3.90 ab |
|
T2Z1I25 |
7.9 ± 0.05 ab |
3.68 ± 0.046 bc |
0.220 ± 0.028 bcd |
1.103 ± 0.025 c |
17.4 ± 4.37 abcd |
16.0 ± 2.96 a |
2.0 ± 0.53 abcd |
11.5 ± 3.04 ab |
21.10 ± 4.27 abcd |
275 ± 29.51 a |
18.15 ± 3.64 ab |
|
T2Z1I50 |
7.9 ± 0.11 ab |
3.52 ± 0.028 c |
0.245 ± 0.02 abc |
1.144 ± 0.027 bc |
18.8 ± 3.22 abc |
15.0 ± 3.54 bc |
3.6 ± 1.38 a |
10.5 ± 2.91 abcd |
21.02 ± 3.28 defg |
250 ± 27.88 a |
19.86 ± 4.30 ab |
|
T2Z1I75 |
7.8 ± 0.12 ab |
3.16 ± 0.027 b |
0.220 ± 0.013 bcd |
0.572 ± 0.02 d |
14.5 ± 2.86 abcde |
16.0 ± 3.61 a |
2.0 ± 0.031 abcd |
10.5 ± 3.28 abcd |
18.69 ± 3.12 abcde |
243 ± 28.62 a |
20.65 ± 3.64 ab |
|
T2Z2I25 |
7.9 ± 0.08 a |
3.72 ± 0.083 b |
0.220 ± 0.012 bcd |
1.226 ± 0.034 b |
19.1 ± 3.40 ab |
15.7 ± 2.91 a |
3.2 ± 1.11 abc |
10.5 ± 2.18 abcd |
22.44 ± 5.29 abc |
275 ± 28.00 a |
26.52 ± 4.39 ab |
|
T2Z2I50 |
7.8 ± 0.11 ab |
3.80 ± 0.096 ab |
0.147 ± 0.024 e |
0.531 ± 0.031 bc |
20.6 ± 0.50 d |
16.0 ± 3.21 a |
3.4 ± 1.45 a |
5.5 ± 1.67 bcd |
28.27 ± 3.60 a |
275 ± 28.62 a |
31.00 ± 4.50 ab |
|
T2Z2I75 |
7.8 ± 0.09 ab |
3.91 ± 0.12 a |
0.220 ± 0.026 bcd |
1.307 ± 0.025 a |
21.0 ± 4.01 a |
17.0 ± 4.72 a |
3.2 ± 0.85 abc |
11.0 ± 2.91 abc |
25.22 ± 4.10 a |
275 ± 29.51 a |
32.26 ± 4.98 a |
|
Clay (Pre) |
7.6 |
0.27 |
0.098 |
0.122 |
1.2 |
1.28 |
0.4 |
6.5 |
4.20 |
305 |
20.45 |
|
SCL (Pre) |
7.9 |
1.27 |
0.171 |
0.408 |
6.2 |
5.3 |
1.2 |
12.5 |
1.60 |
277 |
15.62 |
The elevated EC values observed in Site 2 under zeolite treatments exceeded 3.5 dS m⁻¹, indicating a potential shift toward mild salinity conditions. Although zeolite contributed to increased cation retention, the accumulation of soluble salts under limited leaching conditions may have contributed to higher EC levels. Such salinity levels could influence osmotic potential and should be considered when interpreting crop response under silty clay loam soil conditions.
It is important to note that the observed effects of the 2% zeolite application, particularly the increase in EC (up to 3.91 dS m⁻¹ at Site 2), are strongly dependent on soil texture and irrigation regime. Therefore, these results should not be generalized across all soil conditions. The response of zeolite is more pronounced in fine- to medium-textured soils under limited leaching conditions, where salt accumulation may occur. Consequently, the applicability of higher zeolite rates should be carefully considered in relation to soil drainage characteristics and irrigation management practices to avoid potential salinity-related constraints.
Total carbonate content ranged from 277 to 305 g kg⁻¹ pre-planting at Sites 2 and 1, respectively. Post-planting carbonate levels decreased with higher irrigation frequencies due to leaching of surface carbonates to deeper soil layers. Zeolite application did not directly alter total carbonate content; changes were primarily driven by irrigation volume. The highest cation–anion concentrations were observed in the silty clay loam soil treated with 1% and 2% zeolite, particularly in treatment T2Z2I75, where EC reached 3.91 dS m⁻¹ and Na⁺ concentration peaked at 1.307 mmolc L⁻¹.
Zeolite significantly enhanced CEC due to its high specific surface area and permanent negative charge within its crystalline lattice. This effect was most pronounced in soils with low initial clay and organic matter content, where zeolite effectively retains Ca+2, Mg+2, and K-1, minimizing leaching losses under irrigation. The CEC improvement was more evident in the silty clay loam soil (40% clay), then in the clay soil 952.5%c clay), confirming that clits conditioning effect is more impactful in Corsair textured soils CEC values in the control silty clay loam ranged from 12.30 to 14.96 cmolc kg-1, increasing to 18.15 to 20.65 cmolc kg-1, with 1% zeolite and reaching 26.52 to 32.26 cmolc kg-1 with (2% zeolite). Similarly, Site 1 showed CEC increases from baseline levels to 23.78 to 25.11 cmolc kg-1 (1% zeolite) and 27.52 to 31.65 cmolc kg-1 (2% zeolite). These results align with Satriani et al. [26], who reported greater zeolite efficacy in sandian lomi soils compared to heavy clays.
3.2 Physical properties
Table 2 summarizes soil physical properties. Site 1 contained 525 g/kg clay, classifying it as a clay texture, with an initial volume metric water content of 0.20 cm3 cm-3, bulk density of 1.37 Mg m-³, and total porosity of 48.30%. Site 2 contains 400 g kg-1 clay, 425 g kg-1 silt, and 175 g kg-1 sand, classifying it as silty clay loam, along with an initial water content of 0.175 cm3 cm-3, a density of 1.11 Mg m-3, and a porosity of 58.11%. These textural differences provided a robust framework for evaluating zeolite effects under varying moisture regimes.
Table 2. Initial physical properties of the studied soils
|
Location |
Clay (g kg⁻¹) |
Silt (g kg⁻¹) |
Sand (g kg⁻¹) |
Bulk Density (Mg m⁻³) |
Total Porosity (%) |
Initial Vol. Water Content (cm³ cm⁻³) |
Soil Texture |
|
Site 1 |
525 |
375 |
100 |
1.37 |
48.30 |
0.200 |
Clay |
|
Site 2 |
400 |
425 |
175 |
1.11 |
58.11 |
0.175 |
Silty Clay Loam |
3.3 Saturated hydraulic conductivity
Table 3 presents Ks values. In Site 1 (clay), control Ks values ranged from 1.08 to 1.36 cm h⁻¹. The 1% zeolite treatment increased Ks to 1.13–1.55 cm h⁻¹, while 2% zeolite further elevated it to 1.37–1.96 cm h⁻¹. This enhancement is attributed to zeolite’s ability to increase effective macro- and microporosity, facilitating faster water movement. These findings agree with Liliya et al. [27], who reported that soil amendments generally increase Ks in clay soils.
Table 3. Saturated hydraulic conductivity (Ks) for all treatments
|
Site 1 Treatments |
Ks (cm h⁻¹) ± SD |
Clay (g kg⁻¹) ± SD |
Site 2 Treatments |
Ks (cm h⁻¹) ± SD |
Clay (g kg⁻¹) ± SD |
|
T1Z0I25 |
1.08 ± 0.087 b |
525 ± 35.00 a |
T2Z0I25 |
2.09 ± 0.17 ab |
400 ± 40.93 b |
|
T1Z0I50 |
1.25 ± 0.61 ab |
525 ± 32.79 a |
T2Z0I50 |
2.13 ± 0.41 ab |
400 ± 36.66 b |
|
T1Z0I75 |
1.36 ± 0.18 ab |
525 ± 30.16 a |
T2Z0I75 |
2.20 ± 0.48 a |
400 ± 42.23 b |
|
T1Z1I25 |
1.13 ± 0.14 ab |
525 ± 32.42 a |
T2Z1I25 |
1.88 ± 0.50 ab |
400 ± 36.60 b |
|
T1Z1I50 |
1.34 ± 0.18 ab |
525 ± 33.15 a |
T2Z1I50 |
1.91 ± 0.38 ab |
400 ± 35.00 b |
|
T1Z1I75 |
1.55 ± 0.34 ab |
525 ± 35.55 a |
T2Z1I75 |
1.96 ± 0.51 ab |
400 ± 39.69 b |
|
T1Z2I25 |
1.37 ± 0.19 ab |
525 ± 35.68 a |
T2Z2I25 |
1.68 ± 0.41 ab |
400 ± 26.46 b |
|
T1Z2I50 |
1.62 ± 0.38 ab |
525 ± 37.64 a |
T2Z2I50 |
1.72 ± 0.38 ab |
400 ± 27.84 b |
|
T1Z2I75 |
1.96 ± 0.32 ab |
525 ± 32.79 a |
T2Z2I75 |
1.80 ± 0.27 ab |
400 ± 31.23 b |
|
Pre-planting |
1.09 |
- |
Pre-planting
|
2.05
|
-
|
Conversely, in Site 2 (silty clay loam), control Ks values were higher (2.09–2.20 cm h⁻¹) due to larger pore networks from silt and sand fractions. Zeolite application reduced Ks to 1.88–1.96 cm h⁻¹ (1%) and 1.68–1.80 cm h⁻¹ (2%). This reduction reflects improved water retention and optimized pore size distribution, confirming zeolite’s efficacy as a moisture-conserving amendment in medium-textured soils, consistent with research [28].
The opposite response of saturated hydraulic conductivity (Ks) between the two soil textures can be attributed to differences in pore size distribution and soil structural characteristics. In clay soil, zeolite application enhanced soil aggregation and promoted the formation of stable macropores, which increased water transmission. In contrast, in silty clay loam soil, zeolite particles likely occupied part of the larger pore spaces and reduced pore continuity, resulting in decreased hydraulic conductivity while improving water retention capacity, indicating that the effect of zeolite on hydraulic properties is strongly dependent on soil texture.
Unlike previous studies conducted on sandy soils where zeolite reduced Ks due to pore clogging, the present study observed an increase in clay soil, which may be attributed to improved aggregation and formation of stable macropores.
3.4 Atterberg limits and clay activity
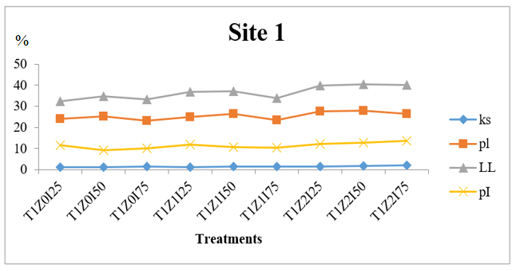
Table 4 details LL, PL, PI, and CA. In Site 1 (Figure 1), PL ranged from 23.0 to 27.8%, and LL from 32.5 to 40.5%, with PI values between 8.5 and 13.5. The 2% zeolite treatment generally yielded the highest limits and PI, indicating enhanced water retention and soil workability. Higher irrigation (75%) slightly reduced LL and PL, likely due to downward migration of fine clay particles under prolonged wetting, altering surface texture [29].
Table 4. Atterberg limits, plasticity index (PI), and clay activity (CA) for all treatments
|
Treatment |
Clay (%) |
PL (%) |
LL (%) |
PI |
Clay Activity |
|
Site 1 (Pre) |
52.5 |
17.6 |
25.2 |
7.6 |
0.144 |
|
T1Z0I25 |
52.5 ± 35.00 a |
24.0 ± 4.36 a |
32.5 ± 4.19 ab |
8.5 ± 2.79 a |
0.219 ± 0.03 abc |
|
T1Z0I50 |
52.5 ± 32.79 a |
25.3 ± 3.12 a |
34.6 ± 4.81 ab |
9.3 ± 1.91 a |
0.177 ± 0.03 bc |
|
T1Z0I75 |
52.5 ± 30.16 a |
23.0 ± 3.97 a |
33.2 ± 3.06 ab |
10.2 ± 2.36 a |
0.194 ± 0.03 abc |
|
T1Z1I25 |
52.5 ± 3.24 a |
25.0 ± 4.69 a |
36.8 ± 4.45 ab |
11.8 ± 2.23 a |
0.225 ± 0.08 abc |
|
T1Z1I50 |
52.5 ± 3.32 a |
26.5 ± 3.78 a |
37.2 ± 4.36 ab |
10.7 ± 2.21 a |
0.204 ± 0.04 abc |
|
T1Z1I75 |
52.5 ± 3.56 a |
23.4 ± 3.61 a |
33.7 ± 3.86 ab |
10.3 ± 2.17 a |
0.196 ± 0.03 abc |
|
T1Z2I25 |
52.5 ± 3.57 a |
27.6 ± 4.12 a |
39.8 ± 5.41 a |
12.2 ± 2.75 a |
0.232 ± 0.04 abc |
|
T1Z2I50 |
52.5 ± 3.76 a |
27.8 ± 4.10 a |
40.5 ± 4.77 a |
12.7 ± 2.65 a |
0.242 ± 0.05 abc |
|
T1Z2I75 |
52.5 ± 3.28 a |
26.5 ± 3.28 a |
40.0 ± 5.70 a |
13.5 ± 3.61 a |
0.257 ± 0.04 abc |
|
Site 2 (Pre) |
40.0 |
20.8 |
30.8 |
10.0 |
0.250 |
|
T2Z0I25 |
40.0 ± 4.09 b |
21.0 ± 3.47 a |
30.1 ± 3.72 ab |
9.1 ± 1.65 a |
0.228 ± 0.03 abc |
|
T2Z0I50 |
40.0 ± 3.67 b |
22.1 ± 2.78 a |
31.0 ± 3.58 ab |
8.9 ± 1.31 a |
0.223 ± 0.03 abc |
|
T2Z0I75 |
40.0 ± 4.22 b |
20.3 ± 3.16 a |
29.8 ± 3.90 ab |
8.5 ± 1.47 a |
0.213 ± 0.02 abc |
|
T2Z1I25 |
40.0 ± 3.66 b |
21.9 ± 2.26 a |
31.3 ± 2.57 ab |
9.4 ± 2.75 a |
0.235 ± 0.04 abc |
|
T2Z1I50 |
40.0 ± 3.50 b |
23.0 ± 3.12 a |
33.0 ± 4.10 ab |
10.0 ± 2.93 a |
0.250 ± 0.04 abc |
|
T2Z1I75 |
40.0 ± 3.79 b |
22.8 ± 3.34 a |
36.7 ± 4.34 ab |
13.9 ± 2.26 a |
0.348 ± 0.1 abc |
|
T2Z2I25 |
40.0 ± 2.65 b |
24.3 ± 2.65 a |
36.0 ± 3.61 ab |
11.7 ± 3.46 a |
0.293 ± 0.06 abc |
|
T2Z2I50 |
40.0 ± 2.78 b |
25.0 ± 4.10 a |
36.0 ± 5.29 ab |
12.0 ± 3.42 a |
0.300 ± 0.08 abc |
|
T2Z2I75 |
40.0 ± 3.12 b |
23.4 ± 3.74 a |
37.5 ± 4.44 ab
|
14.1 ± 4.01 a
|
0.353 ± 0.13 a
|
Figure 1. The change in the values of Ks, plastic limit (PL), liquid limit (LL), and plasticity index (PI) according to the experimental parameters at Site 1
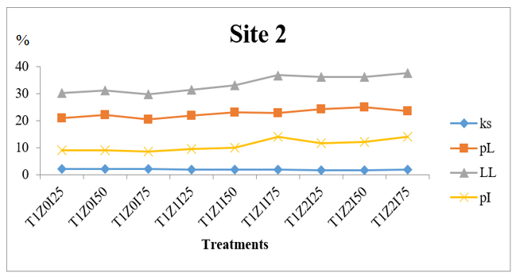
In Site 2 (Figure 2), lower clay content resulted in reduced LL (29.8–37.5%) and PL (20.3–25.0%). In Site 2, 2% zeolite increased PI across irrigation levels (e.g., from 9.1 to 11.7 at I25, from 8.9 to 12.0 at I50, and from 8.5 to 14.1 at I75), indicating improved moisture-related consistency. The enhanced PI and CA under zeolite treatment reflect improved aggregate stability and reduced susceptibility to structural degradation under water stress. These findings align with Ferretti et al. [30], who emphasized zeolite’s role in sustaining soil moisture during dry periods.
Figure 2. The change in the values of Ks, plastic limit (PL), liquid limit (LL), and plasticity index (PI) according to the experimental parameters at Site 2
While increases in PL and LL indicate improved moisture retention, the interpretation of PI is context-dependent. Higher PI values may reflect improved soil cohesion and structural stability under certain conditions; however, excessively high PI can also indicate increased plastic behavior and reduced workability when soils are wet. Therefore, the beneficial effect of zeolite on PI should be interpreted in relation to soil texture, irrigation level, and field trafficability rather than as an absolute improvement.
The findings of this study extend beyond the description of soil physical and hydraulic changes and provide important implications for sustainable agricultural management in semi-arid regions. The improvement in soil water retention, regulation of hydraulic conductivity, and enhancement of soil structural stability under zeolite application suggest a clear potential for reducing irrigation demand and improving water-use efficiency. This is particularly critical for chickpea cultivation, which is sensitive to water stress during key growth stages. By maintaining more stable soil moisture conditions and improving soil physical quality, zeolite application can contribute to more resilient and sustainable cropping systems under limited water availability.
This study evaluated the impact of natural soil amendments, particularly zeolite, on soil hydraulic and soil plasticity properties under varying available water regimes simulating arid and semi-arid conditions relevant to chickpea cultivation. Results demonstrate that zeolite significantly enhances soil moisture retention under water-stress conditions, with the 2% application rate proving most effective. Zeolite directly improved Atterberg limits, with the 2% treatment yielding superior LL and PL compared to 1%. Clay content emerged as a critical factor governing amendment efficacy; however, zeolite demonstrated pronounced benefits in finer-textured soils by optimizing soil structure, enhancing particle aggregation, and reducing macropore continuity. Therefore, the observed improvements should be interpreted in terms of enhanced soil physical and hydraulic properties, rather than direct effects on chickpea growth, which was not assessed in this study. These improvements indicate better soil water management and structural conditions that may support more favorable environments for chickpea production under limited water availability. In terms of practical application, 2% zeolite appears to be more effective in improving soil physical properties in clay soils, particularly in enhancing water retention and structural stability. However, its agronomic suitability should be further validated using plant growth and yield data before large-scale recommendations. In silty clay loam soils, caution is required due to the observed increase in EC and reduction in saturated hydraulic conductivity under higher zeolite rates. Therefore, careful salinity monitoring and optimized irrigation management are recommended when applying higher rates of zeolite in medium-textured soils to avoid potential salt accumulation and restricted water movement.
The authors gratefully acknowledge the University of Mosul College of Agriculture and Forestry for providing the laboratory facilities and experimental resources that contributed to the quality of this research.
[1] Lin, Q.F., Gao, Z.R., Lin, C., et al. (2021). A stable aluminosilicate zeolite with intersecting three-dimensional extra-large pores. Science, 374(6575): 1605-1608. https://doi.org/10.1126/science.abk3258
[2] Li, C., Li, T., Cui, Q., et al. (2025). Ion exchange: An essential piece in the fabrication of zeolite adsorbents. Physical Chemistry Chemical Physics, 27(30): 15819-15834. https://doi.org/10.1039/D5CP00894H
[3] Alvarez-Ayuso, E., Garcıa-Sánchez, A., Querol, X. (2003). Purification of metal electroplating waste waters using zeolites. Water Research, 37(20): 4855-4862. https://doi.org/10.1016/j.watres.2003.08.009
[4] Elma Mathew, S., Shakappa, D. (2022). A review of the nutritional and antinutritional constituents of chickpea (Cicer arietinum) and its health benefits. Crop & Pasture Science, 73(4): 401-414. https://doi.org/10.1071/CP21030
[5] Khajehpour, M.R. (2000). Basics of Agronomy. Jihad Daneshgahi Isfahan Press.
[6] Mohammed, E., Abid-Alziz AL-Qassab, S., Salih AL-Wazan, F.A. (2022). Using inverse modeling by HYDRUS-1D to predict some soil hydraulic parameters from soil water evaporation. Colombia Forestal, 25(1): 21-35. https://doi.org/10.14483/2256201X.18157
[7] Stylianou, M.A., Inglezakis, V.J., Loizidou, M. (2015). Comparison of Mn, Zn, and Cr removal in fluidized-and fixed-bed reactors by using clinoptilolite. Desalination and Water Treatment, 53(12): 3355-3362. https://doi.org/10.1080/19443994.2014.927303
[8] Bhattacharyya, T., Chandran, P., Ray, S.K., Pal, D.K., Mandal, C., Mandal, D.K. (2015). Distribution of zeolitic soils in India. Current Science, 109(7): 1305-1313. https://oar.icrisat.org/9106/.
[9] Zabochnicka-Świątek, M. (2007). Factors affecting adsorption capacity and ion exchange selectivity of clinoptilolite towards heavy metal cations. Inżynieria i Ochrona Środowiska, 10(1): 27-43.
[10] Mondal, M., Biswas, B., Garai, S., Sarkar, S., Banerjee, H., Brahmachari, K., Hossain, A. (2021). Zeolites enhance soil health, crop productivity and environmental safety. Agronomy, 11(3): 448. https://doi.org/10.3390/agronomy11030448
[11] Noori, M., Homaee, M., Farahani, H.A. (2006). Application of natural zeolite to improve saline soil properties and crop productivity. Journal of Agricultural Science and Technology, 8: 45-56. https://doi.org/10.1080/02772240500457928
[12] Chenarboni, H.A., Lajevardi, S.H., Molaabasi, H., Zeighami, E. (2022). Consolidation behavior of the expansive clay treated with cement and zeolite. Journal of Central South University, 29(9): 3140-3157. https://doi.org/10.9734/ijpss/2024/v36i34423
[13] Zhang, K., Pan, L., Li, J., Lin, C. (2021).What is the mechanism of the fiber effect on the rheological behavior of cement paste with polycarboxylate superplasticizer? Construction and Building Materials, 281: 122542. https://doi.org/10.1016/j.conbuildmat.2021.122542
[14] Ali, A.M., Alsaqa, R., Sultan, N.S. (2022). Study of thermodynamic properties of monoclinic sulfur (Sβ) under high pressure using three different equations of state for the treatment scabies in dermatology. International Journal of Thermodynamics, 25(2): 33-38. https://doi.org/10.5541/ijot.1003950
[15] Jabbar, H.A. (2025). Zeolite application improves soil structure and water retention in agriculture. Academia Open, 10(1). https://doi.org/10.21070/acopen.10.2025.11393
[16] Tagami, K., Uchida, S. (2025). Fundamental study on measurement of soil pH and electrical conductivity in batch tests for the determination of soil-soil solution distribution coefficient. Nuclear Engineering and Technology, 57(3): 103269. https://doi.org/10.1016/j.net.2024.10.031
[17] Rowell, D.L. (1994). Soil Science: Methods and Applications. Routledge. https://www.taylorfrancis.com/books/mono/10.4324/9781315844855/soil-science-david-rowell.
[18] Asch, J., Johnson, K., Mondal, S., Asch, F. (2022). Comprehensive assessment of extraction methods for plant tissue samples for determining sodium and potassium via flame photometer and chloride via automated flow analysis#. Journal of Plant Nutrition and Soil Science, 185(2): 308-316. https://doi.org/10.1002/jpln.202100344
[19] Soil and Plant Analysis Council Inc. (1982). Soil Analysis Handbook of Reference Methods. CRC Press. https://doi.org/10.1201/9780203739433
[20] Carter, M.R. (1993). Soil Sampling and Methods of Analysis. CRC Press.
[21] Richards, L.A. (1947). Diagnosis and improvement of saline and alkaline soils. Soil Science, 64(5): 432. https://journals.lww.com/soilsci/citation/1947/11000/Diagnosis_and_Improvement_of_Saline_and_Alkaline.13.aspx.
[22] Gee, G.W., Bauder, J.W. (1986). Particle-size analysis. In Methods of Soil Analysis: Part 1 Physical and Mineralogical Methods. https://doi.org/10.2136/sssabookser5.1.2ed.c15
[23] Klute, A. (1986). Methods of Soil Analysis: Part 1 Physical and Mineralogical Methods. American Society of Agronomy. https://doi.org/10.2136/sssabookser5.1.2ed
[24] Herreid, J.S., Lee, B., Islam, M.A., Ritten, J., Jabbour, R. (2025). Alfalfa harvest timing impacts on alfalfa weevil with agronomic and economic contexts. Crop Protection, 191: 107134. https://doi.org/10.1016/j.cropro.2025.107134
[25] Chourasia, A., Singh, A.P., Chattopadhyay, A., Ankita. (2024). Influence of zeolite application on soil infiltrated with sewage effluent. International Journal of Plant & Soil Science, 36(3): 270-276. https://doi.org/10.9734/ijpss/2024/v36i34423
[26] Satriani, A., Lovelli, S., Belviso, C., Comegna, A. (2025). Effect of waste-derived synthetic zeolite on soil hydraulic properties and soil water storage parameters in sandy-loam soils. Catena, 259: 109395. https://doi.org/10.1016/j.catena.2025.109395
[27] Liliya, M.B., Vladimir, O.E., Ramil, N.F., Rasim, R.G., Asiya, M.E. (2020). Effect of zeolites on soil modification and productivity. BIO Web of Conferences, 17: 00117. https://doi.org/10.1051/bioconf/20201700117.
[28] Das, A., Sangma, C.B.K., Chakraborty, M., Saha, S., Kumar, A., Das, B., Layek, J., Babu, S., Pandey, P. (2025). Strategies for restoring soil health in Indian Himalayan Region. In Soil Health Series: Volume 4 Soil Health and Sustainability in India, pp. 243-319. https://doi.org/10.1002/9780891187400.ch9
[29] Saleh, M.M., Khemakhem, H., Jassim, I.K., Al-Saqa, R.H. (2024). Structure and mechanical properties of cermet Ni-Al/MSZ thick coating prepared by flame spraying technique. Ochrona przed Korozją, 67(1): 9-14. https://doi.org/10.15199/40.2024.1.2
[30] Ferretti, G., Rosinger, C., Diaz-Pines, E., Faccini, B., Coltorti, M., Keiblinger, K.M. (2024). Soil quality increases with long-term chabazite-zeolite tuff amendments in arable and perennial cropping systems. Journal of Environmental Management, 354: 120303. https://doi.org/10.1016/j.jenvman.2024.120303