Hala Ali Meer Hussein* | Shmoos A. Jabbar | Said Jassim Al Saady
© 2026 The authors. This article is published by IIETA and is licensed under the CC BY 4.0 license (http://creativecommons.org/licenses/by/4.0/).
OPEN ACCESS
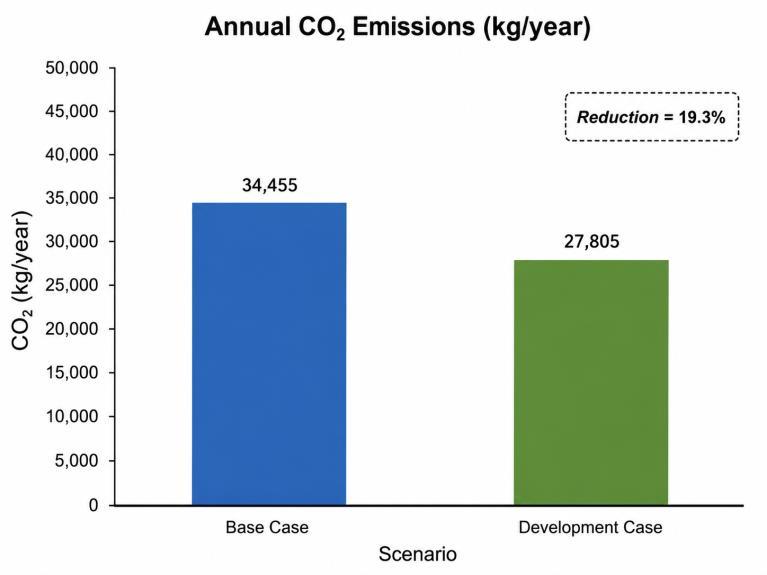
Environmental planning plays a critical role in achieving sustainable urban development, particularly in the context of rapid urbanization, climate change, and increasing energy demands in cities. Green infrastructure has emerged as an effective approach to enhance environmental performance by improving thermal comfort, reducing energy consumption, mitigating urban heat island effects, and lowering carbon emissions. This study investigates the role of green infrastructure within environmental planning frameworks for sustainable cities using DesignBuilder as a simulation-based assessment tool. The research evaluates various green infrastructure strategies, including green roofs, high-performance building envelopes, natural ventilation, shading devices, and landscape integration, and analyzes their impact on key environmental indicators such as indoor thermal comfort, energy consumption, and carbon dioxide emissions. DesignBuilder, based on the Energy Plus engine, is employed to simulate different planning and design scenarios and to quantify their environmental performance under local climatic conditions. The findings of the simulation were that the implementation of the green infrastructure technology significantly improved the sustainability and performance of the environment. Compared to the base model scenario, the improved scenario resulted in a reduction in annual cooling energy consumption by approximately 19.3% (from 56,857 kWh to 45,872 kWh), with peak cooling loads reduced by up to 25%, improved thermal comfort by reducing the average Predicted Mean Vote (PMV) from +1.4 to +0.5, and annual CO₂ emissions decreased from 34,455 kg in the Base Case to 27,805 kg in the Development Case, representing a reduction of approximately 19.3%. The findings demonstrate that integrating green infrastructure within environmental planning significantly enhances building- and neighborhood-level sustainability by improving indoor environmental quality and reducing operational energy demand. The study highlights the importance of simulation-driven decision-making in early planning stages and provides practical recommendations for urban planners, architects, and policymakers to support the transition toward greener and more sustainable cities.
green infrastructure, carbon reduction, thermal performance, energy efficiency, sustainable urban development
More than half of the world's population now lives in urban areas, which have become the primary living space for humans while their populations and land areas keep expanding [1]. Cities contain half of the world's seven billion people who live across the globe. Urban areas that face high land costs and multiple obstacles need to establish green spaces that serve multiple functions for their residents. The process of integrating green infrastructure into urban planning systems has started, yet requires additional work to become standard practice for urban infrastructure development [2].
The gap that the study aims to fill includes:
Integration Gap: There is a lack of comprehensive evaluation of various green infrastructure strategies within a single framework of environmental planning.
Quantification Gap: There is a lack of simulation-based evaluation of the performance of green infrastructure strategies considering local climatic conditions.
Decision-Making Gap: There is a lack of utilization of simulation-based evaluation in early-stage planning and policy-making.
There is a need to address the issue of rapid urbanization and climate change challenges in hot environments. The existing methods focus on green infrastructure from a conceptual perspective; on the contrary, building simulations are available but only for single buildings. There is a gap for integrating planning tools with assessment tools to determine how integrated green strategies can enhance thermal comfort, save energy, and minimize greenhouse gas emissions.
The current economic system depends on energy as its essential foundation because all international communities search for ways to decrease their energy usage and costs [3]. The practice of planting trees and creating green spaces in cities with moderate temperatures has gained support because scientists now understand how these plants reduce building cooling expenses [4]. Research indicates that urban greenery, including green roofs, street trees, and expanded green areas in cities, helps buildings reduce their energy use by lowering their need for heating and cooling [3]. Heisler [5] studied the expenses that green infrastructure reduces by showing that residential areas with trees can achieve cooling cost savings between 20 and 50 percent and heating cost savings between 10 and 15 percent.
The main objectives of this study are as follows:
•To explore the possibility of improving environmental performance through the use of green infrastructure strategies in sustainable urban development.
•To analyse the effect of green infrastructure strategies, which include natural ventilation, green roof construction, shade structure design, and landscaping, on energy savings and thermal comfort.
•To analyse the effectiveness of green infrastructure strategies in reducing carbon footprint and urban heat island effects in the local environment.
•To adopt simulation as a basis for decision-making and as a means of assessing environmental performance.
•To provide useful recommendations to legislators, architects, and urban planners for the transition to low-carbon cities.
Green infrastructure has been noted in environmental planning as a strategically managed bundle of natural or semi-natural areas such as parks, green roofs, and wetlands that offer ecological, social, and economic benefits. This type of infrastructure offers advantages such as biodiversity, stormwater management, air quality improvement, and overcoming the impacts of climate change [6].
The use of green infrastructure is essential for increasing the functioning of urban ecosystems. It is known to increase a number of ecosystem services, for instance, biodiversity enhancement, mitigation of urban heat island effects, improvement of air quality, and so on [7]. Through an analysis of different green infrastructure, such as urban forests, permeable pavements, green walls, and green roofs, this paper seeks to determine the different benefits associated with urban green infrastructure. Different forms of green infrastructure, such as urban forests, permeable pavements, green walls, and green roofs, enable local administrations to improve water quality, manage stormwater runoff, reduce flood risk, decrease heat stress, support carbon storage, and enhance urban livability [8].
Green infrastructure has emerged as a key component of these frameworks, which is not only described as urban greenery but as a connected system that provides ecological, social, and climatic benefits [9]. Unlike traditional infrastructure, green infrastructure can play a role in the management of stormwater, temperature regulation, air quality improvement, as well as biodiversity conservation, while improving urban livability [10].
Most of the planning literature remains conceptual, discussing policy instruments and governance strategies while not quantitatively linking planning decisions to environmental performance at the building level.
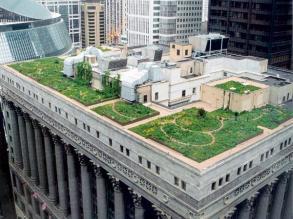
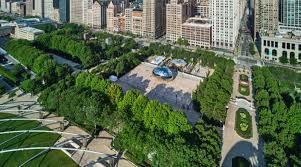
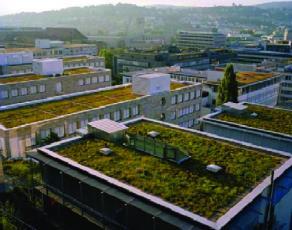
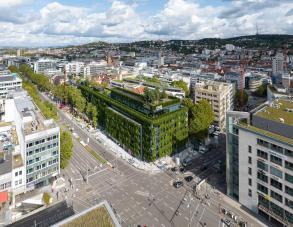
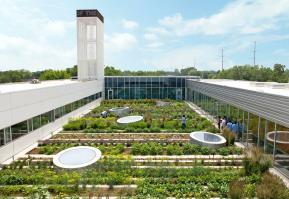
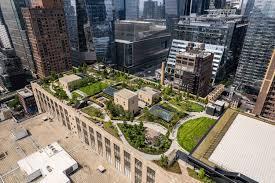
For instance, green roofs can be cited as a popular form of green infrastructure typology whose performance varies greatly depending on the nature of systems being employed. Large green roof systems are commonly applied for stormwater management and insulation purposes due to their lightweight and low-maintenance plant species, despite having a very shallow growing medium layer. In contrast, intensive green roofs require greater structural support and maintenance while offering more thermal mass, shading, and cooling capabilities (Table 1).
Table 1. Extensive vs. intensive green roof case studies (Europe & North America)
|
Aspect |
Extensive Green Roof Case Studies |
Intensive Green Roof Case Studies |
|
Definition |
Lightweight, maintenance-free, and shallow substrate systems are mainly designed for environmental benefits. |
Complexly structured, deep substrate systems capable of sustaining trees, shrubs, and functional spaces. |
|
Chicago, USA |
Sedum and grass are planted as experimental cooling and stormwater management solutions on the City Hall roof (extensive areas). |
Deep soil that can accommodate grass, trees, and recreational spaces is found in Millennium Park and the City Hall intensive areas. |
|
Stuttgart, Germany |
||
|
Stuttgart industrial, residential, and garage roofs (city-wide program) |
Calwer Passage redevelopment (ingenhoven architects) |
|
|
North America |
||
|
Gary Comer Youth Center — Chicago |
Morgan North Rooftop Park — New York City |
Similarly, green infrastructure like green roofs, parks, and permeable pavements greatly enhances urban environmental performance by addressing stormwater management, urban heat island effects, and air quality. It promotes biodiversity and habitat restoration, reduces energy consumption, and offers social benefits that include public health.
Green infrastructure provides multiple environmental, ecological, social, and economic benefits in urban areas. It supports stormwater management, reduces flood risk, improves water quality, mitigates urban heat island effects, enhances air quality, promotes biodiversity, and contributes to healthier and more livable urban environments. In addition, green spaces provide recreational opportunities, improve public health, support urban aesthetics, and can contribute to local economic vitality through improved environmental quality and urban attractiveness [10, 11].
Green roofs significantly improve the environmental performance of buildings by up to 70% in terms of cooling load reduction, decrease in roof surface temperature, and enhanced insulation. They control stormwater, retaining 60% to 100% of rainfall; air pollutants are filtered, and the heat island effects within cities are minimized; all this while protecting membranes for extended life [12].
Green roofs have a positive impact on indoor and outdoor thermal comfort. The environmental changes that reduce outdoor temperature levels will decrease summer surface heat, along with cooling system requirements. Researchers [13] have conducted multiple studies to determine the level of comfort that exists between indoor and outdoor environments.
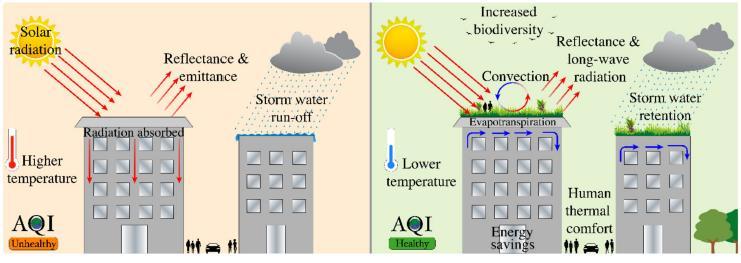
Green roofs affect building energy use through multiple operational systems, which include plant water release and solar heat absorption in leaves and air movement for heat transfer and earth temperature regulation, and water loss from soil surfaces [14]. Green roofs affect building energy use through several physical mechanisms, including evapotranspiration, solar radiation absorption, convective heat transfer, soil heat storage, and moisture exchange [14, 15]. These mechanisms are schematically illustrated in Figure 1.
Research indicates that green roofs help to reduce surface temperatures, while shading systems and vegetation help to reduce solar heat gains. Urban trees and landscape also help to reduce extremes of microclimate and improve outdoor thermal comfort [14].
However, research on these techniques is mostly conducted on a standalone basis, focusing on individual buildings, rather than integrating these techniques within a wider environmental planning strategy, including aspects such as neighbourhood arrangement, spatial orientation, density patterns, and land use planning strategies.
Regardless of its location, green infrastructure must be diverse, interconnected, multipurpose, and suitable for the local environment. From the urban core to the countryside, as well as into some major infrastructure types like hospitals, schools, colleges, and linear infrastructure, this section examines how green infrastructure should be planned, designed, and delivered as a multifunctional network [17].
One of the key principles is the early integration of green infrastructure. In other words, there is a lot to be gained from not incorporating or awaiting the late design stages for the implementation of green infrastructure. It is important to ensure that there is early adoption and utilization of systems thinking for infrastructure projects based on landscape, clean water provision, water, and stormwater [18].
A crucial step toward more resilient, energy-efficient, and climate-responsive built environments is the integration of green infrastructure with planning and design technologies. In addition, life-cycle-based assessment approaches can strengthen sustainability-oriented decision-making by linking environmental impacts with long-term economic performance. Naser et al. [19] emphasized that integrating life cycle cost analysis (LCCA) with life cycle assessment (LCA) supports more informed and sustainable infrastructure management decisions by considering both economic and environmental dimensions over the full project life cycle.
Early on in the design process, designers and decision-makers can statistically evaluate environmental performance by including techniques like natural ventilation, shading systems, permeable landscapes, and green roofs into simulation-based tools and spatial planning frameworks. This integration supports educated, data-driven decision-making while improving urban microclimates, lowering energy use and carbon emissions, and improving thermal comfort. Additionally, the alignment between design purpose and sustainability results is strengthened by the use of digital planning and environmental simulation technologies, allowing for scalable and context-sensitive solutions. In the end, green infrastructure becomes a fundamental element of sustainable urban development and future-proof city planning when it is methodically integrated into planning and design tools, going beyond being a supplemental tactic [20].
6.1 Research methodology
This study, consistent with common DesignBuilder–Energy Plus simulation practice, was conducted on the Al-Khwarizmi College of Engineering building at the University of Baghdad. The paper quantifies the impacts of the green infrastructure approach on the performance of the environment, including alleviating heat in urban areas, enhancing thermal comfort, lowering the carbon footprint, and improving energy efficiency. This proposed methodology facilitates decision-making regarding the development of sustainable urban policy solutions because it makes comparisons among different scenarios easier. This methodology is an enhancement to the previous simulation-based research on sustainability performance evaluation using DesignBuilder simulations.
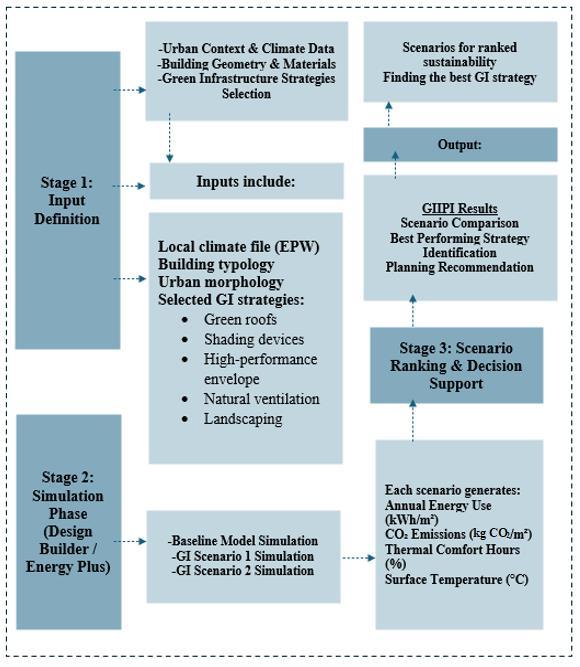
The research utilizes the simulation-based DesignBuilder software for analysis to evaluate the impact of the chosen green infrastructure on the environment. As part of efforts aimed at enhancing sustainable urban planning and design, the evaluation highlights important performance indicators, including energy usage, comfort, emissions, and urban cooling, as shown in Figure 2.
Figure 2. Methodological framework for the development and application of integrated green infrastructure performance
6.2 Research approach
In order to assess how well green infrastructure initiatives improve environmental performance within environmental planning frameworks, this study uses a quantitative simulation-based methodology. The study uses DesignBuilder software, which is driven by the Energy Plus calculation engine, to simulate dynamic building energy. The method makes it possible to compare several green infrastructure intervention scenarios under local climate circumstances in Baghdad, Iraq, with a baseline scenario.
6.3 Climate data and weather file
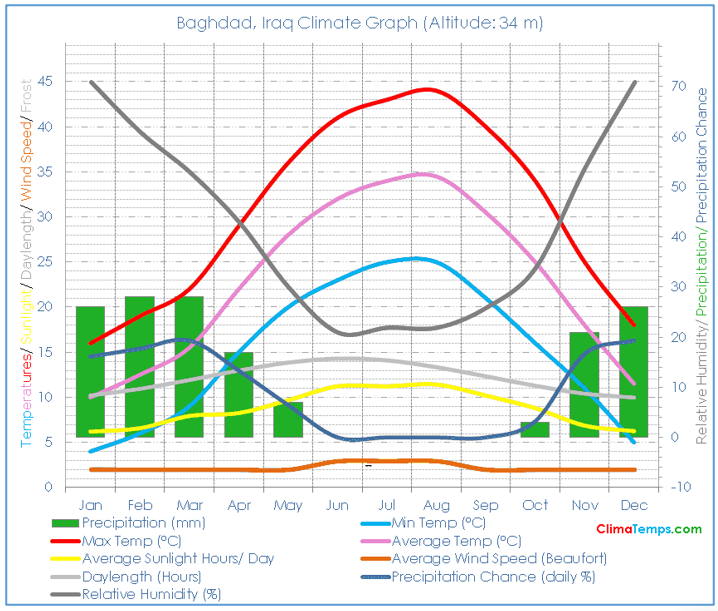
An Energy Plus-compatible typical meteorological year (TMY) weather file provided hourly climate data for Baghdad. Baghdad’s climate is low-latitude, arid, hot, and subtropical (Köppen-Geiger classification: BWh). The monthly climate profile is presented in Figure 3. The climate data used in the simulation include:
6.4 Baghdad climate and temperature profile
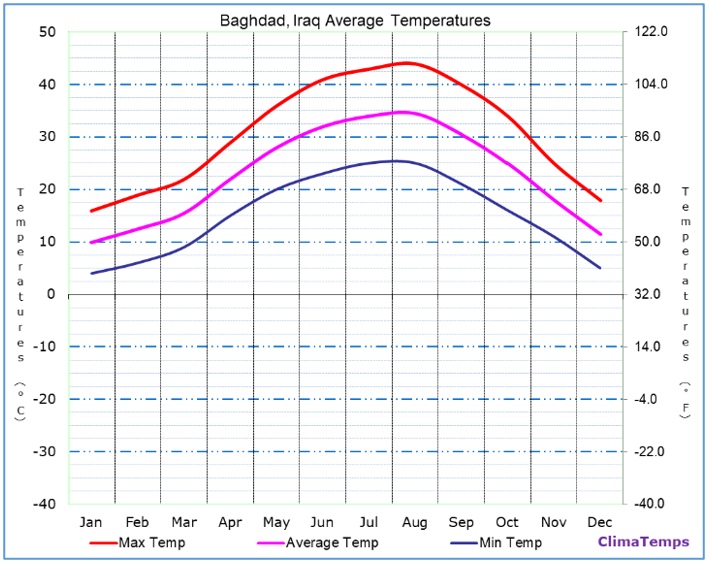
Baghdad, Iraq, is characterized by a hot-dry climate with high summer temperatures and strong solar radiation. The average annual temperature is approximately 22.8 ℃ (73 °F). Monthly average temperatures vary throughout the year, with the lowest average temperature occurring in January at about 10 ℃ (50 °F), while the highest average temperature occurs in August at approximately 34.5 ℃ (94.1 °F). The monthly variations in Baghdad’s maximum, average, and minimum temperatures are illustrated in Figure 4.
Figure 4. Baghdad average temperatures chart
These climatic conditions increase cooling energy demand and make the case study suitable for evaluating green infrastructure and passive design strategies under hot-arid environmental conditions. The temperature data presented in Table 2 were obtained from Climate-Data.org.
Table 2. Baghdad, Iraq's average monthly temperature data, ℃ (°F)
|
Temp. |
Jan |
Feb |
Mar |
Apr |
May |
Jun |
Jul |
Aug |
Sep |
Oct |
Nov |
Dec |
Ann. |
|
Avg. maximum (Tmax) |
16 (60.8) |
19 (66.2) |
22 (71.6) |
29 (84.2) |
36 (96.8) |
41 (105.8) |
43 (109.4) |
44 (111.2) |
40 (104) |
34 (93.2) |
25 (77) |
18 (64.4) |
30.6 (87.1) |
|
Avg. mean (Tmean) |
10 (50) |
12.5 (54.5) |
15.5 (59.9) |
22 (71.6) |
28 (82.4) |
32 (89.6) |
34 (93.2) |
34.5 (94.1) |
30.5 (86.9) |
25 (77) |
18 (64.4) |
11.5 (52.7) |
22.8 (73) |
|
Avg. minimum (Tmin) |
4 (39.2) |
6 (42.8) |
9 (48.2) |
15 (59) |
20 (68) |
23 (73.4) |
25 (77) |
25 (77) |
21 (69.8) |
16 (60.8) |
11 (51.8) |
5 (41) |
15 (59) |
Al-Khwarizmi College of Engineering at the University of Baghdad was chosen as the case study because it exemplifies a typical educational structure in a hot, dry region with high summer temperatures, strong solar radiation, and a substantial cooling energy requirement. This building was selected because it is suitable for assessing green infrastructure integration at both building and campus scales, has a high potential for energy consumption, and represents an urban context.
The following are important aspects of the case study:
•Function: Educational building at the university (offices, labs, lecture halls)
•Climate zone: dry and hot (Baghdad, Iraq)
•Daytime academic use is the occupancy pattern
•Traditional reinforced concrete construction with masonry infill
7.1 Geometric and zoning modelling
The designers created a three-dimensional model of the building through DesignBuilder software, which combined their field observations with their architectural drawings.
•Architectural drawings and site observations
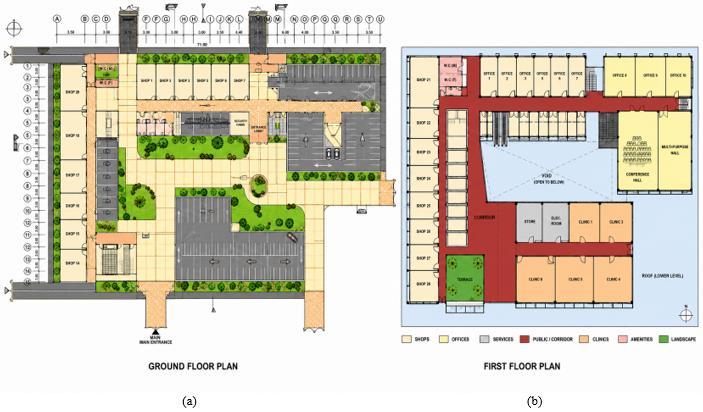
•Functional zoning according to building use (classrooms, laboratories, offices, circulation), as shown in Figure 5.
Figure 5. (a) Master plan, (b) ground floor plan of the Al-Khwarizmi College of Engineering at the University of Baghdad
The simulation achieved its required precision through the correct assignment of thermal and occupancy settings to every individual zone.
7.2 Building envelope and material properties
The building envelope of the Al-Khwarizmi College of Engineering at the University of Baghdad is of critical importance in determining heat-transfer rates, indoor thermal comfort, and overall energy consumption under Baghdad’s hot-dry climatic conditions.
7.3 External walls
The exterior walls are modelled after composite walls made of masonry and reinforced concrete, which are frequently found in Iraqi educational facilities. Usually, the wall assembly is made up of:
•External cement plaster
•Hollow or solid clay brick masonry
•Internal cement plaster
Due to its lack of insulation, this design results in significant heat gain in summer.
7.4 Roof construction
The roof is assumed to be a flat reinforced concrete slab, which is a major heat gain contributor due to direct solar exposure. The reference roof configuration consists of:
•External cement screed
•Reinforced concrete slab
•Internal plaster finish
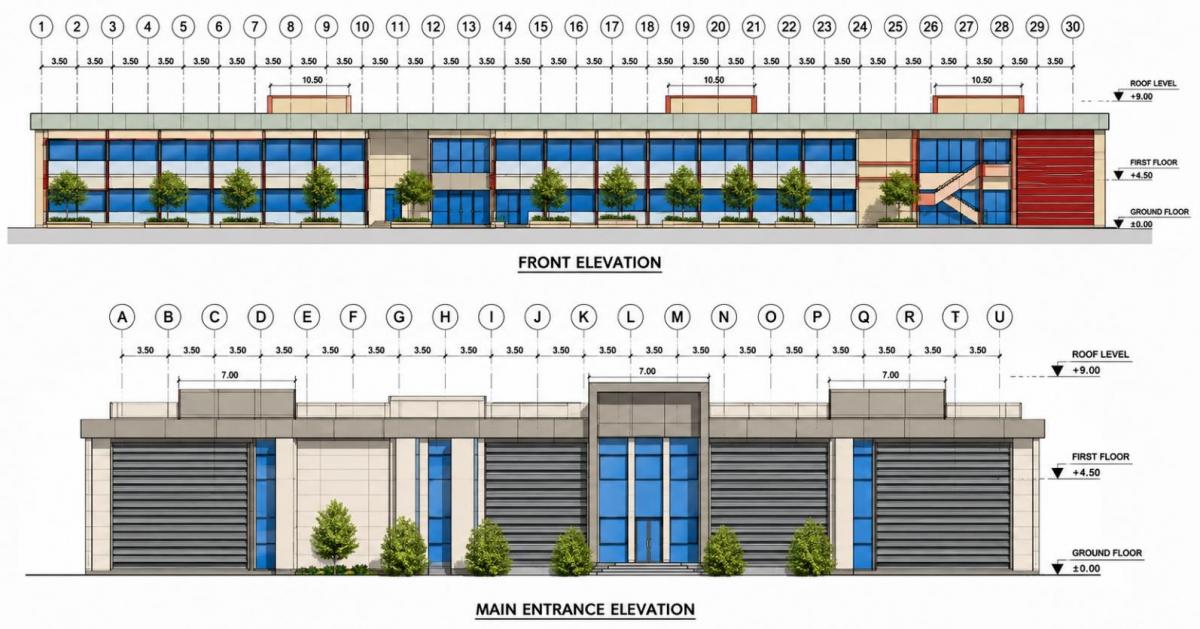
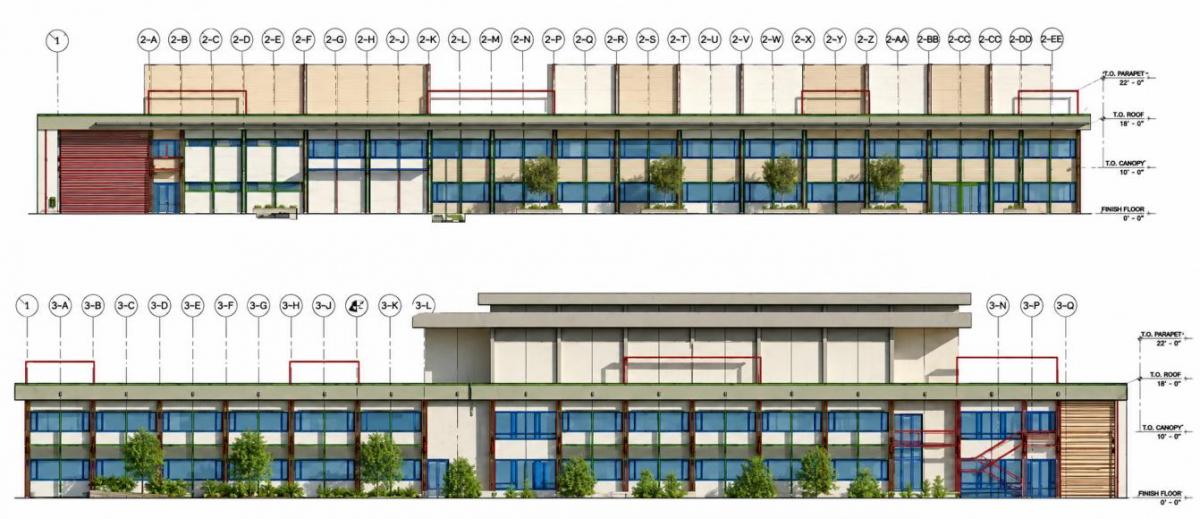
In accordance with typical building practices, the baseline condition does not include a thermal insulation layer. This roof construction significantly increases cooling demands, particularly in the hottest summer months. The south and west façades of the building are shown in Figure 6, whereas the north and east façades are presented in Figure 7.
Figure 6. South and west facade of the Department of Environmental Engineering at the University of Baghdad
Figure 7. North and east facade of the Al-Khwarizmi College of Engineering at the University of Baghdad
7.5 Glazing and openings
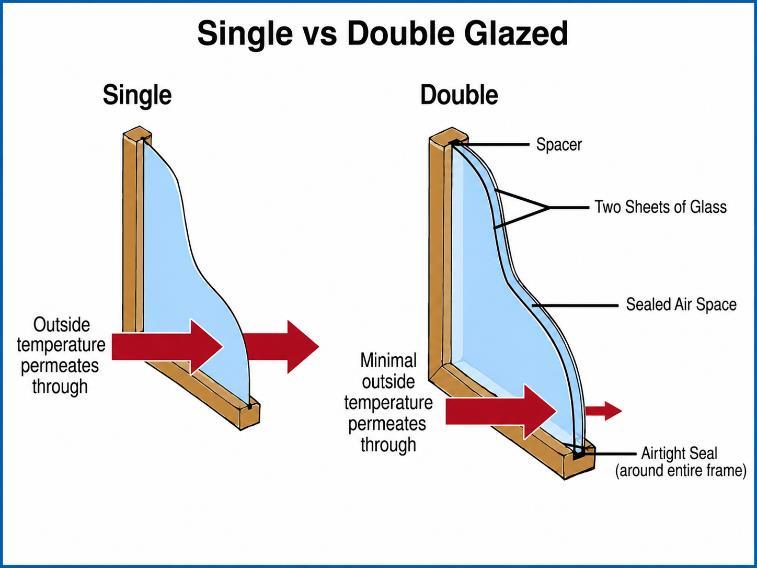
Windows have aluminum frames, negligible heat resistance, and single or standard double glazing. Crucial characteristics consist of:
•Moderate to high U-values
•High solar heat gain coefficient (SHGC)
•Clear glass without solar control coating
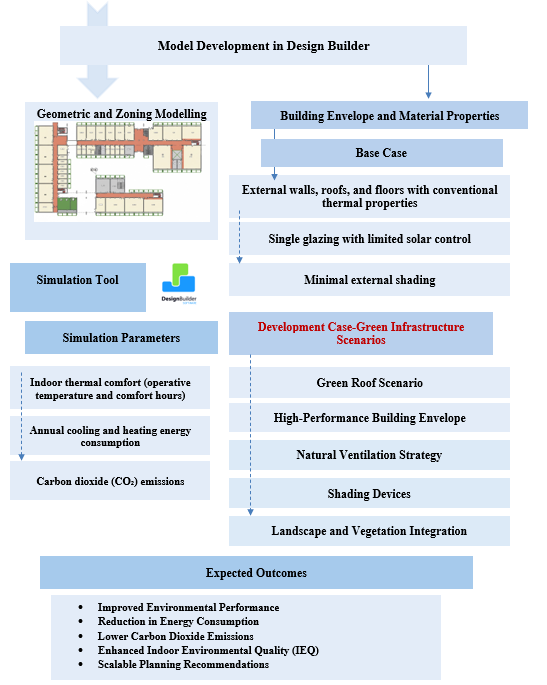
DesignBuilder provides people with an easy-to-use software platform that enables them to create building energy consumption models and perform simulation studies that analyze their energy usage. The software performs thermal, lighting, and energy simulations by connecting with other programs, which include Energy Plus and Radiance. Designers must create detailed three-dimensional building models in DesignBuilder to achieve optimal energy efficiency, comfort, and sustainable design practices. The software receives extensive usage from architects and sustainability consultants who work in their respective fields, see Figure 8.
Figure 8. Practical research methodology framework
The baseline model developed was validated through comparison with the actual energy consumption values of the selected building. Monthly electrical energy consumption data obtained from the building administration were used for the comparison with the simulation results generated by the Energy Plus calculation engine.
For the purpose of minimizing the difference between the two sets of values, it was necessary to change some input parameters, such as occupancy schedules, lighting load, equipment load, infiltration rate, and heating, ventilation, and air-conditioning (HVAC) system operation characteristics. The calibration and validation of the building energy model followed Guideline 14 of the American Society of Heating, Refrigerating and Air-Conditioning Engineers (ASHRAE).
The normalized mean bias error (NMBE) and the coefficient of variation of the root mean square error (CV(RMSE)) were calculated using Eqs. (1) and (2), respectively:
$\operatorname{NMBE}(\%)=\frac{\sum_{i=1}^n\left(M_i-S_i\right)}{(n-p) \bar{M}} \times 100$ (1)
$\operatorname{CV}(\operatorname{RMSE})(\%)=\frac{\sqrt{\frac{\sum_{i=1}^n\left(M_i-S_i\right)^2}{n-p}}}{\bar{M}} \times 100$ (2)
where,
$n$ is the number of data points;
$p$ is the number of corrected or adjustable model parameters;
$M_i$ is the measured energy consumption at time interval $i$;
$S_i$ is the simulated energy consumption at time interval $i$;
$\bar{M}$ is the average measured energy consumption.
ASHRAE Guideline 14 provides recommended acceptable limits for monthly model calibration. In this study, model credibility was established through comparative analysis with simulation experiments reported in existing literature under similar climatic conditions, as operational monitoring data for the case study building were not available. Consequently, statistical indices such as the root mean square error (RMSE), NMBE, CV(RMSE), and coefficient of determination (R²) could not be computed. This represents a limitation of the study, and future work will seek to collect measured building performance data to enable full quantitative validation in accordance with ASHRAE Guideline 14. The simulation model was therefore considered sufficiently representative for the comparative assessment of the proposed green infrastructure scenarios.
The design process of building envelope components, along with their material properties, requires designers to generate thermal data, which Energy Plus needs for its calculation engine. The modelling process required DesignBuilder to develop precise envelopes, which included walls and roofs, floors and glazing systems, and shading elements to match actual building construction methods. The DesignBuilder software performs hourly calculations to determine heat transfer and solar gains, thermal mass effects, and cooling requirements. The establishment of a dependable baseline model in DesignBuilder allows users to perform systematic comparisons between current conditions and future green infrastructure scenarios. The evaluation system will show all changes in energy usage, indoor temperature comfort, and carbon emissions that result from changes to building envelopes and designs rather than from modelling assumptions. The simulation-based method produces better results for environmental performance assessment because it creates more dependable and repeatable results, which help people make smarter decisions.
8.1 Building simulation
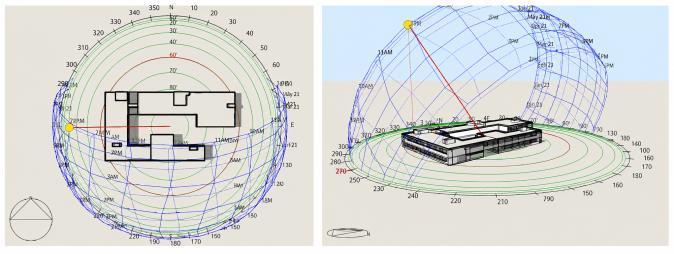
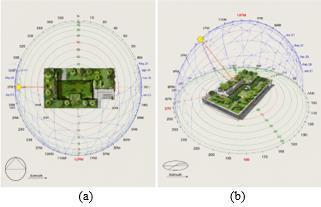
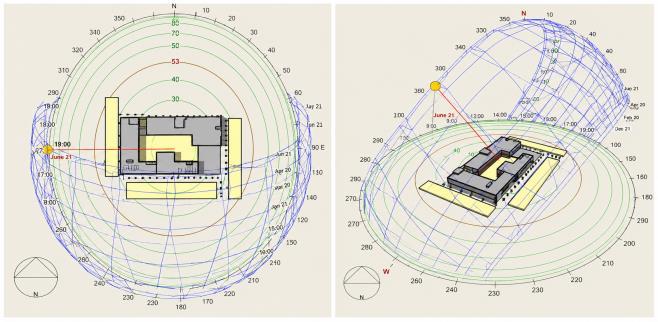
The simulation used DesignBuilder's graphical user interface version V7, which runs Energy Plus calculation engines. The DesignBuilder selection process involved choosing this software because it allowed users to enter flexible geometry data while providing a wide range of materials and load profile options. The system contains control methods that verify that output results match the results produced by independent Energy Plus engines. The Design-Builder program performed simulations that tested cooling and heating system usage to determine how well the building performed, as shown in Figure 9.
Figure 9. Sun-path diagrams of the case-study building generated using DesignBuilder: (a) plan view and (b) three-dimensional view
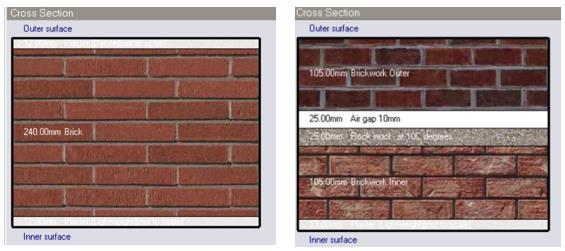
The specifications satisfy the Al-Khwarizmi College of Engineering at the University of Baghdad and are consistent with Energy Plus modelling and hot-dry climate performance. According to earlier studies, the thermal performance of a wall can be enhanced by implementing a multilayered wall construction with different thermal properties. In order to examine their thermal performance, five different building techniques were chosen for this study and applied to a building in the Al-Khwarizmi College of Engineering as a Base Case model. The model was created, and the opaque wall on the south façade was modified utilizing a variety of ways, including layers of materials, while taking into account the manufacturer's dimensions, thickness, and material qualities, as shown in Table 3.
Table 3. Construction layers of the Base Case of the Al-Khwarizmi College of Engineering at the University of Baghdad
|
Element |
Layer Order |
Layer |
Thickness (m) |
|
External wall |
1 |
Plaster [Dense] |
0.012 |
|
2 |
Brick |
0.240 |
|
|
3 |
Plaster [Lightweight] |
0.012 |
|
|
Roof (baseline) |
1 |
Cement/plaster/mortar – cement screed |
0.003 |
|
2 |
Concrete, reinforced with 1% steel |
0.200 |
|
|
3 |
Plaster [Dense] |
0.0015 |
|
|
Partition |
1 |
Cement/plaster/mortar – plaster |
0.0015 |
|
2 |
Brick |
0.120 |
|
|
3 |
Cement/plaster/mortar – plaster |
0.0015 |
|
|
Floor construction |
1 |
Ceramic/clay tiles |
0.020 |
|
2 |
Cement/plaster/mortar – cement |
0.030 |
|
|
3 |
Concrete roofing slab, aerated |
0.200 |
|
|
4 |
Sandstone |
0.150 |
|
|
5 |
Sand fill – compacted |
0.150 |
8.2 S1: Green roof scenario
In order to assess how well vegetated roofing systems work as a passive environmental strategy to enhance building thermal performance in hot, dry climates, the Green Roof Scenario was created. In this case, a comprehensive green roof system that included layers of vegetation, growing media, drainage, and waterproofing was used in place of the traditional roof construction of the University of Baghdad's Department of Al-Khwarizmi College. By using shading, more thermal mass, and evapotranspiration processes, the technique seeks to lower roof surface temperatures, postpone heat transfer into interior rooms, and lessen peak cooling loads.
Table 4. Input parameters of the DesignBuilder simulation
|
Parameter |
Specification |
|
Simulation software |
DesignBuilder (Energy Plus engine) |
|
Simulation period |
Annual (8760 hours) |
|
Climate and Weather Data (Hot-dry Climate) |
|
|
Location |
Baghdad, Iraq |
|
Climate classification |
Köppen–Geiger: BWh (hot desert) |
|
Key climatic characteristics |
Low humidity, high summer temperatures, and high sun radiation |
|
Building Geometry and Zoning |
|
|
Building type |
University educational building |
|
Number of floors |
Two floors |
|
Zoning strategy |
Lecture halls, labs, offices, administration, and circulation are all included in the functional zoning. |
|
Orientation |
South Façade |
|
Ceiling height |
4.0 m (typical academic spaces) |
|
Occupancy and Internal Gains |
|
|
Occupancy density |
0.05-0.08 person/m² |
|
Occupancy schedule |
Academic daytime operation |
|
Lighting power density |
8-12 W/m² |
|
Metabolic rate |
1.2 met [23] |
Table 5. Parameters of high-performance building envelope
|
External Finish |
Light-colored plaster/stone cladding |
|
Solar Reflectance ≥ 0.6 |
|
|
Thermal Insulation Layer (CRITICAL) |
Rock wool |
|
Thickness: 5-10 cm (minimum) |
|
|
Structural Wall |
Brick |
|
Thickness: 20-25 cm |
|
|
Internal Finish |
cement plaster |
Table 6. Input parameters of green roof - DesignBuilder simulation
|
Parameter |
Input Value |
Description |
|
Soil Thickness |
0.15-0.20 m |
Extensive green roof |
|
Soil Conductivity |
0.40 W/m·K |
Thermal buffering |
|
Vegetation Height |
0.15 m |
Low-maintenance plants |
|
Leaf Area Index (LAI) |
2.0-2.5 |
Evapotranspiration |
|
Roof Solar Absorptance |
0.30 |
Reduced heat gain |
|
Plant Type |
Drought-tolerant succulent and grass species (e.g., Sedum spp. and native grasses) |
Suitable for hot-arid climates with low water demand |
|
Irrigation Condition |
Minimal supplemental irrigation during establishment (first 2-4 weeks only); no regular irrigation thereafter. Drought-tolerant Sedum spp. and native grasses are self-sustaining under Baghdad rainfall conditions post-establishment. |
|
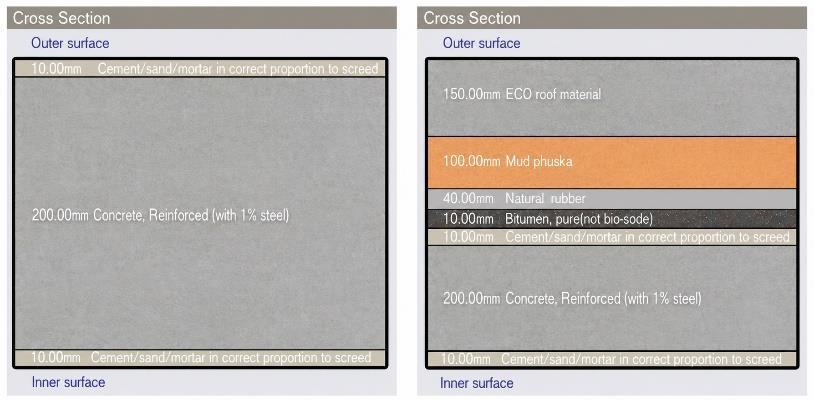
The baseline and green-roof construction assemblies are compared in Figure 10, while the plan layout and three-dimensional model of the green-roof scenario are presented in Figure 11.
Figure 10. Conventional case vs. green roof case (DesignBuilder screenshot)
Figure 11. (a) Layout, (b) 3D view of green roof case
Energy Plus-based surface heat balance calculations were used to simulate the green roof in DesignBuilder. Changes were made to the exterior surface parameters, material thermal values, and roof construction layers. In order to directly compare the scenario with the baseline roof configuration, it was simulated under local climate conditions to measure its effects on indoor thermal comfort, annual cooling energy use, and related carbon emissions (see Tables 4, 5, and 6). The principal DesignBuilder input parameters adopted for the green-roof simulation are summarized in Table 6.
The soil depth of the virtual green roof was about 150 mm, which was considered normal for green roofs that would be deployed in very hot regions on a larger scale. Drought-resistant grass as well as native plants, which could easily adapt to dry environments, formed the vegetation cover. The model used for simulation adopted an average plant height of 0.20 m and a Leaf Area Index (LAI) of 2.5. For maintaining vegetative efficiency under the very hot conditions of Baghdad, minimal watering was allowed in the summer months.
8.3 S2: High-performance building envelope
To evaluate the effects of improved thermal building envelope characteristics on energy efficiency and indoor environmental quality in hot, dry climates, the High-Performance Building Envelope Scenario was created.
The baseline envelope of Al-Khwarizmi College of Engineering at the University of Baghdad was improved in this scenario by increasing the amount of insulation on the walls and roof, improving the performance of the glass, and improving the solar control features. Reducing radiative and conductive heat gains via the building envelope is the goal in order to improve indoor thermal comfort and lower the energy demand for cooling, as illustrated in Table 5. This scenario was implemented in DesignBuilder by altering envelope construction assemblies and material thermal properties, such as decreased thermal conductivity (U-values), increased insulation thickness, and optimized surface solar absorptance, see Figure 12. The improved envelope's steady-state and dynamic thermal behavior under local weather conditions were simulated using Energy Plus heat transfer algorithms. In order to ascertain the relative efficacy of this scenario, its performance was assessed in terms of annual cooling energy consumption, indoor operative temperature, thermal comfort indices—Predicted Mean Vote (PMV) and Predicted Percentage of Dissatisfied (PPD)—and carbon dioxide emissions. It was then directly compared with the baseline and green roof scenarios.
Figure 12. Conventional wall vs development wall (Design-Builder screenshot)
8.4 S3: Natural ventilation strategy scenario
The Natural Ventilation Strategy Scenario was created to evaluate how passive airflow systems could enhance indoor comfort through natural ventilation while cutting down on cooling power requirements during hot-dry climate conditions. Al-Khwarizmi College of Engineering at the University of Baghdad modified its baseline mechanical ventilation and infiltration assumptions to create a system that would allow students to control natural ventilation through their window operations and their ability to open windows. The strategy works to boost air circulation while it enables heat discharge when weather conditions are suitable, and it seeks to decrease the need for mechanical cooling systems
By defining operable window properties, modifying opening schedules, and turning on airflow network modelling based on Energy Plus algorithms, natural ventilation was implemented within DesignBuilder. Important factors included wind-driven and buoyancy-driven airflow effects, window opening control logic connected to indoor-outdoor temperature differentials, and ventilation operation at night during colder temperatures. To assess the scenario's effects on indoor operating temperature, thermal comfort indices (PMV/PPD), ventilation rates, and annual cooling energy consumption, local climate data were used to simulate the situation. The efficacy of natural ventilation as a climate-responsive design approach within environmental planning frameworks was assessed by comparing the outcomes of this scenario with those of the baseline, green roof, and high-performance envelope scenarios (Figure 13).
Figure 13. Single vs double glazing of the high-performance building envelope
The window-opening control parameters adopted for the natural ventilation scenario are summarized in Table 7.
Table 7. Window-opening control parameters for the natural ventilation scenario
|
Parameter |
Value/Condition |
|
Window opening temperature |
Indoor temperature > 24 ℃ |
|
Outdoor temperature condition |
Outdoor temperature < indoor temperature |
|
Comfort range |
18-28 ℃ |
|
Mechanical cooling interaction |
Windows closed when the cooling system operates |
Whenever there were higher external temperatures than the internal ones, high external temperatures, or when cooling systems were being used, the windows would be kept closed. Moreover, when the temperature difference between external and internal temperatures is large enough, the ventilation process during nighttime would take place in order to enhance the process of heat dissipation. Through minimizing unnecessary heat gain, our method ensured that natural ventilation would contribute to thermal comfort.
8.5 S4: Shading devices strategy
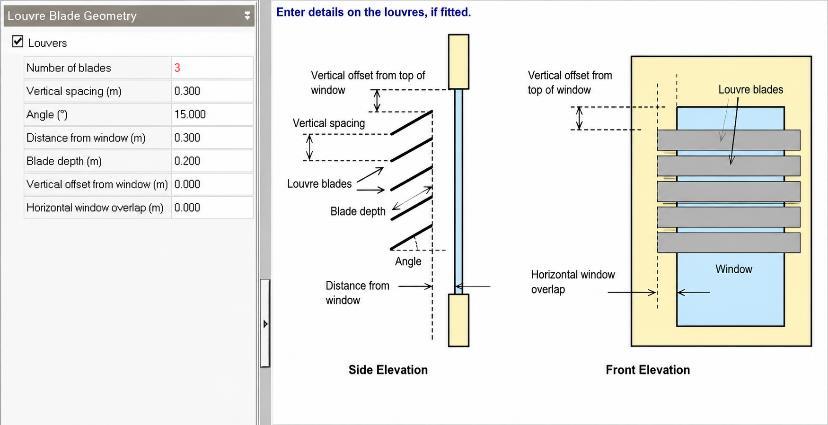
In order to assess how well external solar control measures can lower solar heat gains and enhance indoor thermal conditions in buildings situated in hot, dry climates, the Shading Devices Strategy Scenario was created. In this case, fixed and orientation-specific shading devices, such as recessed window shading, vertical fins, and horizontal overhangs, were added to the baseline façade configuration of the Al-Khwarizmi College of Engineering at the University of Baghdad. Limiting the amount of direct solar radiation that strikes glazed and opaque surfaces is the main goal in order to lower cooling loads and enhance occupant thermal comfort.
Energy Plus solar radiation algorithms were used to modify façade-level solar control parameters and define external shading geometries in order to model shading devices in DesignBuilder. In order to maximize shading effectiveness during peak summer solar angles while preserving sufficient daylight access, shading dimensions, projection depths, and spacing were assigned according to window orientation. The dynamic solar position, shading obstruction, and surface heat balance interactions were all taken into consideration in the simulation. Thermal comfort indices (PMV/PPD), indoor operating temperature, solar heat gain through glazing, and annual cooling energy demand were all analyzed to evaluate this scenario's performance. To ascertain the relative contribution of shading devices as a passive cooling strategy within integrated environmental planning, the results were compared to the baseline, green roof, high-performance envelope, and natural ventilation scenarios.
8.6 S5: Landscape and microclimate integration scenario
The purpose of the Landscape and Microclimate Integration Scenario was to assess how vegetated outdoor elements affect the building's immediate microclimate and indirectly affect its thermal performance. In this case, the incorporation of landscape elements like trees, grassy areas, permeable surfaces, and shaded courtyards improved the baseline site conditions of the Al-Khwarizmi College of Engineering at the University of Baghdad. In order to decrease heat gains to the building envelope and improve indoor thermal comfort, the strategy seeks to lower ambient air temperature, limit reflected solar radiation, and enhance outdoor thermal conditions.
In the DesignBuilder software, the effects of the landscape and its microclimate were modeled with modifications to the parameters for the site and external surfaces based on the capacity of the Energy Plus software. These included the modification of the ground surface solar absorptance with the implementation of a vegetated ground cover, the identification of the shaded external surfaces based on the tree canopy components and other external obstructions, and the consideration of the evapotranspiration effects based on the changes to the conditions for the surfaces' heat balance. Though there is a lack of comprehensive simulation for the physiology of the vegetation by the Energy Plus software, there is an option for the indirect consideration of the mitigating effects of the microclimate.
The integrated scenario was simulated using the Energy Plus engine to capture the combined effects of reduced conductive heat transfer, controlled solar gains, enhanced convective heat removal, and microclimate mitigation. The performances that were evaluated include annual and peak cooling energy demand, indoor operative temperature, thermal comfort indices (PMV and adaptive comfort), and carbon dioxide emissions. Results from this scenario have been compared with the baseline and with individual strategy scenarios in order to quantify the added value of integrated green infrastructure within environmental planning and to demonstrate effectiveness in using simulation-driven decision-making for achieving sustainable building performance.
Vegetation impact modeling was done using the DesignBuilder green roof and landscaping properties like shading, evaporative cooling estimation, soil heat storage, and altered surface characteristics, instead of physiological plant modeling. As seen in the image, the sun-path and solar analysis were performed for the Al-Khwarizmi College of Engineering building using DesignBuilder.
The major building elements are denoted by the grey blocks in the image, whereas the exterior shade zones are illustrated with yellow blocks in the diagram. The image shows that solar motion, the positioning of buildings, and the functionality of landscapes in the environment help reduce heat exposure in arid environments.
As transition zones between the building mass and the landscape, the zones in yellow also make an important contribution to the environment. This is because these landscaped zones prevent excessive heat gain through the open façade. In addition, the landscaping contributes to the process of passive cooling through air movement and shading of the ground surfaces. The calculated building and landscape areas and their respective proportions of the total site area are presented in Table 8.
Table 8. Building and landscape areas as percentages of the total site area
|
Building Element |
Calculated Area (m²) |
Percentage of Total Site Area |
|
Building area |
63,000 |
60.9% |
|
Landscape area |
40,425 |
39.1% |
|
Total site area |
103,425 |
100.0% |
9.1 Annual energy consumption
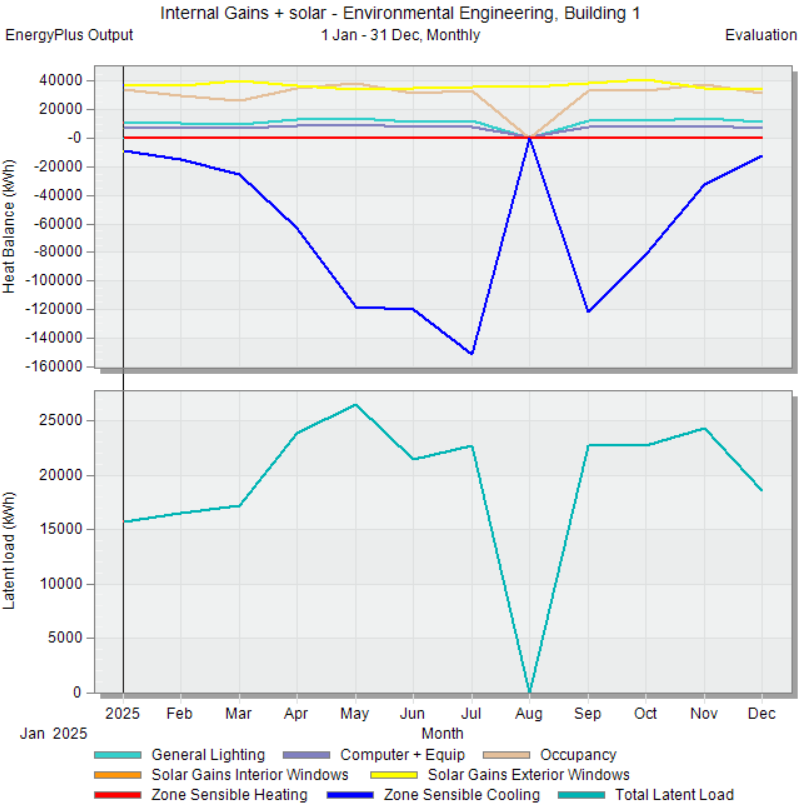
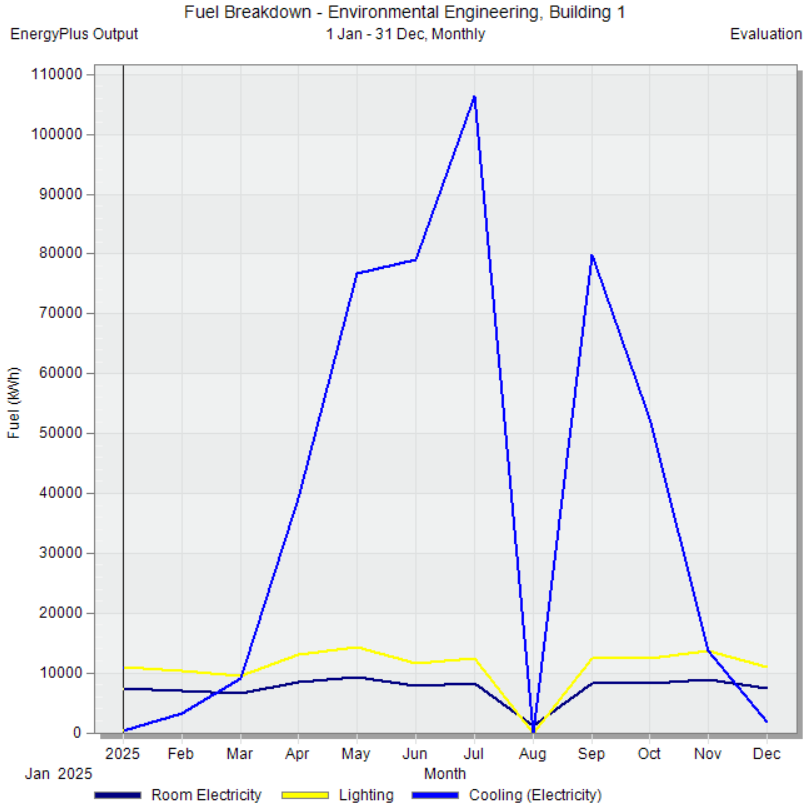
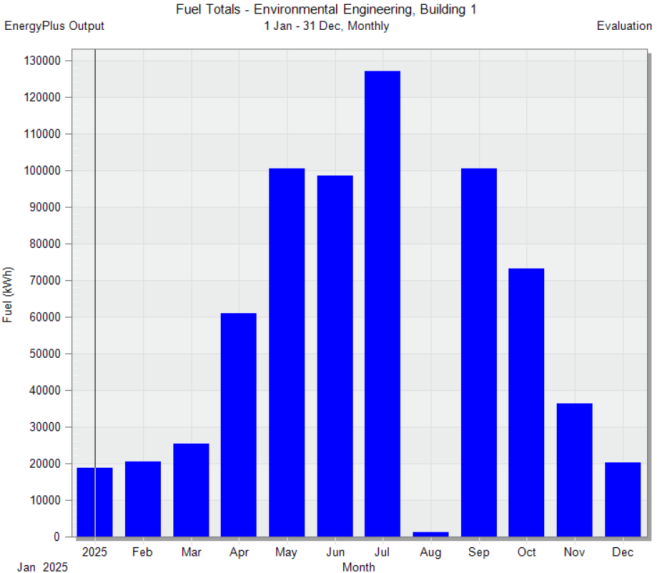
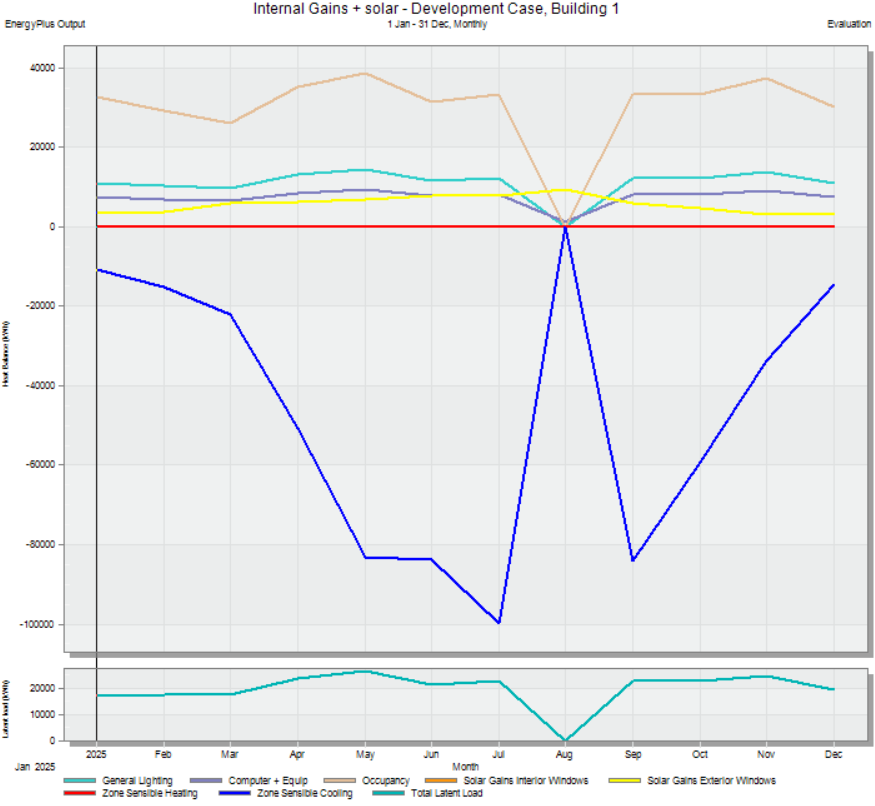
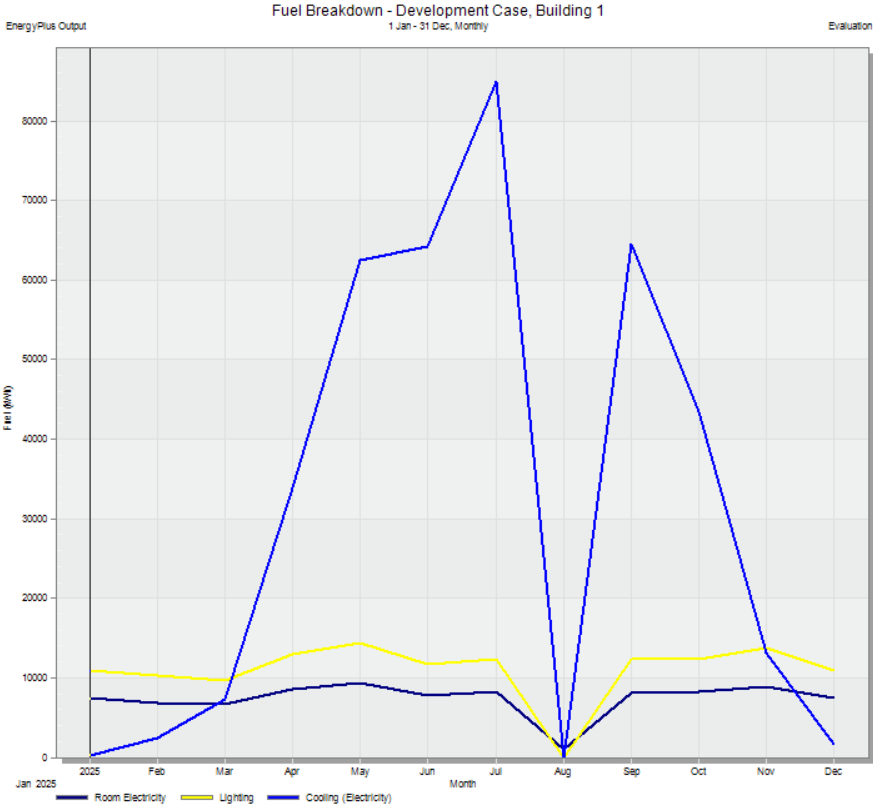
In general, the energy consumption of the Base Case model increased during summer, particularly in May, June, July, and August, due to increased solar irradiation. In August, electricity consumption decreased from 30,485.67 kWh in the Base Case to 23,142.71 kWh in the Development Case, corresponding to a reduction of approximately 24.1%. These results confirm the effectiveness of the integrated green infrastructure strategy in reducing building energy consumption. The simulated internal-gain and fuel-consumption indicators for the Base Case are summarized in Table 9.
Table 9. Summary of simulated energy performance indicators for the base case scenario (kWh)
|
Base Case |
|
|
Internal Gains (kWh) |
|
|
Recorded Data (Average of the months, kWh) •General Lighting: 10978 kWh •Computer + Equip: 8190.78 kWh •Solar Gains Interior windows: 15 kWh •Solar Gains Exterior windows: 36802 kWh •Zone Sensible Cooling: 62549 kWh •Total Latent Load: 19369 kWh |
|
|
Fuel breakdown (kWh) |
|
|
Recorded Data (Average of the months, kWh) •Room Electricity: 7382 kWh •Lighting: 10978 kWh •Cooling (Electricity): 38497 kWh |
|
|
Fuel totals (kWh) |
|
|
Recorded Data (Average of the months, kWh) Fuel Totals: 56857 kWh |
|
Table 10. Summary of simulated energy performance indicators under green infrastructure implementation
|
Development Case |
|
|
Internal Gains (kWh) |
|
|
Recorded Data (Average of the months, kWh) •General lighting: 10,978 kWh •Computer and equipment gains: 8,190.78 kWh •Solar gains through interior windows: 15 kWh •Solar gains through exterior windows: 36,802 kWh •Zone sensible cooling: 62,549 kWh •Total latent load: 19,369 kWh |
|
|
Fuel breakdown |
|
|
Recorded Data (Average of the months, kWh) •Room Electricity: 7371kWh •Lighting:10961kWh •Cooling (Electricity): 31539 kWh |
|
|
Fuel Totals |
|
|
Recorded Data (Average of the months, kWh) Fuel Totals: 45,872 kWh |
|
9.2 Development Case: Green infrastructure scenarios - treatment description
An example of an integrated sustainable design strategy is the Development Case, which employs a range of green infrastructure strategies to enhance environmental performance, reduce carbon emissions, and
improve indoor and outdoor thermal comfort. This treatment transcends single-measure interventions by incorporating passive and nature-based remedies into a comprehensive design framework.
9.3 Thermal comfort results
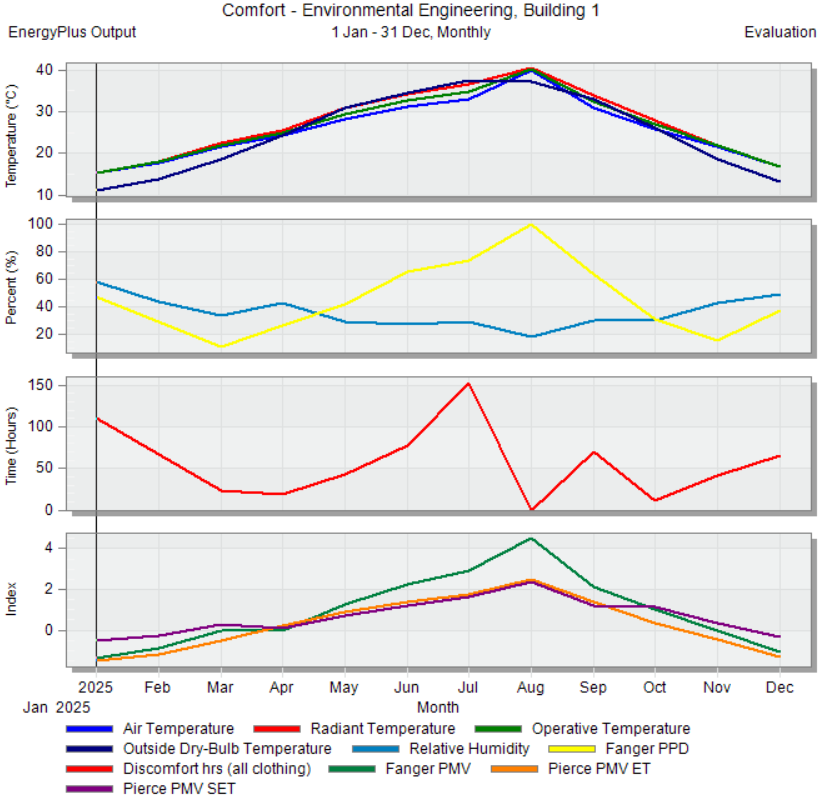
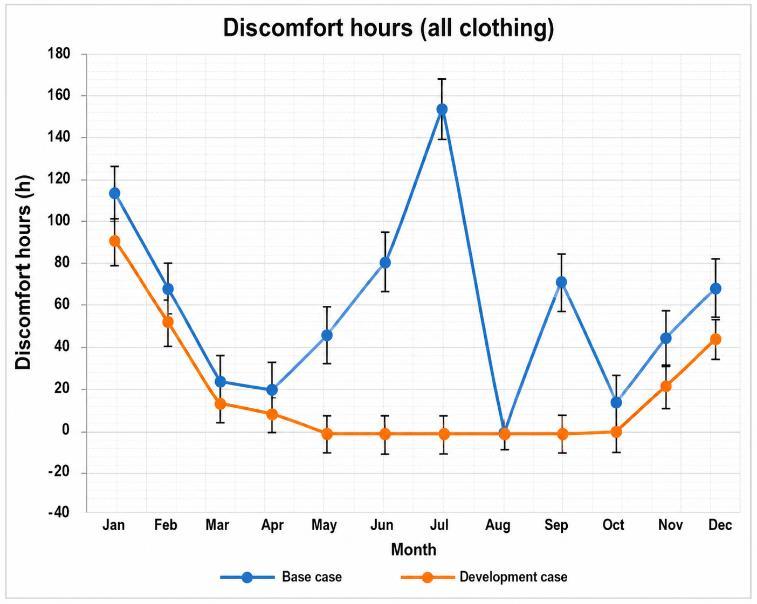
The calculation of the simulation is conducted based on the number of discomfort hours due to over- and under-cooling, as well as unhealthy relative humidity, according to ASHRAE 55-2004. As seen in Figure 12, the simulation results showed significant development in the level of thermal comfort bars, where the wall in the Base Case model showed an average of approximately 142 hours of discomfort per year [23].
Figure 14. Properties of the shading device of the building envelope
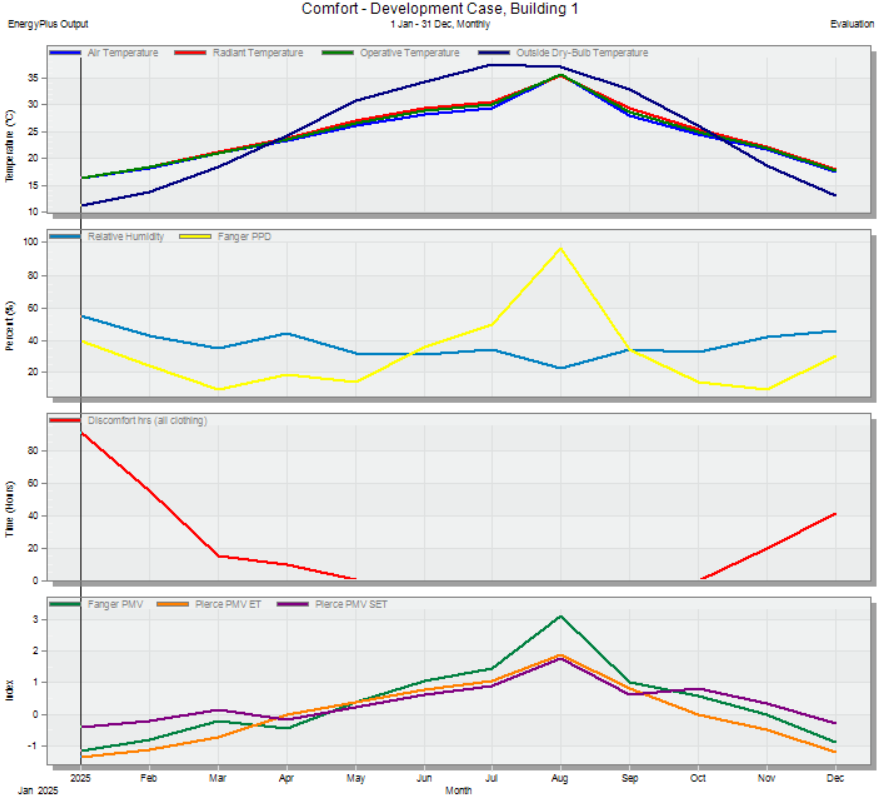
Consequently, the range of an estimated average PMV from -0.5 to +0.5 lies within the ASHRAE thermal comfort zone and represents a thermally acceptable environment for the population in question. On the other hand, the Iraqi code provides a wider comfort tolerance, especially for naturally ventilated buildings, considering the climatic conditions and "human adaptation." This allows for higher indoor temperatures during the summer cooling period for the hot-dry climate. Figure 13 reveals that the range of PMV results in the base case wall (-1.8 to 1.7) is outside the comfort range. On the other hand, Figures 14-16 depict how the mean result of the innovative model falls within a range of (-1.1 to 0.7). This analysis clearly proves that these alternative wall techniques meet the accepted comfort range and provide an overall enhancement.
Figure 15. Sun path diagram illustrating solar exposure on building envelope and landscape areas
Figure 16. Predicted mean vote (PMV) for the Base Case and Development Case
Table 11. Thermal comfort indicator results for base and development scenarios
|
Base Case |
|
|
Thermal Comfort |
|
|
Recorded Data (August: Hottest Month of the Year) •Operative temperature: 40.14 ℃ •Relative humidity: 29.27% •Fanger PMV: 2.89 •Fanger PPD: 74.26% |
|
|
CO₂ Emissions (kg) |
|
|
Annual CO₂ Emissions: Base Case versus Development Case |
Annual CO₂ emissions in the Development Case: 27,805 kg/year |
|
Development case |
|
|
Recorded Data (August): Hottest Month all over the year •Operative Temperature: 30.03 ℃ •Relative Humidity: 34.11% •Fanger PMV: 1.43 •Fanger PPD: 49.53 |
|
|
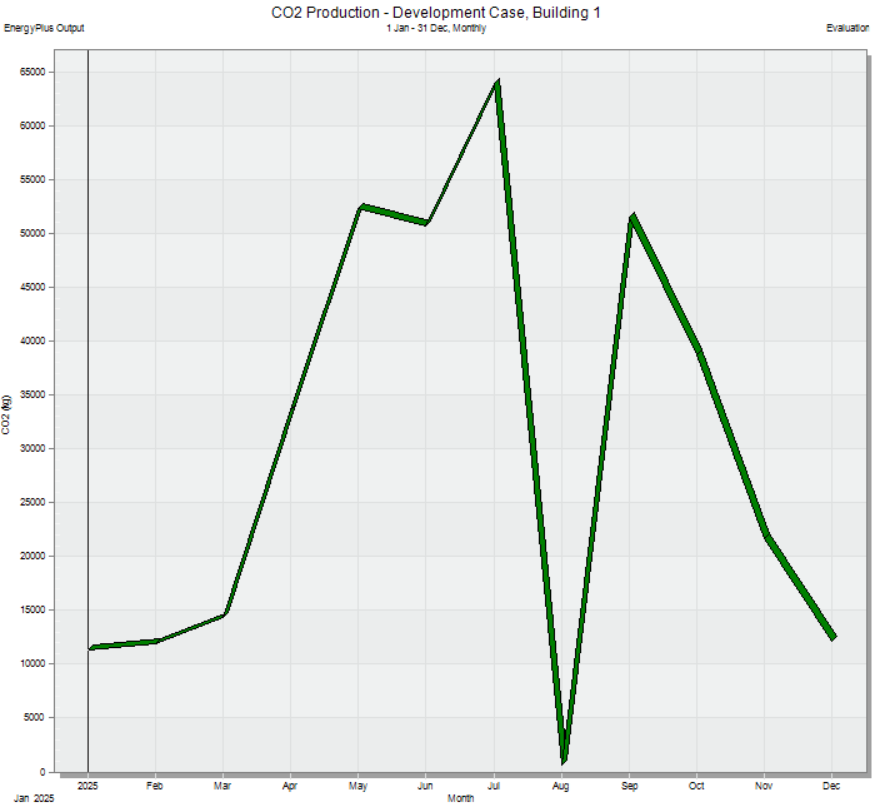
Monthly CO₂ Emissions – Development Case (kg) |
|
|
Recorded Data (Average of the months) kWh CO2 Emissions: 27,805 kg |
|
9.4 Fanger predicted mean vote
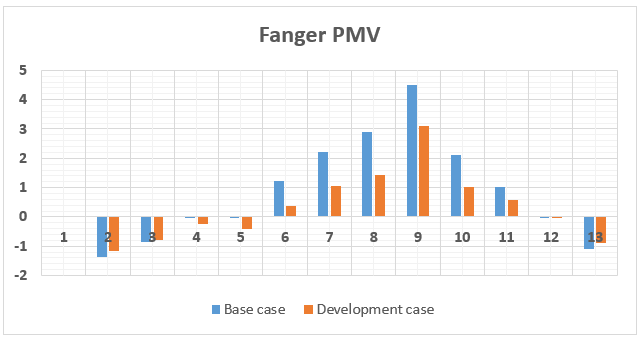
The commonly used technique in assessing human thermal comfort in built environments is through predicted mean vote (PMV) indices that vary from -3.0 to +3.0 on the scale, -3.0 representing cold and +3.0 representing hot. The analysis examines how the suggested "Development Case" affects thermal comfort levels over 13 different time periods. The main indicator that forecasts the average response of a sizable population based on the ASHRAE thermal sensation scale is the PMV index. The Base and Development instances in this case differ very little from one another. This implies that the building's performance during cold periods is not greatly impacted by the planning strategy, which was probably centered on shading or cooling.
Significant Heat Mitigation: Peak heat periods (6-11) are when the Development Case has the greatest detrimental effects. The intervention shifts the environment from a "beyond hot" level to a more bearable, but still warm, sensation by lowering the PMV from +4.5 to +3.1. Note that these values reflect the extreme peak sub-periods within the analysis (periods 6-11), whereas Table 10 reports the Fanger PMV for the hottest single month (August), where the PMV decreases from 2.89 to 1.43 under the Development Case. Both sets of values are consistent and complementary: Table 10 captures monthly peak thermal stress, while Table 11 captures the most extreme sub-period intervals. Comfort Range Gap: Standard comfort levels (ASHRAE 55) are generally characterized as a PMV between -0.5 and +0.5, even if the Development Case is an improvement. In order to achieve "Class A" comfort standards, more cooling or shading techniques might be required, as the Development Case continues to be above this threshold during peak hours.
The comparative thermal-comfort performance of the Base Case and the Development Case, based on the peak Fanger Predicted Mean Vote (PMV), is summarized in Table 12.
Table 12. Comparative performance analysis
|
Feature |
Base Case Analysis |
Development Case Analysis |
|
PMV |
Reaches extreme discomfort at +2.89 in Period 9. |
Successfully lowers peak discomfort to +1.43 in the same period. |
The findings definitely show that, for the majority of the year, the development scenario's discomfort hours were significantly lower than those of the Base Case. According to the Base Case, the number of pain hours peaks during the summer months, especially in July (Month 7), when it reaches about 155 hours, suggesting extreme heat stress. January and September also show elevated discomfort, indicating performance restrictions throughout the cold and transitional seasons.
The Development Case, however, demonstrates a significant improvement. During the hottest summer months (June to August), discomfort hours are almost nonexistent, suggesting that the implemented infrastructure techniques (e.g., better envelope performance, ventilation optimization, shade, and/or green infrastructure integration) have improved thermal performance. With decreases of roughly 15-25% when compared to the standard situation, the winter months also exhibit a noticeable improvement.
Overall, the figure supports the effectiveness of the integrated design strategy by confirming that alternative infrastructure solutions greatly improve indoor thermal comfort performance throughout the year, especially during harsh summer circumstances.
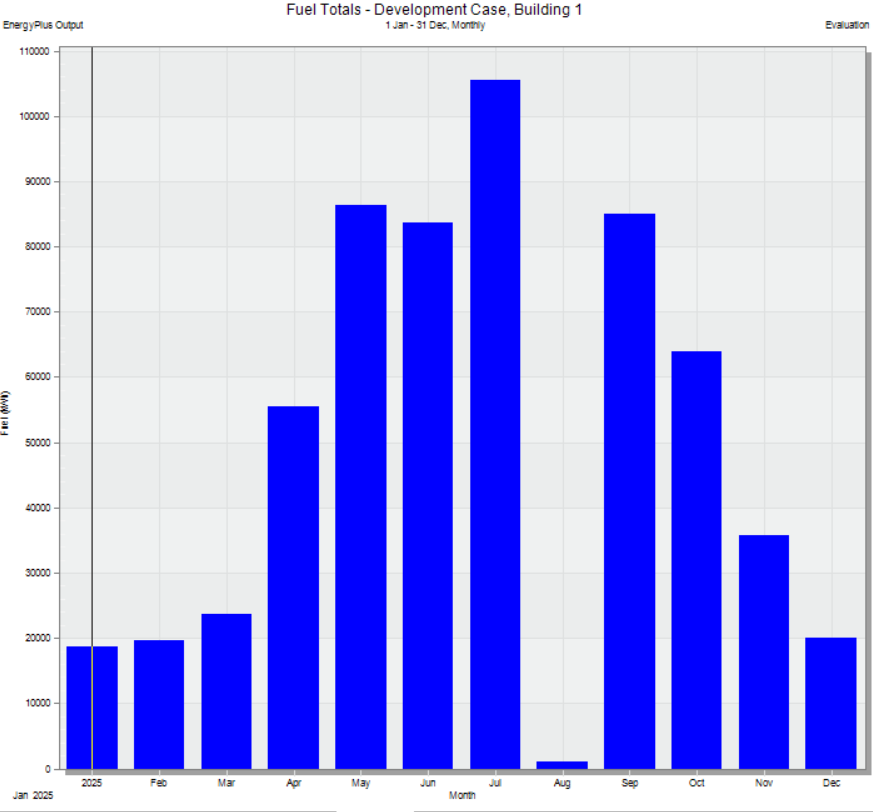
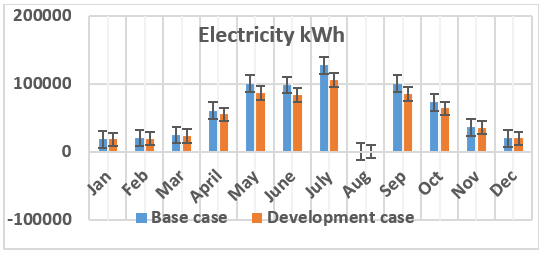
Figure 17 shows the monthly electricity use in kWh for the Base Case and the Development Case, which includes green infrastructure and passive design methods. The simulation results show that electricity demand went down consistently in most months after the new environmental strategies were put into place.
Figure 17. Monthly discomfort hours for the Base Case and Development Case
The considerable drops in electricity use happen during the busiest cooling period, which is from May to September. During this time, the Base Case shows the highest electricity demand, especially in July, when it reaches about 125,000 kWh. In contrast, the Development Case shows a big drop during the same time period (around 105,000 kWh in July), which means there's a clear decrease in the energy needed for cooling. In May, June, and September, similar results are seen, which show that using shading devices, green roofs, better insulation for building envelopes, and natural ventilation really help reduce the heat from the sun and lower the need for mechanical cooling.
Figure 18. Comparison of energy consumption values for the Base Case and alternative infrastructural techniques
The variations in electricity use between the two scenarios are less pronounced but remain noticeable throughout the transitional and winter months (November-March), suggesting increased overall energy efficiency without sacrificing indoor comfort. One example of the cumulative effect of incorporating green infrastructure into environmental planning is the decrease in annual electricity use (Figure 18).
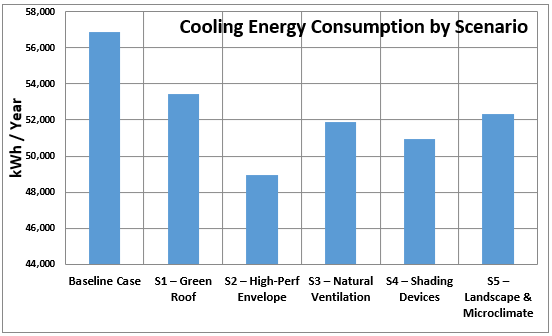
The simulation results demonstrate that all investigated green infrastructure scenarios reduced annual cooling energy consumption relative to the Base Case, although the magnitude of improvement varied among the strategies. The high-performance envelope scenario achieved the greatest reduction, confirming the importance of improving the thermal characteristics of the building envelope under Baghdad’s hot-desert climatic conditions. The shading-device and natural-ventilation scenarios also produced noticeable reductions by limiting solar heat gains and improving passive heat dissipation. The green-roof and landscape–microclimate scenarios provided additional benefits, although their individual effects on annual cooling energy consumption were comparatively smaller. These results indicate that an integrated strategy combining envelope improvement, shading, natural ventilation, green roofs, and landscape measures offers greater environmental performance than applying any single intervention independently, as shown in Figures 19 and 20.
Figure 19. Comparison of energy consumption values for the Base Case and alternative techniques
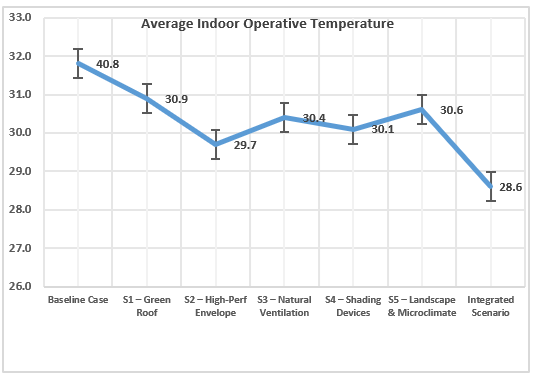
Figure 20. Comparison of indoor operative temperature values for Base Case and alternative techniques
Overall, the DesignBuilder-based evaluation verifies that the development scenario saves a significant amount of energy, especially when temperatures are high. These results emphasize how crucial it is to incorporate passive and nature-based solutions early on in the building and urban design process in order to improve energy efficiency, save operating costs, and encourage low-carbon development plans in hot climates.
The five individual passive design approaches (S1-S5), along with an integrated approach (Integrated Scenario), are compared through the simulation model against the conventional Baseline Case. The objective is to optimize the performance of the building through lowering the amount of cooling energy use, carbon emission, and interior thermal comfort parameters (average operative temperature and predicted mean vote).
The simulation results compare the five individual passive-design scenarios and the integrated Development Case based on annual cooling energy consumption and average indoor operative temperature. The Base-Case scenario showed excessive overheating conditions, with the internal temperature being approximately 40.14 ℃ and a maximum cooling load requirement of 56857 kWh. Such results highlight the environmental challenges faced in areas characterized by arid climate conditions, where buildings are greatly affected by solar radiation.
The green roof solution (S1) indicated that there was an improvement in the energy consumption used for cooling purposes by up to 48,490 kWh among all the examined solutions, as well as a reduction in the internal temperatures up to about 26 ℃. The inference from this is that the planting of plants on the roof increases its insulating capabilities.
By comparing the results with the Case S2 scenario, which depicts the High-Performance Building Envelope scenario, it is evident that there is an improvement in terms of thermal performance and energy consumption. As can be seen from the above graph, under the High-Performance Building Envelope Scenario, the indoor temperature average has fallen to approximately 26 ℃, while the cooling energy consumption has decreased to about 47,200 kWh per annum.
The reduction of cooling demand and temperature inside buildings was greatly improved through the use of natural ventilation (S3). The enhancement in cross-ventilation and airflow enabled effective dispersion of heat storage inside the building.
Maintaining interior temperatures within the range of 28 to 29 ℃, the application of shading devices (S4) showed reasonable energy-saving results, decreasing cooling requirement to approximately 50,940 kWh. The problem of solar radiation on the building façade was effectively reduced through exterior shading, particularly in the afternoon.
Finally, the landscaping intervention (S5) contributed the most modest individual energy savings among the five scenarios, with an annual fuel total of approximately 54,500 kWh — a reduction of about 4.1% compared to the baseline. However, its primary value lies in microclimate improvement: by reducing ambient outdoor temperatures through evapotranspiration and shading of surrounding surfaces, S5 amplifies the effectiveness of the other strategies when combined in the integrated Development Case. This synergistic effect explains why the Development Case (45,872 kWh, 19.3% reduction) outperforms any individual scenario. Table 13 summarizes the individual performance results for all five scenarios (S1-S5) alongside the integrated Development Case and the Baseline, enabling a direct comparison of the incremental contribution of each green infrastructure strategy.
Table 13. Summary of individual green infrastructure scenario performance vs. baseline
|
Scenario |
Description |
Annual Energy Consumption / Fuel Total (kWh) |
Reduction vs. Baseline |
Avg. Indoor Temp. (℃) |
|
Baseline |
Conventional building (no green infrastructure) |
56,857 |
— |
40.14 |
|
S1 - Green Roof |
Vegetated roof system |
48,490 |
14.7% |
~26.0 |
|
S2 - High-Performance Envelope |
Improved insulation and glazing |
47,200 |
16.9% |
~25.5 |
|
S3 - Natural Ventilation |
Operable windows with control logic |
53,200 |
6.4% |
~28.5-29.5 |
|
S4 - Shading Devices |
External overhangs and fins |
50,940 |
10.4% |
~28.0-29.0 |
|
S5 - Landscape Integration |
Trees, permeable surfaces, shaded courtyards |
54,500 |
4.1% |
~29.5-30.5 |
|
Development Case (All S1-S5) |
Integrated green infrastructure |
45,872 |
19.3% |
~24.5 |
The findings of the simulation showed a significant decrease in the number of hours of annual discomfort, especially during the peak of the summer season when the risk of overheating typically runs highest. When compared to the base scenario, both the combined scenarios demonstrated significant improvements in adaptive comfort performance, decreased cooling loads, and stable operating temperatures. Such improvements indicate the efficiency of green infrastructure as a quantifiable performance-based design solution as well as an environmental enhancement technique.
Additionally, by objectively evaluating infrastructural techniques, the DesignBuilder simulations confirmed that green infrastructure improves microclimatic efficiency, reduces energy consumption, and minimizes the effects of urban heat islands. The important role of an integrated planning approach has been proven by the findings that the combined use of multiple techniques achieved greater improvement in performance than separate approaches.
The findings highlight the importance of implementing green infrastructure in the beginning stages of construction in order to achieve maximum energy, thermal, and environmental advantages from the viewpoint of environmental development. The study also emphasizes how simulation-based decision-making tools could encourage evidence-based policy advancement and direct sustainable urban development.
According to DesignBuilder simulations, this study demonstrates that integrating green infrastructure into building and urban design significantly improves microclimatic performance, energy efficiency, and environmental sustainability. Compared with the Base Case, annual energy consumption was reduced by approximately 19.3%, from 56,857 kWh to 45,872 kWh, while peak cooling loads were reduced by up to 25%. Annual CO₂ emissions decreased from 34,455 kg in the Base Case to 27,805 kg in the development case, representing a reduction of approximately 19.3%. Furthermore, green infrastructure improved local thermal comfort and helped mitigate urban heat island effects by reducing outdoor surface temperatures by approximately 2-4 ℃. Furthermore, green infrastructure improved local thermal comfort and mitigated the effects of urban heat islands by reducing outdoor surface temperatures by 2-4 ℃.
In general, including green infrastructure using performance-based environmental planning frameworks is a practical way to create built environments that are resilient, low-carbon, and thermally comfortable—especially in hot climates.
Furthermore, according to the simulation research, green infrastructure improves indoor environmental quality by lowering indoor temperatures by 1-2 ℃ during the hottest summer months, improving occupant comfort without the need for additional mechanical cooling. These results demonstrate how nature-based solutions can be included to create low-carbon, climate-adaptive, and energy-efficient urban settings.
Additionally, the study illustrates the benefits of integrating DesignBuilder-based modelling tools with urban environmental design, enabling a methodical, data-driven strategy for improving the efficiency and design of green infrastructure. The results supply governments, architects, and urban planners with helpful suggestions, highlighting the importance of integrating green infrastructure strategically and with simulation knowledge to build livable, sustainable, and resilient cities in the face of climate change.
Adopt environmentally friendly infrastructure. Architects and urban planners should strategically incorporate vegetated landscapes, green walls, and green roofs into building and city plans to enhance microclimates and optimize energy efficiency.
Use Simulation-Based Planning Tools: To enable data-driven design choices, performance evaluation of green infrastructure should be conducted prior to deployment using DesignBuilder or similar environmental simulation tools.
Support for Policies and Incentives: Governments and local governments should provide policies and incentives that promote the use of green infrastructure, especially in urban areas with high population densities or energy use.
Climate-Adaptive Design: In order to optimize the benefits of thermal comfort, water management, and urban heat island mitigation, green infrastructure layout needs to take into consideration the climate of the region, building orientation, and urban morphology.
Analysis and Continual Enhancement. To validate simulation results and improve the long-run green infrastructure designs, following the implementation inspection of the natural environment and energy performance is strongly recommended.
The inclusion of Sustainable Urban Planning: To achieve the goal to establish adaptable, low-carbon cities, environmentally friendly infrastructure ought to form an important part in future urban development plans, along with energy-efficient envelopes for construction and renewable energy initiatives.
The incorporation of Green Walls: In order to minimize solar heat gain and contribute to reducing peak inside temperatures by 10-15% during the summer, green walls need to be installed on south and west-facing facades.
[1] CIWEM. (2010). Multi-functional urban green infrastructure. A CIWEM Briefing Report, May 2010. Available at: http://www.ciwem.org/resources.
[2] Sandström, U.G. (2009). Urban green spaces for human well-being. In IAIA09 Conference Proceedings: Impact Assessment and Human Well-Being, 29th Annual Conference of the International Association for Impact Assessment. https://www.q-cumber.org/site_media/Qcontents/Qusers/IAIA_Italia/gallery/Qpost_media/1428944383.92.c02c5d779689589a087c4f3af7b2601a.pdf.
[3] Banking on Green. (2012). A look at how green infrastructure can save municipalities money and provide economic benefits community-wide.
[4] Bilgili, B.C., Gökyer, E. (2012). Urban green space system planning. In Landscape Planning, pp. 107-123.
[5] Heisler, G.M. (1986). Energy savings with trees. Journal of Arboriculture, 12(5): 113-125.
[6] Lennon, M. (2015). Green infrastructure and planning policy: A critical assessment. Local Environment, 20(8): 957-980. https://doi.org/10.1080/13549839.2014.936843
[7] Lafortezza, R., Davies, C., Sanesi, G., Konijnendijk, C.C. (2013). Green Infrastructure as a tool to support spatial planning in European urban regions. iForest-Biogeosciences and Forestry, 6(3): 102. https://doi.org/10.3832/ifor0723-006
[8] Mell, I.C. (2008). Green infrastructure: Concepts and planning. FORUM Journal, Newcastle University, UK, 8(1): 69-80.
[9] Halder, N., Kumar, M., Deepak, A., et al. (2025). The role of urban greenery in enhancing thermal comfort: Systematic review insights. Sustainability, 17(6): 2545. https://doi.org/10.3390/su17062545
[10] van Oorschot, J., Slootweg, M., Remme, R.P., Sprecher, B., van der Voet, E. (2024). Optimizing green and gray infrastructure planning for sustainable urban development. NPJ Urban Sustainability, 4(1): 41. https://doi.org/10.1038/s42949-024-00138-3
[11] D’Ambrogi, S., Guccione, M. (2021). Multifunctional ecological networks as framework for landscape and spatial planning in Italy. In Urban Services to Ecosystems: Green Infrastructure Benefits from the Landscape to the Urban Scale, pp. 265-278. https://doi.org/10.1007/978-3-030-54375-3_12
[12] Zhou, J., Fang, Z., Yin, G., et al. (2025). Automated roof segmentation for assessing urban-scale energy performance and indoor thermal environment of photovoltaic and green roofs. Energy, 338: 138958. https://doi.org/10.1016/j.energy.2025.138958
[13] Fang, Y., Du, X., Zhao, H., Hu, M., Xu, X. (2023). Assessment of green roofs' potential to improve the urban thermal environment: The case of Beijing. Environmental Research, 237: 116857. https://doi.org/10.1016/j.envres.2023.116857
[14] Mutani, G., Todeschi, V. (2020). The effects of green roofs on outdoor thermal comfort, urban heat island mitigation and energy savings. Atmosphere, 11(2): 123. https://doi.org/10.3390/atmos11020123
[15] Lei, K.T., Tang, J.S., Chen, P.H. (2019). Numerical simulation and experiments with green roofs for increasing indoor thermal comfort. Journal of the Chinese Institute of Engineers, 42(4): 346-356. https://doi.org/10.1080/02533839.2019.1585207
[16] Joshi, M.Y., Teller, J. (2021). Urban integration of green roofs: Current challenges and perspectives. Sustainability, 13(22): 12378. https://doi.org/10.3390/su132212378
[17] Austin, G. (2014). Green Infrastructure for Landscape Planning: Integrating Human and Natural Systems. Routledge.
[18] McDonald, R.I. (2015). Conservation for Cities: How to Plan and Build Natural Infrastructure. Island Press.
[19] Naser, I.H., Salih, B.M.M., Al-Obaidy, N.K., Hussein, H.A.M. (2026). Life cycle cost analysis and life cycle assessment program in pavement maintenance management: A critical review. AIP Conference Proceedings, 3379: 050038. https://doi.org/10.1063/5.0306270
[20] Georgiev, G., Gaydarova, E., Georgiev, Z., et al. (2025). Compendium on the Green Transition to Affordable and Clean Energy in Buildings, Sustainable Cities and Climate Resilience for Architecture Students. Zenodo. https://doi.org/10.5281/zenodo.17611594
[21] Climate Baghdad: Temperature, climate graph, climate table for Baghdad. Climate Data. https://en.climate-data.org/.
[22] He, Y., Chen, Y., Chen, Z., Deng, Z., Yuan, Y. (2022). Impacts of occupant behavior on building energy consumption and energy savings analysis of upgrading ASHRAE 90.1 energy efficiency standards. Buildings, 12(8): 1108. https://doi.org/10.3390/buildings12081108
[23] Pereira, P.F.D.C., Broday, E.E. (2021). Determination of thermal comfort zones through comparative analysis between different characterization methods of thermally dissatisfied people. Buildings, 11(8): 320. https://doi.org/10.3390/buildings11080320