Effects of Low-Salinity Condition on Water Quality and Phytoplankton Community in Biofloc-Based Litopenaeus vannamei Culture Ponds

Alfina Pagita Larasati | Mohammad Mahmudi* | Asus Maizar Suryanto Hertika | Mohammad Musa | Sunadji | Evellin Dewi Lusiana
© 2026 The authors. This article is published by IIETA and is licensed under the CC BY 4.0 license (http://creativecommons.org/licenses/by/4.0/).
OPEN ACCESS
The biofloc technology (BFT) is increasingly used in intensive Litopenaeus vannamei aquaculture to improve water quality, shrimp health, and system sustainability by promoting microbial biomass. This study evaluated the effect of low-salinity conditions on water quality characteristics and phytoplankton community dynamics in biofloc-based whiteleg shrimp culture ponds over a 90-day culture period. Temperature, transparency, dissolved oxygen, salinity, nitrate, ammonia, total organic matter (TOM), phytoplankton composition, species turnover, and community stability were assessed at 30-day intervals. Results showed that ammonia (0.067 ± 0.044 vs 1.114 ± 0.753 mg L-1; p-value = 0.009) and transparency (18.08 ± 3.77 vs. 37.21 ± 7.93 cm; p-value = 0.000) differed significantly between low and normal salinity conditions, while nitrate and TOM were also lower under low salinity. Bacillariophyceae dominated the phytoplankton community in both conditions, with total abundances ranging from 25,000 to 78,588 cells L-1, which can be considered as high for BFT ponds. The low-salinity ponds supported a greater phytoplankton assemblage (five classes) with lower mean species turnover (0.21 vs. 0.25) and markedly higher community stability (4.40-5.28 vs. 1.82-2.75) compared to the normal-salinity ponds. These findings demonstrate that low-salinity BFT systems may support physicochemical and biological stability.
aquatic ecosystem, environmental dynamics, inland waters, microbial community, sustainable aquaculture
Litopenaeus vannamei, or whiteleg shrimp, is widely recognized as a leading species in the global shrimp aquaculture industry, accounting for 84.9% of total shrimp production [1]. This species has several advantages, including its broad adaptability, rapid growth, and tolerance to salinities ranging from 0 to 40 (euryhaline), all of which contribute to its dominance in the industry [2, 3]. Originating from the eastern Pacific Ocean, whiteleg shrimp are among the most widely cultivated and commercially valuable shrimp globally [4].
With the increasing global demand for whiteleg shrimp, most producers are increasingly using intensive aquaculture systems with high stocking densities to maximize production yields [5]. However, the system is heavily criticized for decreasing water quality in aquaculture ponds and adjacent water bodies and increasing the difficulty in disease control [6, 7]. One of the primary concerns in intensive systems is the accumulation of organic matter from feed residues and metabolic waste associated with high shrimp biomass [8, 9]. Therefore, the success of intensive shrimp farming depends heavily on effective water quality management strategies.
Water quality plays a critical role in successful whiteleg shrimp culture, particularly under intensive conditions. High stocking density significantly degrades aquaculture water quality parameters, including dissolved oxygen, and elevated ammonia and nitrate levels can impair growth performance [10]. To overcome the issue, biofloc technology (BFT) is applied in intensive aquaculture systems [11]. The technology works by adjusting the carbon-nitrogen ratio through the addition of organic carbon sources, which promotes microbial biomass to absorb harmful nitrogen molecules into biofloc particles [12]. The biofloc system further contributes to a stable nutrient budget and disease resistance in culture species [13].
Phytoplankton communities in aquaculture ponds serve as sensitive biological indicators of water quality conditions, responding rapidly to changes in nutrient availability, salinity, and organic matter dynamics within the culture system [14, 15]. In the BFT systems, organic compounds in the water column create conditions that selectively shape phytoplankton community structure and succession throughout the culture period [16]. Salinity is one of the primary environmental filters governing phytoplankton species assemblages, with community composition, diversity, and stability varying significantly along salinity gradients [17, 18]. A stable and diverse phytoplankton community reflects balanced nutrient cycling and reduced risk of harmful algal proliferation, serving as a key indicator of pond health in an intensive shrimp culture system [19].
In addition to management, salinity remains a crucial factor affecting shrimp culture performance, particularly in biofloc-based systems. Low-salinity conditions represent a promising advancement for expanding shrimp farming into inland areas [20]. Several studies have successfully adopted this technology in nursery and grow-out culture of shrimp at low salinities of 4-16 ‰ [21-23]. Furthermore, low-salinity conditions in the BFT system have been reported to confer biosecurity advantages by suppressing pathogenic Vibrio species [24]. However, changes in salinity can influence floc formation and microbial activity, making the characterization of water quality dynamics under low-salinity conditions an important area of investigation. Therefore, this study aimed to compare the water quality characteristics and phytoplankton community dynamics, including community structure, species turnover, and community stability, between normal- and low-salinity biofloc-based Litopenaeus vannamei culture ponds under the experimental conditions evaluated in this study.
2.1 Study area and experimental design
The study was conducted in the Brackish Water and Marine Fisheries Laboratory in Probolinggo City, Indonesia. Three BFT ponds with a diameter of two meters and a stocking density of 500 shrimp per square meter were used for the research. The normal- and low-salinity BFT systems were evaluated during two consecutive culture periods (2024-2025) and 2025-2026. Both systems span the full culture period of up to 90 days, and the experimental design is depicted in Figure 1.
(a)
(b)
Figure 1. (a) Map of research location in Probolinggo City, Indonesia, (b) conceptual experimental design
The aquaculture water was sterilised using 30 mg L-1 chlorine and neutralised using 30 mg L-1 sodium thiosulfate [24]. Before stocking, 7-day-old shrimp larvae were gradually acclimatized from 32 ppt to 14 ppt over 14 days. For the low-salinity method, the artificial seawater was formulated by combining dechlorinated tap water with bittern (salt) to obtain a salinity of 14-15 ppt.
Routine husbandry was consistently applied during the culture period. Shrimp were fed twice daily during days of culture (DOC) 0-10, three times daily during DOC 11-20, and four times daily during DOC 21-90 at 07:00, 12:00, 16:00, and 20:00. Each 2 m pond was aerated 24 h a day using 11 stones connected to an HP200 blower. Water exchange occurred when feed consumption declined, or ammonia buildup was suspected, usually every two days. Mortality was checked during siphoning and water exchange, and dead shrimp were removed when seen.
2.2 Water quality parameters measurement
The water quality parameters evaluated in this study comprised both physical and chemical aspects, including temperature (℃), water transparency (cm), pH, dissolved oxygen (DO, mg L-1), salinity (ppt), nitrate (mg L-1), ammonia (mg L-1), and total organic matter (TOM, mg L-1). All measurements were obtained from water samples collected directly at the research site throughout the study period.
In situ measurements of temperature, dissolved oxygen, pH, and salinity were conducted with a Water Quality Meter (AZ 86031), while water transparency was evaluated using a Secchi disk. The levels of nitrate, ammonia, and TOM were analyzed ex-situ. Ammonia concentrations were determined with the phenate method at 640 nm, detecting as low as 0.01 mg L⁻¹. Nitrite was measured spectrophotometrically via the diazotization method at 543 nm, with a detection limit of 0.001 mg L⁻¹. Nitrate levels were assessed using the cadmium reduction method at 543 nm, with a minimum detection limit of 0.01 mg L⁻¹. TOM was analyzed using the permanganate oxidation method in accordance with standard protocols.
2.3 Phytoplankton observation
A 5 L water sample for phytoplankton analysis was collected using a plankton net with a mesh size of 25 μm, placed in a 30 mL film bottle, and fixed with 4% Lugol's solution. Water samples were collected from the center of each pond at moderate depths to obtain representative samples, as continuous aeration promoted relatively uniform water mixing within the ponds. Phytoplankton observations were conducted using an Olympus CX31 binocular microscope at 100-400X magnification. Morphological identification was based on the Prescott and Davis identification book, while phytoplankton abundance was calculated using a modification of the Lackey Drop Microtransect Counting Method formula as follows [25].
$N=n.\frac{{{V}_{r}}}{{{V}_{0}}}.{{V}_{s}}$
where, N denotes the phytoplankton abundance c (cells L-1), n is the number of observed cells, V0, Vr, and Vs are the volume of sampled under cover glass water (mL), volume of filtered/concentrated water in the sample bottle (mL), and total volume of water filtered in the field (L), respectively.
2.4 Floc formation
Carbon was applied to the culture ponds to stimulate floc formation throughout the rearing period. Commercial molasses derived from Saccharum officinarum was used as the external carbon source. Carbon supplementation was administered once daily in accordance with the study [25], maintaining a C:N ratio of 15:1. Based on this ratio, approximately 6 g of carbon is required to convert 1 g of total ammonia nitrogen (TAN) into bacterial biomass. When ammonia concentrations in the ponds exceeded 1 mg L-1, molasses was added in the calculated amount. Before application, the molasses was dissolved in pond water and subsequently distributed into each pond after feeding, ensuring synchronisation between carbon input and peak nitrogen levels from feed, thereby minimising temporary increases in TAN [26].
2.5 Data analysis
A descriptive analysis was conducted to report on water quality characteristics and the phytoplankton community. Meanwhile, a linear mixed-effects model was used to assess differences in water quality variables between normal- and low-salinity ponds due to the existence of repeated measurements of the observed pond at four DOC levels using the lmer function in the R package “lmerTest”. Additionally, several metrics, such as species turnover rate and community stability, implemented in the community_stability function in the R package "codyn", were used to measure and compare the temporal variation and stability of the phytoplankton community in the BFT ponds. More details about these methods can be found in the study [27].
3.1 Water quality measurement results
The water quality dynamics in the normal and low-salinity BFT systems during the 90-day culture period are presented in Figure 2. It can be seen that the low-salinity condition exhibited lower ammonia, nitrate, salinity, and transparency values than the normal-salinity system. In contrast, the temperature, pH, and DO observations for both systems are quite similar descriptively, but need further statistical analysis. Meanwhile, the TOM concentrations fluctuate across culture periods and systems.
Figure 2. Water quality measurement results for normal and low salinity biofloc technology (BFT) ponds
Table 1. Statistical comparison using linear mixed-effect models of water quality parameters between normal and low salinity conditions in biofloc technology (BFT) ponds
|
Parameter |
Normal |
Low |
F-Statistic Condition |
p-Value Condition |
F-Statistic DOC |
p-Value DOC |
F-Statistic Condition × DOC |
p-Value Condition × DOC |
|
Temperature (℃) |
30.18 ± 1.22 |
28.62 ± 0.52 |
34.46 |
<0.001 |
3.62 |
0.036 |
6.26 |
0.005 |
|
Transparency (cm) |
37.21 ± 7.93 |
18.08 ± 3.77 |
61.21 |
<0.001 |
0.94 |
0.444 |
1.61 |
0.227 |
|
pH |
8.00 ± 0.10 |
7.96 ± 0.61 |
0.09 |
0.784 |
4.93 |
0.019 |
6.70 |
0.007 |
|
Salinity (ppt) |
23.12 ± 5.48 |
13.15 ± 0.68 |
82.58 |
<0.001 |
63.54 |
<0.001 |
60.20 |
<0.001 |
|
DO (mg L⁻¹) |
9.04 ± 1.09 |
9.36 ± 1.46 |
0.74 |
0.439 |
12.45 |
<0.001 |
13.79 |
<0.001 |
|
Nitrate (mg L⁻¹) |
2.074 ± 3.613 |
0.157 ± 0.057 |
5.00 |
0.089 |
4.29 |
0.028 |
4.35 |
0.027 |
|
Ammonia (mg L⁻¹) |
1.114 ± 0.753 |
0.067 ± 0.044 |
11.48 |
0.028 |
7.42 |
0.005 |
6.07 |
0.009 |
|
TOM (mg L⁻¹) |
62.14 ± 58.20 |
27.13 ± 27.80 |
58.53 |
<0.001 |
79.95 |
<0.001 |
36.15 |
<0.001 |
Note: DOC = days of culture; DO = dissolved oxygen; TOM = total organic matter.
Furthermore, Table 1 presents the mean and standard deviation, as well as linear mixed-effect results for comparing water quality observation values between the normal- and low-salinity systems within the studied BFT ponds over culture cycles. It is evident that the pattern of temperature, pH, salinity, DO, the concentrations of nitrate, ammonia, and TOM differ significantly over time between the normal- and low-salinity systems (condition) at the 5% significance level (p-value < 0.05). Meanwhile, the transparency differs significantly between the two system conditions, regardless of the DOC.
Ammonia concentrations in low salinity ponds (0.067 ± 0.044 mg L-1) were significantly lower than those in normal salinity ponds (1.114 ± 0.753 mg L-1) (p-value = 0.009), indicating that low salinity conditions contribute to more effective ammonia control in the biofloc system. Ammonia, a product of protein catabolism, is excreted through shrimp gills and is toxic even at low concentrations, especially in the form of non-ionised ammonia [28]. The lower ammonia concentration in the low-salinity ponds may reflect more effective nitrogen control under the tested BFT condition [29, 30]. Nitrate concentrations also tended to be lower in the low-salinity ponds (0.157 ± 0.057 mg L-1) than in the normal-salinity ponds (2.074 ± 3.613 mg L-1) (p-value = 0.027). The lower nitrate concentrations in the low-salinity ponds suggest more efficient nitrogen cycling. As nitrate is the end product of ammonia oxidation, its limited accumulation may indicate rapid uptake by phytoplankton communities, as well as potential nitrogen cycles within biofloc aggregates [30, 31].
On the other hand, TOM in low salinity ponds (1.1-75.84 mg L-1) was substantially lower than in normal salinity ponds (16.32-173.8 mg L-1) (p-value ≤ 0.001). While a certain amount of TOM is required to support biological processes in pond ecosystems, excessive accumulation of organic matter can lead to oxygen depletion and anaerobic conditions [32]. Moreover, water transparency was significantly lower in the low-salinity ponds (10-25 cm) than in the normal-salinity ponds (25-55 cm). While reduced transparency is often associated with elevated suspended solids, within biofloc systems, this condition generally reflects higher concentrations of biofloc aggregates and microbial biomass in the water column [33]. In the low-salinity ponds, the higher abundance of suspended biofloc particles likely promoted nutrient uptake and organic matter recycling, as reflected in lower concentrations of ammonia, nitrate, and TOM [34].
Transparency is a crucial water-quality parameter in whiteleg shrimp aquaculture, as it controls light penetration in the water column and impacts photosynthesis within the system [35]. When transparency drops, less light reaches the organisms, reducing photosynthesis and oxygen production [36]. A decrease in transparency is often driven by the buildup of metabolic waste, uneaten feed, and plankton biomass, all of which increase water turbidity and affect the pond’s ecological balance [37].
3.2 Phytoplankton community structure
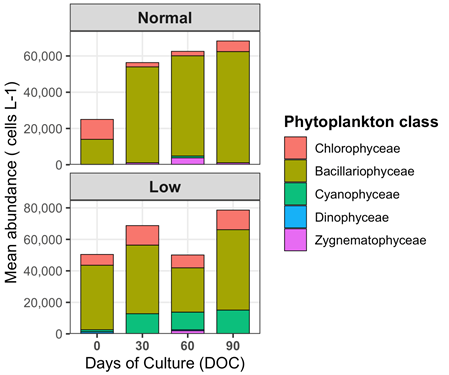
The phytoplankton identification results in the BFT culture ponds (Table A1 and Table A2) revealed five classes across both salinity treatments throughout the observation period. In the normal salinity ponds, the phytoplankton community comprised four classes, namely Bacillariophyceae, Chlorophyceae, Cyanophyceae, and Zygnematophyceae, whereas in the low salinity ponds, five classes were recorded, with the additional presence of Dinophyceae (Figure 3).
Figure 3. Phytoplankton community structure and abundance in the biofloc technology (BFT) pond under normal and low-salinity conditions
Bacillariophyceae dominated the community in both treatments across all observation intervals, consistent with the euryhaline and eutrophic-adapted nature of diatoms as the most competitive phytoplankton group under nutrient-rich conditions characteristic of the BFT systems. The lowest mean abundance of phytoplankton in the normal salinity ponds was recorded for Cyanophyceae (1,000 cells L-1 at DOC 60) and Zygnematophyceae (1,000-3,780 cells L-1), both of which appeared only sporadically across observation intervals. In the low salinity ponds, Dinophyceae recorded the lowest mean abundance (655 cells L-1 at DOC 60), while Bacillariophyceae consistently recorded the highest abundance across all intervals, peaking at 51,082 cells L-1 at DOC 90. The highest mean total community abundance was recorded at DOC 90 in the low salinity ponds (78,588 cells L-1), whereas in the normal salinity ponds, the peak was similarly recorded at DOC 90 (68,274 cells L-1). Based on the total mean abundance range observed across both treatments (25,000-78,588 cells L-1), the pond water in this study can be categorized as eutrophic throughout the culture period. According to the study [38], water with a total phytoplankton abundance exceeding 15,000 cells L-1 is classified as eutrophic, a condition that is inherently promoted by the nutrient-rich environment generated through organic matter decomposition and microbial activity within the biofloc matrix [39].
Bacillariophyta represent one of the most diverse groups of autotrophic algae, occurring in a wide range of freshwater, brackish, and marine environments worldwide. Their ecological success is largely attributed to their high nutrient-use efficiency, rapid growth, and strong adaptive capacity under varying environmental conditions [40]. The dominance of Bacillariophyceae observed in the present study likely reflects traits that enable diatoms to outcompete other phytoplankton groups under high-nutrient conditions [41]. As biofloc communities mature, heterotrophic assimilation and nutrient recycling alter nutrient availability within the water column, creating favourable conditions for diatom proliferation [5]. Consequently, the predominance of Bacillariophyceae indicates a close ecological relationship between biofloc development and phytoplankton succession, highlighting the role of biofloc-mediated nutrient dynamics in shaping community structure within intensive BFT.
Differences in phytoplankton abundance observed across sampling intervals in both treatments reflect the dynamic interplay between nutrient availability and physical conditions within the BFT system [42]. Phytoplankton growth is primarily governed by the availability of dissolved inorganic nitrogen, particularly nitrate and ammonia, as well as light penetration through the water column [43, 44]. The low water transparency recorded in the low salinity ponds (10-25 cm) indicates greater light attenuation attributable to the higher density of suspended biofloc particles, yet total phytoplankton abundance remained high and peaked at DOC 90 (78,588 cells L-1), suggesting that continuous nutrient regeneration through biofloc-mediated organic matter decomposition compensated for reduced light availability [45]. The abundance and composition of phytoplankton in shrimp ponds serve as sensitive biological indicators of water quality and culture environment conditions [30].
3.3 Phytoplankton community turnover rate and stability
Phytoplankton communities in the two systems exhibited distinct turnover rates throughout the cultivation period (Figure 4). In the ponds with normal salinity, the mean turnover was 0.25, signifying that approximately the mean class-level Bray–Curtis temporal dissimilarity was 0.25 in the normal-salinity ponds and 0.21 in the low-salinity ponds in the subsequent interval. Conversely, the mean turnover in the low-salinity ponds was 0.21. Overall, the lower turnover observed in the low-salinity ponds suggests a more stable phytoplankton community structure, characterized by reduced species replacement over time.
(a)
(b)
Figure 4. (a) Class-level Bray-Curtis temporal dissimilarity, (b) phytoplankton community stability of low- and normal-salinity biofloc technology (BFT) ponds
The stability of the phytoplankton community also exhibited clear differences among the conditions (Figure 4). Stability values in the low-salinity pond ranged from 4.40 to 5.28, with the highest value recorded at DOC 60. Conversely, community stability in the normal-salinity pond varied only between 1.82 and 2.75. Overall, the phytoplankton community within the low-salinity pond demonstrated a numerically higher community stability compared to that in the normal-salinity pond during the observed period.
Phytoplankton community turnover rates in normal and low salinity ponds fluctuated, with an overall trend of this metric being lower in low salinity ponds. Furthermore, phytoplankton community stability was higher in the low-salinity ponds. Turnover rate reflects the proportion of species replaced between successive sampling periods, with higher values indicating greater temporal variability in community composition. The lower turnover observed in the low-salinity ponds was likely associated with more stable environmental conditions, as indicated by lower ammonia, nitrate, and TOM concentrations, as well as reduced salinity fluctuations, which minimized ecological disturbances and supported the persistence of existing taxa [46]. Environmental conditions influence changes in plankton composition, species, and abundance, which are related to the trophic structure of the waters by phytoplankton groups [47]. Therefore, the relatively stable environmental conditions in the low-salinity ponds likely helped maintain a more consistent phytoplankton community structure throughout the culture period.
Previous studies have demonstrated that phytoplankton biomass and community diversity tend to be higher under low salinity conditions, as reduced osmotic stress allows a broader range of taxa to maintain competitive growth alongside elevated nutrient availability [18] and nutrient concentration functions as a dual regulatory axis governing phytoplankton species assemblages, with green algae and diatoms characteristically dominating under low salinity conditions due to their broad osmotic tolerance [17]. In BFT systems, this salinity-driven community structuring is further mediated by the diverse organic matrix of the biofloc, which modifies dissolved inorganic nutrient availability and selectively favours certain phytoplankton functional groups [39, 48] as reflected in the more diverse, stable, and persistent phytoplankton community observed in the low-salinity ponds of the present study.
This study demonstrated that low-salinity conditions in biofloc-based Litopenaeus vannamei culture ponds gave more favorable water quality parameters. Ammonia, nitrate, TOM, and water transparency showed substantially lower values in the low-salinity ponds. The phytoplankton community in both treatments was consistently dominated by Bacillariophyceae, reflecting the nutrient-rich environment characteristic of BFT systems, with phytoplankton abundance being considerably high throughout the culture period. The low-salinity ponds supported a more diverse phytoplankton assemblage, containing one additional phytoplankton class, comprising five classes, compared to four classes in the normal-salinity ponds, and the mean temporal dissimilarity across the three intervals was lower. This study did not directly measure suspended solids and microbial community composition. Future studies should include these measurements to better explain the processes controlling nutrient and organic matter dynamics in low-salinity BFT ponds.
We sincerely thank Dian Rizkyana for her technical assistance at the Brackish and Marine Water Laboratory, Universitas Brawijaya, during this research. This study did not receive any funding.
|
BFT |
biofloc technology |
|
C:N |
carbon-to-nitrogen ratio |
|
DOC |
days of culture |
|
DO |
dissolved oxygen, mg L⁻¹ |
|
F |
F-statistic |
|
L. vannamei |
Litopenaeus vannamei |
|
N |
phytoplankton abundance, cells L⁻¹ |
|
n |
number of observed phytoplankton cells |
|
P1 |
pond replicate 1 |
|
P2 |
pond replicate 2 |
|
P3 |
pond replicate 3 |
|
p-value |
probability value |
|
pH |
hydrogen ion activity/acidity level |
|
SD |
standard deviation |
|
TAN |
total ammonia nitrogen, mg L⁻¹ |
|
TOM |
total organic matter, mg L⁻¹ |
|
V₀ |
volume of sampled water under the cover glass, mL |
|
Vr |
volume of filtered or concentrated water in the sample bottle, mL |
|
Vs |
total volume of water filtered, L |
|
μ |
micro-prefix, 10⁻⁶, as used in μm |
|
℃ |
degree Celsius |
|
cm |
centimeter |
|
cells L⁻¹ |
cells per liter |
|
g |
gram |
|
h |
hour |
|
L |
liter |
|
mg |
milligram |
|
mg L⁻¹ |
milligram per liter |
|
mL |
milliliter |
|
nm |
nanometer |
|
ppt |
parts per thousand |
|
μm |
micrometer |
Table A1. Genus-level phytoplankton abundance (cells L⁻¹) in biofloc technology (BFT) ponds under normal salinity across days of culture (0, 30, 60, and 90) (P1–P3 = replicates)
|
Class |
Genus |
DOC 0 |
DOC 30 |
DOC 60 |
DOC 90 |
||||||||
|
P1 |
P2 |
P3 |
P1 |
P2 |
P3 |
P1 |
P2 |
P3 |
P1 |
P2 |
P3 |
||
|
Bacillariophyceae |
Achnanthes |
0 |
0 |
0 |
0 |
0 |
0 |
0 |
0 |
10876 |
7757 |
15282 |
14801 |
|
Cyclotella |
12000 |
18000 |
12000 |
28225 |
105918 |
24757 |
0 |
64803 |
37497 |
47941 |
20184 |
61863 |
|
|
Cymbella |
0 |
0 |
0 |
0 |
0 |
0 |
4923 |
0 |
0 |
0 |
0 |
0 |
|
|
Fragilaria |
0 |
0 |
0 |
0 |
0 |
0 |
0 |
0 |
0 |
0 |
0 |
1942 |
|
|
Nitzschia |
0 |
0 |
0 |
0 |
0 |
0 |
39386 |
8452 |
0 |
0 |
14417 |
0 |
|
|
Chlorophyceae |
Chlorella |
15000 |
3000 |
15000 |
3569 |
3340 |
234 |
156 |
5588 |
1614 |
10354 |
5070 |
2145 |
|
Oocystis |
0 |
0 |
0 |
31 |
20 |
0 |
0 |
14 |
6 |
26 |
26 |
9 |
|
|
Polytoma |
0 |
0 |
0 |
0 |
0 |
0 |
0 |
0 |
0 |
0 |
3 |
0 |
|
|
Schroederia |
0 |
0 |
0 |
0 |
0 |
0 |
0 |
2 |
0 |
0 |
0 |
0 |
|
|
Cyanophyceae |
Chroococcus |
0 |
0 |
0 |
0 |
0 |
0 |
0 |
0 |
3000 |
0 |
0 |
0 |
|
Zygnematophyceae |
Cosmarium |
0 |
0 |
0 |
0 |
0 |
3000 |
11340 |
0 |
0 |
0 |
0 |
3000 |
Note: DOC = days of culture.
Table A2. Genus-level phytoplankton abundance (cells L⁻¹) in biofloc technology (BFT) ponds under low salinity across days of culture (0, 30, 60, and 90) (P1–P3 = replicates)
|
Class |
Genus |
DOC 0 |
DOC 30 |
DOC 60 |
DOC 90 |
||||||||
|
P1 |
P2 |
P3 |
P1 |
P2 |
P3 |
P1 |
P2 |
P3 |
P1 |
P2 |
P3 |
||
|
Bacillariophyceae |
Amphipora |
6877 |
1965 |
983 |
983 |
1927 |
1965 |
0 |
1965 |
4912 |
4912 |
1648 |
2151 |
|
Amphora |
982 |
0 |
982 |
0 |
0 |
0 |
0 |
0 |
0 |
3930 |
2746 |
4301 |
|
|
Aulacoseira |
0 |
0 |
0 |
982 |
0 |
0 |
0 |
0 |
0 |
0 |
0 |
0 |
|
|
Chaetopora |
0 |
0 |
0 |
0 |
0 |
0 |
0 |
0 |
0 |
982 |
0 |
0 |
|
|
Cocconeis |
0 |
0 |
0 |
8841 |
0 |
983 |
0 |
0 |
0 |
0 |
0 |
0 |
|
|
Cyclotella |
2947 |
982 |
982 |
982 |
1927 |
982 |
982 |
982 |
982 |
3929 |
0 |
2151 |
|
|
Cymbella |
0 |
0 |
0 |
0 |
964 |
0 |
0 |
0 |
982 |
0 |
549 |
0 |
|
|
Entomoneis |
24559 |
19647 |
21612 |
20629 |
27940 |
19647 |
9824 |
11788 |
22594 |
14735 |
11535 |
14518 |
|
|
Navicula |
10806 |
13753 |
14735 |
9824 |
14452 |
11788 |
8841 |
4912 |
6877 |
19647 |
32407 |
24197 |
|
|
Neidium |
0 |
0 |
0 |
1965 |
1927 |
0 |
0 |
0 |
982 |
982 |
0 |
0 |
|
|
Nitzschia |
982 |
0 |
0 |
0 |
0 |
0 |
3930 |
0 |
0 |
0 |
0 |
0 |
|
|
Skeletonema |
0 |
0 |
0 |
982 |
963 |
0 |
3929 |
0 |
0 |
1965 |
2197 |
3764 |
|
|
Chlorophyceae |
Chlorella |
4912 |
10806 |
4912 |
9824 |
14736 |
8841 |
10806 |
7859 |
5894 |
12771 |
9823 |
14735 |
|
Oocystis |
0 |
0 |
0 |
1965 |
982 |
0 |
0 |
0 |
0 |
0 |
0 |
0 |
|
|
Tetraspora |
0 |
0 |
0 |
982 |
0 |
0 |
0 |
0 |
0 |
0 |
0 |
0 |
|
|
Cyanophyceae |
Microcystis |
0 |
0 |
0 |
0 |
0 |
0 |
0 |
0 |
982 |
0 |
0 |
0 |
|
Lyngbya |
0 |
0 |
0 |
1965 |
982 |
982 |
982 |
0 |
1965 |
2947 |
982 |
982 |
|
|
Oscillatoria |
982 |
2947 |
0 |
14735 |
12771 |
6877 |
19647 |
3929 |
5894 |
20629 |
3930 |
15718 |
|
|
Dinophyceae |
Glenodinium |
2947 |
0 |
0 |
0 |
0 |
0 |
0 |
0 |
0 |
0 |
0 |
0 |
|
Heterocapsa |
0 |
0 |
0 |
0 |
0 |
0 |
0 |
982 |
0 |
0 |
0 |
0 |
|
|
Peridinium |
0 |
0 |
0 |
0 |
0 |
0 |
0 |
0 |
982 |
0 |
0 |
0 |
|
|
Zygnematophyceae |
Spirotaenia |
0 |
0 |
982 |
0 |
0 |
0 |
982 |
0 |
4912 |
0 |
0 |
0 |
Note: DOC = days of culture.
[1] FAO. (2026). Quarterly Shrimp Analysis - February 2026. International Markets for Fisheries and Aquaculture Products. FAO, Rome.
[2] Suwoyo, H.S., Hendrajat, E.A. (2021). High density aquaculture of white shrimp (Litopenaeus vannamei) in controlled tank. IOP Conference Series: Earth and Environmental Science, 777(1): 12022. https://doi.org/10.1088/1755-1315/777/1/012022
[3] Cahyanurani, A.B., Edy, M.H. (2022). Performance of intensive vannamei (Litopenaeus vannamei) culture at low salinity. Depik, 11(3): 257-264.
[4] Zhao, C., Bao, G., Mei, B., Luo, Y., Xu, J., Xu, S., Wang, D. (2025). Study on the aquaculture capacity of whiteleg shrimp (Litopenaeus vannamei)-razor clam (Sinonovacula constricta) tandem mariculture pond. Aquaculture Reports, 40: 102625. https://doi.org/10.1016/j.aqrep.2025.102625
[5] Emerenciano, M.G., Rombenso, A.N., Vieira, F.D.N., et al. (2022). Intensification of penaeid shrimp culture: An applied review of advances in production systems, nutrition and breeding. Animals, 12(3): 236. https://doi.org/10.3390/ani12030236
[6] Kasman, K., Johan, Y., Brata, B., Soetrisno, E. (2021). The relationship between environmental parameters and the prevalence of Infectious Myonecrosis Virus in semi-intensive whiteleg shrimp (Litopenaeus vannamei) ponds in Central Bengkulu Regency. Jurnal Penelitian Pengelolaan Sumber Daya Alam dan Lingkungan, 10(1): 134-142. https://doi.org/10.31186/naturalis.10.1.18160
[7] Othman, R., Elabd, H., Pratiwy, F.M., Barzkar, N., Lim, L.S., Rodrigues, K.F. (2024). Biosecurity in Aquaculture: Nurturing Health and Ensuring Sustainability. In Essentials of Aquaculture Practices, pp. 139-182. https://doi.org/10.1007/978-981-97-6699-4_8
[8] Musa, M., Mahmudi, M., Lusiana, E.D., Buwono, N.R., Arsad, S. (2024). Pshytoplankton community stability as a health indicator of whiteleg shrimp in an intensive pond. Ecological Engineering & Environmental Technology, 25(1): 332-340. https://doi.org/10.12912/27197050/175752
[9] Ariadi, H., Musa, M., Mahmudi, M., Hertika, A.M.S. (2025). The waste load and carrying capacity on intensive shrimp farming: A mini review. Ecological Engineering & Environmental Technology, 26(4): 323-333. https://doi.org/10.12912/27197050/201144
[10] Liu, Q., Hou, Z., Wen, H., Li, J., He, F., Wang, J., Guan, B., Wang, Q. (2016). Effect of stocking density on water quality and (Growth, Body Composition and Plasma Cortisol Content) performance of pen-reared rainbow trout (Oncorhynchus mykiss). Journal of Ocean University of China, 15(4): 667-675. https://doi.org/10.1007/s11802-016-2956-2
[11] Ogello, E.O., Outa, N.O., Obiero, K.O., Kyule, D.N., Munguti, J.M. (2021). The prospects of biofloc technology (BFT) for sustainable aquaculture development. Scientific African, 14: e01053. https://doi.org/10.1016/j.sciaf.2021.e01053
[12] Sallam, G.R., El Basuini, M.F., Alhoshy, M., et al. (2025). Strategic application of biofloc technology for optimizing physiological homeostasis and reproductive efficiency in red tilapia (Oreochromis spp.) broodstock under long-term rearing conditions. Aquaculture International, 33(6): 464. https://doi.org/10.1007/s10499-025-02141-2
[13] Li, S., Liu, H., Lin, Y., et al. (2026). Biofloc technology improves harmful nitrogen and pathogens control and enhances production performance in intensive Penaeus vannamei culture ponds with reduced water exchange. Fishes, 11(3): 170. https://doi.org/10.3390/fishes11030170
[14] Rahmi, I., Arfiati, D., Musa, M., Karimah, K. (2023). Dynamics of physics and chemistry of vanamei shrimp (Litopenaeus vannamei) pond water with semi biofloc system. Journal of Science Education Research, 9(1): 249-256. https://doi.org/10.29303/jppipa.v9i1.2528
[15] Verma, D.K., Satyaveer, Maurya, N.K., Kumar, P., Jayaswa, R. (2022). Important Water Quality Parameters in Aquaculture: An overview. Agriculture & Environment, 3(3): 24-29.
[16] Zhao, P., Huang, J., Wang, X.H., et al. (2012). The application of bioflocs technology in high-intensive, zero exchange farming systems of Marsupenaeus japonicus. Aquaculture, 354-355: 97-106. https://doi.org/10.1016/j.aquaculture.2012.03.034
[17] Cloern, J.E., Jassby, A.D., Schraga, T.S., Nejad, E., Martin, C. (2017). Ecosystem variability along the estuarine salinity gradient: Examples from long-term study of San Francisco Bay. Limnology and Oceanography, 62(S1): S272-S291. https://doi.org/10.1002/lno.10537
[18] Sun, X., Zhang, H., Wang, Z., Huang, T., Huang, H. (2023). Phytoplankton community response to environmental factors along a salinity gradient in a Seagoing River, Tianjin, China. Microorganisms, 11(1): 75. https://doi.org/10.3390/microorganisms11010075
[19] Achmad, A., Susiloningtyas, D., Handayani, T. (2020). Sustainable aquaculture management of Vanamei Shrimp (Liptopenaeus vannamei) in Batukaras village, Pangandaran, Indonesia. International Journal of Geomate, 19(72): 151-158. https://doi.org/10.21660/2020.72.5727
[20] Long, L., Liu, H., Lu, S. (2023). Effects of low salinity on growth, digestive enzyme activity, antioxidant and immune status, and the microbial community of Litopenaeus vannamei in biofloc technology aquaculture systems. Journal of Marine Science and Engineering, 11(11): 2076. https://doi.org/10.3390/jmse11112076
[21] Jaffer, Y.D., Saraswathy, R., Ishfaq, M., Antony, J., Bundela, D.S., Sharma, P.C. (2020). Effect of low salinity on the growth and survival of juvenile pacific white shrimp, Penaeus vannamei: A revival. Aquaculture, 515: 734561. https://doi.org/10.1016/j.aquaculture.2019.734561
[22] Hou, D., Zhou, R., Zeng, S., et al. (2020). Intestine bacterial community composition of shrimp varies under low-and high-salinity culture conditions. Frontiers in Microbiology, 11: 589164. https://doi.org/10.3389/fmicb.2020.589164
[23] Huang, H.H., Liao, H.M., Lei, Y.J., Yang, P.H. (2022). Effects of different carbon sources on growth performance of Litopenaeus vannamei and water quality in the biofloc system in low salinity. Aquaculture, 546: 737239. https://doi.org/10.1016/j.aquaculture.2021.737239
[24] Suantika, G., Situmorang, M.L., Kurniawan, J.B., et al. (2018). Development of a zero water discharge (ZWD)-Recirculating aquaculture system (RAS) hybrid system for super intensive white shrimp (Litopenaeus vannamei) culture under low salinity conditions and its industrial trial in commercial shrimp urban farming in Gr. Indonesia. Aquacultural Engineering, 82: 12-24. https://doi.org/10.1016/j.aquaeng.2018.04.002
[25] Avnimelech, Y. (1999). Carbon/nitrogen ratio as a control element in aquaculture systems. Aquaculture, 176(3): 227-235. https://doi.org/10.1016/S0044-8486(99)00085-X
[26] Khanjani, M.H., Sharifinia, M. (2022). Biofloc technology with addition molasses as carbon sources applied to Litopenaeus vannamei juvenile production under the effects of different C/N ratios. Aquaculture International, 30(1): 383-397. https://doi.org/10.1007/s10499-021-00803-5
[27] Hallett, L.M., Jones, S.K., MacDonald, A.A.M., et al. (2016). Codyn: An r package of community dynamics metrics. Methods in Ecology and Evolution, 7(10): 1146-1151. https://doi.org/10.1111/2041-210X.12569
[28] Colombo, G.M., dos Santos Simião, C., Schmitz, M.J., et al. (2020). The role of açaí (Euterpe oleracea Mart. 1824) as a chemoprotective agent in the evaluation of antioxidant defence, oxidative damage and histology of juvenile shrimp Litopenaeus vannamei (BOONE, 1931) exposed to ammonia. Aquaculture Research, 51(4): 1551-1566. https://doi.org/10.1111/are.14503
[29] Xia, Z., Wang, Q., She, Z., et al. (2019). Nitrogen removal pathway and dynamics of microbial community with the increase of salinity in simultaneous nitrification and denitrification process. Science of The Total Environment, 697: 134047. https://doi.org/10.1016/j.scitotenv.2019.134047
[30] Musa, M., Thoyibah, A.A., Puspitaningtyas, D.A., et al. (2023). The impact of water quality on the availability of phytoplankton and growth of Litopenaeus vannamei. Journal of Water and Land Development, 56: 127-135. https://doi.org/10.24425/jwld.2023.143753
[31] Huang, Y., Li, L., Li, R., Li, B., Wang, Q., Song, K. (2024). Nitrogen cycling and resource recovery from aquaculture wastewater treatment systems: A review. Environmental Chemistry Letters, 22(5): 2467-2482. https://doi.org/10.1007/s10311-024-01763-x
[32] Arfiati, D., Putra, C., Tullah, A., Widi, S., Puspitasari, A.W. (2019). The dynamics of total organic matter (TOM) on Sangkuriang catfish (Clarias gariepinus) farming at Upt PTPBP2KP and the effectiveness of freshwater bivalve (Anodonta woodiana) in reducing the total organic matter with varying density. IOP Conference Series: Earth and Environmental Science, 236(1): 12022. https://doi.org/10.1088/1755-1315/236/1/012022
[33] Boyd, C.E. (2019). Suspended solids, color, turbidity, and light. In Water quality: An introduction, Springer International Publishing, pp. 119-133. https://doi.org/10.1007/978-3-030-23335-8_6
[34] Schveitzer, R., Baccarat, R.F.C., Gaona, C.A.P., Wasielesky Jr, W., Arantes, R. (2024). Concentration of suspended solids in superintensive culture of the Pacific white shrimp Litopenaeus vannamei with biofloc technology (BFT): A review. Reviews in Aquaculture, 16(2): 785-795. https://doi.org/10.1111/raq.12867
[35] Abigail, W., Zainuri, M., Pranowo, W.S. (2015). A study of primary productivity based on nutrient distribution and light intensity in the Badung Strait, Bali. Journal of Oceanography, 4(1): 150-158. https://ejournal3.undip.ac.id/index.php/joce/article/view/7677.
[36] Do, D.D., Le, A.H., Vu, V.V., Le, D.A.N., Bui, H.M. (2025). Evaluation of water quality and key factors influencing water quality in intensive shrimp farming systems using principal component analysis-fuzzy approach. Desalination and Water Treatment, 321: 101002. https://doi.org/10.1016/j.dwt.2025.101002
[37] Mamangkey, J.J., Rawung, L., Kuron, M.A. (2026). Study of the physical and chemical characteristics of Lake Tondano, North Sulawesi. International Journal of Scientific Multidisciplinary Research, 4(2): 171-182. https://doi.org/10.55927/ijsmr.v4i2.6
[38] Kurnianda, V., Heriantoni, J. (2017). Evaluation of the tropical status of coastal waters of Gapang, Sabang, Aceh Province, based on nitrate and phosphate concentrations, and chlorophyll-a abundance. Depict, 6(2): 106-111. https://doi.org/10.13170/depik.6.2.7593
[39] Avnimelech, Y. (2009). Biofloc Technology: A Practical Guide Book. World Aquaculture Society, Baton Rouge, Louisiana, USA.
[40] Kaushik, R., Tiwari, A., Ulmann, L. (2025). Diatoms and their role in the sustainable agricultural circular economy. In Diatoms and Sustainable Agriculture, CRC Press, pp. 1-19.
[41] Bi, R., Cao, Z., Ismar-Rebitz, S.M.H., et al. (2021). Responses of marine diatom-dinoflagellate competition to multiple environmental drivers: Abundance, elemental, and biochemical aspects. Frontiers in Microbiology, 12: 731786. https://doi.org/10.3389/fmicb.2021.731786
[42] Brandão, H., Xavier, Í.V., Santana, G.K.K., Santana, H.J.K., Krummenauer, D., Wasielesky, W. (2021). Heterotrophic versus mixed BFT system: Impacts on water use, suspended solids production and growth performance of Litopenaeus vannamei. Aquacultural Engineering, 95: 102194. https://doi.org/10.1016/j.aquaeng.2021.102194
[43] Wang, J., Zhang, Z. (2020). Phytoplankton, dissolved oxygen and nutrient patterns along a eutrophic river-estuary continuum: Observation and modeling. Journal of Environmental Management, 261: 110233. https://doi.org/10.1016/j.jenvman.2020.110233
[44] Andersen, I.M., Williamson, T.J., González, M.J., Vanni, M.J. (2020). Nitrate, ammonium, and phosphorus drive seasonal nutrient limitation of chlorophytes, cyanobacteria, and diatoms in a hyper-eutrophic reservoir. Limnology and Oceanography, 65(5): 962-978. https://doi.org/10.1002/lno.11363
[45] Pimentel, O.A.L.F., Amado, A.M., They, N.H. (2023). Biofloc colors as an assessment tool for water quality in shrimp farming with BFT systems. Aquacultural Engineering, 101: 102321. https://doi.org/10.1016/j.aquaeng.2023.102321
[46] Chowdhury, P., Khan, S.J., Sumon, M.A.A., El-Regal, M.A.A., Tayyamath, K., Van Doan, H. (2026). The role of planktons in sustaining the function and diversity of marine ecosystems: A systematic review. Discover Animals, 3(1): 9. https://doi.org/10.1007/s44338-025-00113-7
[47] Akbarurrasyid, M., Prajayati, V.T.F., Nurkamalia, I., Astiyani, W.P., Gunawan, B.I. (2022). The relationship between water quality and the structure of plankton communities in vannamei shrimp ponds. Journal of Science Research, 24(2): 90. https://doi.org/10.56064/jps.v24i2.688
[48] Hariati, A.M., Mahariawan, I.M.D., Yuniarti, A., et al. (2025). Potensi, Manfaat dan Fisibilitas Budidaya Sistem Bioflok. Media Nusa Creative (MNC Publishing), Malang, Indonesia.