Israa Abdel Munem Yassen![]() | Khulood Waleed Saleh
| Khulood Waleed Saleh![]() | Areej Luay Mohammed | Batol Imran Dheeb*
| Areej Luay Mohammed | Batol Imran Dheeb*
© 2026 The authors. This article is published by IIETA and is licensed under the CC BY 4.0 license (http://creativecommons.org/licenses/by/4.0/).
OPEN ACCESS
There is a significant environmental problem known as water pollution, which is a huge worry since it poses economic and health dangers to both humans and other living organisms. The study aimed to investigate some of the physical and chemical characteristics and fungal diversity of water reservoirs in Samarra. Tank water samples were collected monthly for a period of 6 months, from November 2024 to April 2025. Water temperature ranged between 14–25.2 ℃, with the lowest value recorded in January and the highest in April. The pH values fluctuated between 6.17 and 8.9, remaining mostly within the permissible range for domestic water of the WHO guideline value. Electrical conductivity (EC) values varied from 340 to 990 µS/cm. Dissolved oxygen (DO) levels ranged between 7.16 and 9.45 mg/L, while total dissolved solids (TDS) were between 200 and 423 mg/L. Iron concentrations ranged from 0.236 to 0.769 mg/L. Ammonium concentrations fluctuated between 0.01 and 0.86 mg/L. Fungal analysis revealed a total of 147 isolates belonging to 17 genera, including both saprophytic and opportunistic species such as Aspergillus, Penicillium, Cladosporium, Alternaria, Curvularia, and Trichophyton. The present investigation showed clear geographical and seasonal changes in Samarra household tank water microbiological quality. Fungal growth was strongly seasonal, with November having the greatest fungal isolation rate and February the lowest. Aspergillus, Penicillium, Cladosporium, and Curvularia were the most common fungal genera, indicating the health concerns of opportunistic and pathogenic fungi in stored water. Microbial contamination is affected by tank material, maintenance, and water stagnation, as shown by sampling site variation. In some areas, elevated iron levels signal infrastructure conditions and distribution system corrosion.
pollution, electrical conductivity, fungal contamination, Aspergillus
In spite of the fact that water is necessary for life, the health of individuals is negatively impacted by contaminated water [1]. It is common knowledge that water is the constituent that is found in the greatest quantity on Earth. Nevertheless, the provision of potable water is of the utmost importance for the maintenance of life and the improvement of human well-being [2]. There is a significant environmental problem known as water pollution, which is a huge worry since it poses economic and health dangers to both humans and other living organisms. In a number of developing nations, there is a pressing problem that is associated with the contamination of drinking water supplies, which has resulted in a major drop in the quality of the surface water [3].
Drinking water use varies; it must be stored. Storage before usage risks contamination. Water quality and public health depend on storage, especially in non-piped and intermittent piped systems. Because such systems have a high risk of water quality damage. Since most of the world gets drinking water from in-house or near-house storage, impairment during home storage is important and deserves deeper examination [4]. International and national drinking water quality standards preserve public health. If correctly implemented, those standards aim to ensure drinking water safety by eliminating or reducing health risks from contaminants [2].
Exposure levels or safe limits have been developed by the World Health Organization (WHO) for all sorts of pollutants that can be found in drinking water [5]. Additional types of water quality indicators have been produced by national and international organizations in a variety of nations. These organizations have developed these indicators in response to the necessity to evaluate the degree of water quality in a particular region of interest [6]. Because they lead to the spread of serious diseases such as cholera, malaria, amoebic dysentery, polio, dengue fever, and other diseases that cause the death of several people annually, contaminated drinking water has a direct impact on consumer health and the spread of epidemic diseases [7]. Reports show that about two billion people, which constitutes a sizeable fraction of the global population, continue to rely on drinking water supplies that are contaminated with this, which means that the water is contaminated with sewage [8]. Water quality issues can be chemical, physical, or microbiological. Chemical reactions can cause the loss of disinfectant residual, disinfection by-product formation, taste and odor development, pH increase, corrosion, iron and manganese buildup, hydrogen sulphide, and leachate from internal coatings. When bacteria grow and multiply in storage facilities, microbiological concerns arise [4]. According to Mallik et al. [9], microbial growth is fostered by rising water temperature, nutrients and minerals, corrosion products, a lack of disinfection residue, and stagnation. Physical processes, such as sediment deposition, pollutant entry, and thermal stratification, affect water quality. Temperature variations might also induce chemical or microbiological issues.
There is a lot of research that says water pollution has a bad effect on people’s health, but limited studies have been conducted to study the quality of stored household water, especially in water tanks in Samara city. These tanks were subjected to diverse environmental influences, such as inconsistent disinfection protocols. Also, majority of previous studies have concentrated on bacterial contamination there exists a significant deficiency in study concerning the presence and diversity of fungi in water storage systems, although water may originate from different sources, the present study is specifically concerned with point-of-use water stored in household tanks, aiming to assess the changes in its physical, chemical, and microbiological quality during storage and the risk of secondary contamination.
2.1 Study design
The study was conducted in Samarra, located in Salah al-Din Governorate, Iraq (Figure 1). Ten different sampling sites were selected, including the areas of (S1-Al-Burrahman, S2-Al-Muthanna, S3-Al-Qadisiyah, S4-Al-Armashwiyah, S5-Al-Dawanem, S6-Al-Dhubat, S7-Al-Ifraz, S8-Al-Jubairiyah, S9-Al-Mu'allimin neighborhood, and S10-Department of Life Sciences, College of Education). These sites represent residential, educational, and mixed-sex areas with varying population densities and environmental conditions.

Figure 1. Sampling sites on the map
Tank water samples were collected monthly for a period of 6 months, from November 2024 to April 2025, to monitor and evaluate water quality periodically, from microbial, physical, and chemical perspectives. Regular monitoring was also conducted at each site to compare pollution levels and microbiological distribution.
2.2 Sample collection
One-liter polyethylene bottles were used to collect four water samples from four positions of the water tank (A. Surface water near tank margin, B. surface water at tank center, C. 50 cm depth near tank margin, D. 50 cm depth at tank center), which were used for physical and chemical tests. Sampling depths were measured vertically from the water surface using a graduated measuring tape. All water samples were collected simultaneously during each sampling campaign and from the same fixed depths to maintain sampling consistency throughout the study. Sterilized glass bottles were used to estimate the microbial count. These samples were transported to the laboratory in a chilled container to preserve them until testing. The sampling depth was controlled by a graduated sampling device, and samples were collected separately without mixing to preserve spatial differences.
Quality assurance and quality control (QA/QC) procedures were implemented throughout the analytical work to ensure the accuracy and reliability of the obtained results. All analytical instruments were calibrated before each measurement session according to the manufacturer’s recommendations using standard calibration solutions of known concentrations. All analytical measurements were conducted using calibrated laboratory instruments according to the manufacturer’s operational guidelines. The sensitivity, detection capability, and quantification ranges of the instruments were within the standard analytical limits specified for water quality assessment applications.
2.3 Physical and chemical methods used to analyze wastewater properties
2.3.1 Water temperature
Water temperature was measured using a graduated mercury thermometer (0-100 ℃).
2.3.2 pH
The pH was measured using a pH meter (HI2211, HANNA). After calibration of the device in the laboratory using standard calibration solutions with different values (4, 7, 10).
2.3.3 Electrical conductivity
The electrical conductivity (EC) of the samples was measured in the field using a digital conductivity meter, model WTW, manufactured by the Italian company HANNA. The results were expressed in units of (µS/cm).
2.3.4 Dissolved oxygen test
A dissolved oxygen (DO) meter was used to measure the DO content immediately on-site. The reading was recorded in mg/L.
2.3.5 Iron and ammonia tests
The concentrations of iron and ammonia in water samples were determined using a multiparameter photometer (HI83200) manufactured by Hanna Instruments. The analysis was performed according to the manufacturer’s standard procedures. For each parameter, specific reagents supplied by the instrument kit were added to the water samples to develop a color reaction proportional to the analyte concentration.
For iron determination, the ferrozine-based method was applied, where iron reacts with the reagent to form a colored complex measured photometrically. For ammonia, the indophenol method was used, in which ammonia reacts with the reagent under alkaline conditions to produce a blue-colored compound. The absorbance was measured at the specified wavelengths, and concentrations were automatically calculated and displayed in mg/L.
2.3.6 Total dissolved solids
Dissolved solids are measured according to Ibrahim and Salman [10]. The process involves filtering 100 mL of the sample through a filter paper with a pore size of 0.45 um, then collecting the filtrate in a container of known weight (B). The filtrate is then evaporated in an oven at 105-103 ℃ for one hour. The filtrate is then weighed (A), and the concentration of dissolved solids is calculated according to the equation:
Total Dissolved Solids $(\mathrm{TDS})(\mathrm{mg} / \mathrm{L})=\frac{(\mathrm{A}-\mathrm{B}) * 1000}{\text { Sample volume }(\mathrm{mL})}$
The method detection limit (MDL) was estimated at 1 mg/L depending on balance sensitivity and sample volume, while the limit of quantification (LOQ) was 3 mg/L.
2.4 Aquatic fungal cultivation
1 mL of water sample was taken and cultured on Petri dishes containing Phyto-diffusion Divergence Aggregation medium. Potato Dextrose Agar (PDA) supplemented with chloramphenicol (50 mg/L) was used to suppress bacterial growth during fungal isolation. The dishes were incubated in an incubator at 25-28 ℃ for 5 to 7 days. After incubation, fungal colonies were examined macroscopically and microscopically. Identification was based on colony morphology, pigmentation, texture, growth characteristics, and microscopic features according to the standard mycological identification key.
2.5 Statistical analysis
Statistical analysis was performed using descriptive statistical methods to evaluate temporal and spatial variations in the physicochemical characteristics of stored water samples. The recorded values represented single measurements obtained from independently collected samples at different sampling positions and months. Therefore, descriptive parameters including minimum, maximum, and mean values were used to summarize the obtained data and identify variation trends among sampling periods and locations. Data processing and table preparation were carried out using Microsoft Excel 2019.
3.1 Environmental characteristics
3.1.1 Monthly temperature variations in water tanks in Samarra City
Temperature has a direct impact on whether it is on the aquatic or terrestrial environment. The water temperature value ranged during the study period between 14 and 25.2 ℃. This study recorded the lowest water temperature (14 ℃) in January 2025 at Site 4, and the highest water temperature (25.2 ℃) in April 2025 at Site 9, as shown in Table 1.
Table 1. Monthly temperature (℃) variations in water tanks in Samarra City
|
Months |
S1 |
S2 |
S3 |
S4 |
S5 |
S6 |
S7 |
S8 |
S9 |
S10 |
|
Nov. |
21.5 |
22.5 |
22.6 |
22 |
22.6 |
22.2 |
22.5 |
21.7 |
22 |
22.2 |
|
Dec. |
20.1 |
20.2 |
19.2 |
18.5 |
17.5 |
20 |
18.6 |
17.4 |
18.5 |
17.4 |
|
Jan. |
16.7 |
17 |
16.8 |
15.6 |
14 |
14.5 |
15.7 |
14.8 |
15.2 |
14.4 |
|
Feb. |
15.7 |
16.3 |
18.5 |
16.5 |
17.4 |
15.6 |
14.8 |
15.6 |
15.3 |
14.8 |
|
Mar. |
20.3 |
19.4 |
21.4 |
19.6 |
20.4 |
20 |
21.5 |
21.4 |
20.6 |
19.8 |
|
Apr. |
22.3 |
22.5 |
23.5 |
21.8 |
23.2 |
24.8 |
24.5 |
23.6 |
25.2 |
24.2 |
The study results showed a clear seasonal variation in the physical, chemical, and biological properties of reservoir water in Samarra City. Temperatures ranged between 14–25.2 ℃. These values are consistent with the region's general climate pattern, where temperatures drop during the winter and rise in the spring and summer, directly impacting the activity of microbial communities within reservoirs. Previous studies have shown that higher temperatures increase the rate of microbial growth, including algae and fungi, and alter the composition of the microbial community in favor of species adapted to high temperatures [11, 12].
3.1.2 Monthly pH variations in water tanks in Samarra City
The pH values ranged in all save sites throughout the study period between 6.17 and 8.9, where the lowest pH value was recorded in the third site during the month of December 2024 and the highest value in the fourth site during the month of April 2025, which was 8.9, as shown in Table 2.
pH values were recorded within the range of 6.17–8.9, which is within the permissible limits for domestic water according to WHO specifications [13]. These results indicate a relative stability in the water's chemical regime, with a slight tendency toward alkalinity due to the presence of bicarbonates and carbonates, a characteristic of Iraqi water, as noted by Mitchell and Frisbie [14]. These values are also consistent with what Al-Youzbakey and Sulaiman [15] found in their study of drinking water treatment plants in Karbala, where values ranged from 7.4 to 8.4.
Table 2. Monthly pH variations in water tanks in Samarra City
|
Months |
S1 |
S2 |
S3 |
S4 |
S5 |
S6 |
S7 |
S8 |
S9 |
S10 |
|
Nov. |
7.2 |
8 |
8.02 |
8.13 |
7.3 |
8.3 |
8.3 |
8.5 |
7.8 |
7.6 |
|
Dec. |
6.18 |
7.2 |
6.17 |
6.20 |
7.35 |
7.7 |
8.44 |
8.20 |
7.80 |
7.42 |
|
Jan. |
6.44 |
6.18 |
7.89 |
7.60 |
8.20 |
8.17 |
7.90 |
7.80 |
8.10 |
8.24 |
|
Feb. |
7.12 |
8.20 |
8 |
7.50 |
8.20 |
7.80 |
7.47 |
7.30 |
8.2 |
8.51 |
|
Mar. |
8.12 |
8.34 |
7.90 |
7.45 |
8.23 |
7.77 |
7.90 |
8.81 |
8.21 |
8.23 |
|
Apr. |
8.1 |
8.5 |
7.88 |
8.9 |
8.8 |
7.90 |
8.39 |
8.70 |
7.89 |
8.23 |
3.1.3 Monthly Electrical Conductivity variations in water tanks in Samarra City
The EC values ranged in all save sites throughout the study period between 340 and 990, where the lowest EC value was recorded in the fourth site during the month of December 2024 and the highest value in the seventh site during the month of November 2024, which was 990, as shown in Table 3.
The EC was approximately 990 µS/cm, indicating a moderate mineral content that meets the acceptable limits for drinking water (<1000 µS/cm) according to WHO reports [12]. Slight variations between sites are attributed to the nature of the reservoirs, their construction materials, and their exposure to sunlight and weather conditions.
Table 3. Monthly electrical conductivity (EC) variations in water tanks in Samarra City, µS/cm
|
Months |
S1 |
S2 |
S3 |
S4 |
S5 |
S6 |
S7 |
S8 |
S9 |
S10 |
|
Nov. |
510 |
980 |
950 |
360 |
945 |
877 |
990 |
389 |
943 |
660 |
|
Dec. |
540 |
900 |
976 |
340 |
934 |
954 |
987 |
387 |
932 |
675 |
|
Jan. |
580 |
965 |
950 |
367 |
965 |
934 |
956 |
365 |
944 |
654 |
|
Feb. |
600 |
976 |
934 |
387 |
934 |
867 |
945 |
378 |
879 |
687 |
|
Mar. |
670 |
943 |
956 |
367 |
977 |
865 |
987 |
398 |
876 |
690 |
|
Apr. |
623 |
980 |
977 |
487 |
978 |
933 |
945 |
376 |
890 |
687 |
3.1.4 Monthly dissolved oxygen variations in water tanks in Samarra City
DO values at the sites ranged during the study period between 7.16 and 9.45 mg/L, with the lowest value (7.16 mg/L) recorded at Site 10 in November 2024, while the highest level (9.45 mg/L) was at Site 1 in January 2025 (Table 4).
Since the DO is important for respiration and other metabolic processes in aquatic organisms, the predicted reaeration coefficient value is an essential parameter to model the DO concentration in different aquatic ecosystems. The DO values in the study of Hussain et al. [16] increase in the winter season when temperature values are low, and the opposite behavior occurs in the summer season when temperature values become higher. Water temperature is the main factor that controls reaeration rates. Because the amount of oxygen that can be dissolved in water is directly proportional to the temperature of the water [17].
Table 4. Monthly dissolved oxygen (DO) variations in water tanks in Samarra, mg/L
|
Months |
S1 |
S2 |
S3 |
S4 |
S5 |
S6 |
S7 |
S8 |
S9 |
S10 |
|
Nov. |
9.37 |
9.20 |
8.40 |
8.53 |
8.79 |
8 |
7.8 |
8.33 |
7.74 |
7.16 |
|
Dec. |
9.28 |
9.12 |
8.67 |
8.90 |
8.48 |
8.32 |
7.4 |
7.90 |
7.65 |
7.87 |
|
Jan. |
9.45 |
9.11 |
8.54 |
7.90 |
8.98 |
8.21 |
7.9 |
8.23 |
7.87 |
7.87 |
|
Feb. |
9.41 |
9.15 |
8.65 |
8.43 |
9.12 |
8.12 |
8.5 |
8.12 |
7.98 |
8.30 |
|
Mar. |
9.21 |
8.70 |
9.40 |
8.65 |
8.54 |
8.32 |
7.34 |
7.89 |
8.23 |
7.54 |
|
Apr. |
9.32 |
8.90 |
8.98 |
8.89 |
8.90 |
8.11 |
7.65 |
7.76 |
7.43 |
8.43 |
3.1.5 Monthly Total Dissolved Solids variations in water tanks in Samarra City
The TDS values ranged in all save sites throughout the study period between 200 and 423 mg/L, where the lowest TDS value was recorded in the fourth site during the month of November 2024 and the highest value in the tenth site during the month of January 2025, which was 423, as shown in Table 5.
The continued high concentration of total hardness is attributed to several reasons, including frequent malfunctions in the station's equipment, its reliance solely on biological treatment without chemical desalination stages, and insufficient water retention time for complete treatment [10, 18]. Furthermore, the increased activity of microorganisms leads to the decomposition of organic matter and the release of additional ions and elements, further increasing the hardness [19].
Table 5. Monthly Total Dissolved Solids (TDS) variations in water tanks in Samarra City, mg/L
|
Months |
S1 |
S2 |
S3 |
S4 |
S5 |
S6 |
S7 |
S8 |
S9 |
S10 |
|
Nov. |
280 |
267 |
255 |
200 |
245 |
250 |
325 |
250 |
266 |
422 |
|
Dec. |
283 |
254 |
276 |
232 |
264 |
248 |
322 |
251 |
254 |
421 |
|
Jan. |
243 |
264 |
266 |
198 |
254 |
248 |
312 |
252 |
265 |
423 |
|
Feb. |
289 |
254 |
267 |
243 |
257 |
249 |
323 |
254 |
254 |
393 |
|
Mar. |
291 |
276 |
265 |
211 |
249 |
255 |
322 |
251 |
255 |
390 |
|
Apr. |
284 |
232 |
287 |
213 |
247 |
248 |
321 |
254 |
254 |
411 |
3.1.6 Monthly iron variations in water tanks in Samarra City
The iron values ranged in all save sites throughout the study period between (0.236-0.769), where the lowest iron value was recorded in the ninth site during the month of January 2025, and the highest value in the fourth site during the month of January 2025, which was 0.769, as shown in Table 6.
Some sites showed increased iron concentrations during the warmer months, consistent with Hill et al. [20] in their study on groundwater in Kirkuk, and similar seasonal variations. were observed by Metcalf and Eddy [21]. These increases are attributed to the interaction of environmental factors and temperature with the mineral components of the reservoirs, in addition to the potential leakage of surface contaminants. The elevated iron concentration in some sites may be due to several factors, including leaching from storage tanks or corrosion of old metallic pipes, which releases iron into water. Additionally, sediment accumulation and fungi within the distribution system may increase iron concentration.
Table 6. Monthly iron variations in water tanks in Samarra City, mg/L
|
Months |
S1 |
S2 |
S3 |
S4 |
S5 |
S6 |
S7 |
S8 |
S9 |
S10 |
|
Nov. |
0.292 |
0.250 |
0.279 |
0.756 |
0.351 |
0.288 |
0.552 |
0.314 |
0.239 |
0.292 |
|
Dec. |
0.300 |
0.253 |
0.280 |
0.760 |
0.354 |
0.290 |
0.550 |
0.315 |
0.237 |
0.292 |
|
Jan. |
0.301 |
0.254 |
0.282 |
0.769 |
0.352 |
0.289 |
0.543 |
0.317 |
0.236 |
0.294 |
|
Feb. |
0.310 |
0.251 |
0.280 |
0.764 |
0.350 |
0.287 |
0.521 |
0.318 |
0.238 |
0.296 |
|
Mar. |
0.298 |
0.250 |
0.278 |
0.765 |
0.350 |
0.283 |
0.543 |
0.315 |
0.240 |
0.292 |
|
Apr. |
0.288 |
0.249 |
0.276 |
0.767 |
0.345 |
0.279 |
0.540 |
0.313 |
0.237 |
0.290 |
3.1.7 Monthly ammonium variations in water tanks in Samarra City
The ammonium values ranged in all save sites throughout the study period between 0.01 and 0.86, where the lowest ammonium value was recorded in the seventh site during the month of February 2025, and the highest value in the fifth site during the month of April 2025, which was 0.86, as shown in Table 7.
The study of Ibrahim and Salman [10] examined the concentration of ammonium ions in industrial wastewater. The highest concentration after treatment (12.6 mg/mL) was recorded in July, while the lowest was 310 mg/mL in the same month. In November, the concentration before treatment was 11.7 mg/mL, and after treatment was 10.6 mg/mL. The concentration of ammonium ions is considered. This pollution hinders the nitrification process, which converts the ammonium ions into a form of nitrogen. The reason for this is the insufficient number of aeration devices in the basins, which leads to a deficiency of DO. Failure to carry out the nitrification process leads to a high concentration of ammonium in the treated water, which may damage roots [22]. Ammonia may be higher than the limit allowed according to Iraqi standards and international standards for irrigation [23].
Table 7. Monthly ammonium variations in water tanks in Samarra City, mg/L
|
Months |
S1 |
S2 |
S3 |
S4 |
S5 |
S6 |
S7 |
S8 |
S9 |
S10 |
|
Nov. |
0.33 |
0.07 |
0.17 |
0.53 |
0.83 |
0.12 |
0.03 |
0.07 |
0.41 |
0.24 |
|
Dec. |
0.31 |
0.09 |
0.18 |
0.52 |
0.80 |
0.13 |
0.03 |
0.09 |
0.42 |
0.23 |
|
Jan. |
0.32 |
0.07 |
0.16 |
0.55 |
0.82 |
0.10 |
0.02 |
0.07 |
0.40 |
0.22 |
|
Feb. |
0.30 |
0.08 |
0.15 |
0.53 |
0.81 |
0.09 |
0.01 |
0.08 |
0.39 |
0.24 |
|
Mar. |
0.33 |
0.10 |
0.17 |
0.56 |
0.85 |
0.08 |
0.02 |
0.10 |
0.38 |
0.25 |
|
Apr. |
0.34 |
0.11 |
0.19 |
0.57 |
0.86 |
0.09 |
0.02 |
0.11 |
0.39 |
0.25 |
3.2 Monthly fungal isolate variations in water tanks in Samarra City
Fungal isolation results across the year revealed a clear diversity of fungal species and variations in the number of isolates. The high number of isolates was in November (18 isolates), followed by 12 isolates in April. The lowest number of isolates was in February (3 isolates).
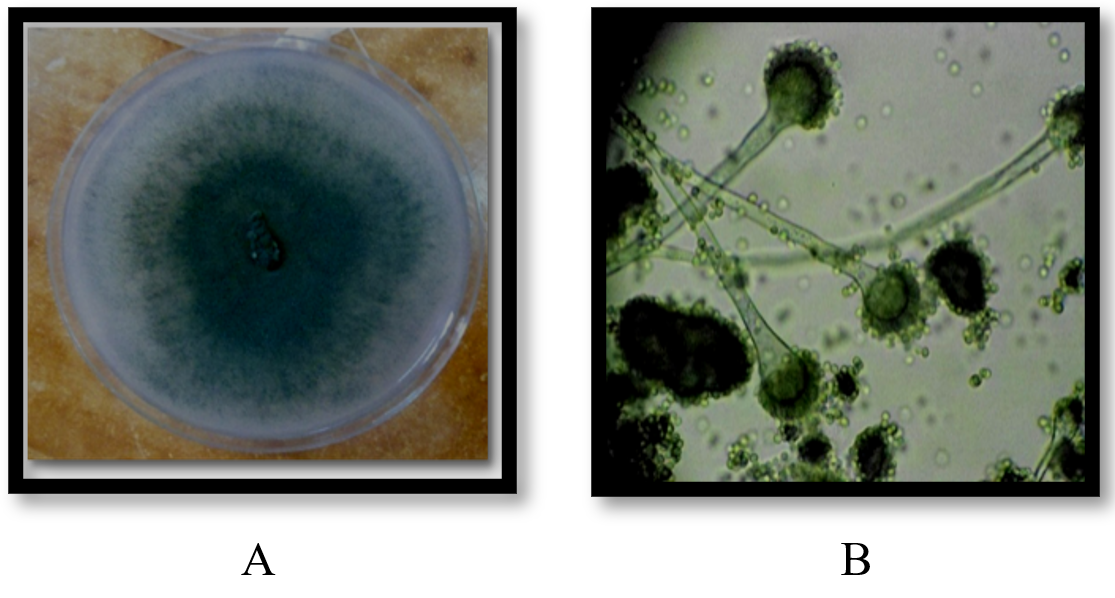
The isolated fungal genera varied between saprophytic and pathogenic fungi for humans and plants. The most prominent genera were Aspergillus, Penicillium, Cladosporium, Alternaria, and Curvularia (Figures 2-11).
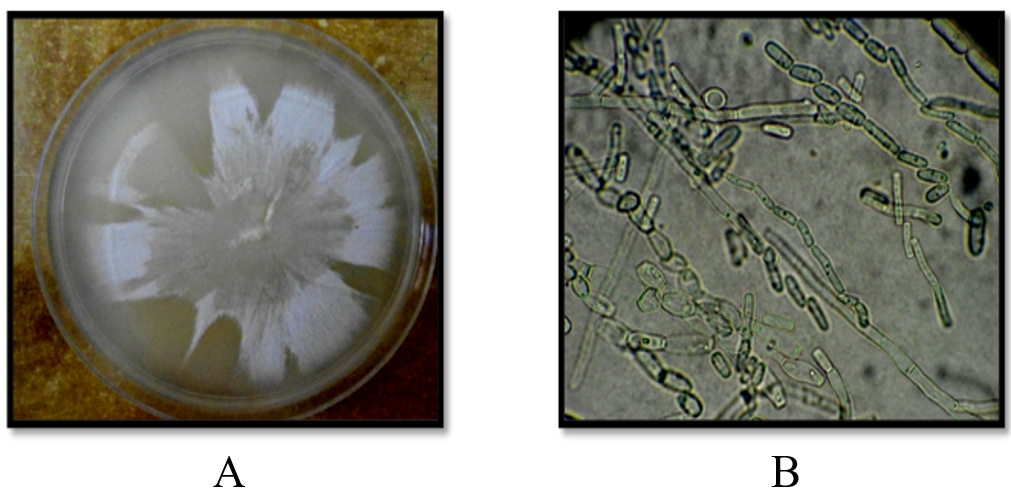
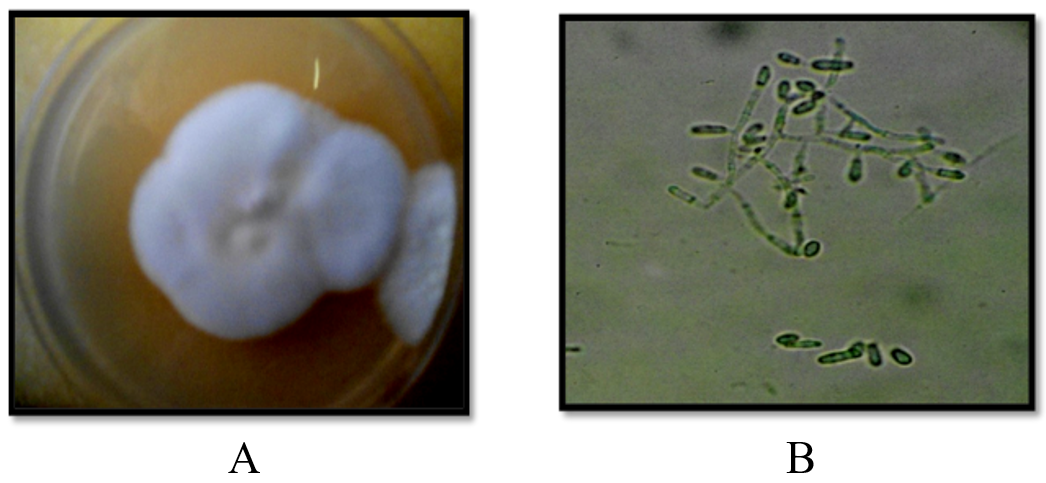
Figure 2. A- Top view of Aspergillus fumigatus on Potato Dextrose Agar (PDA) at 25-27 ℃ after 7 days of incubation, B- microscopic feature of Aspergillus fumigatus (40×)
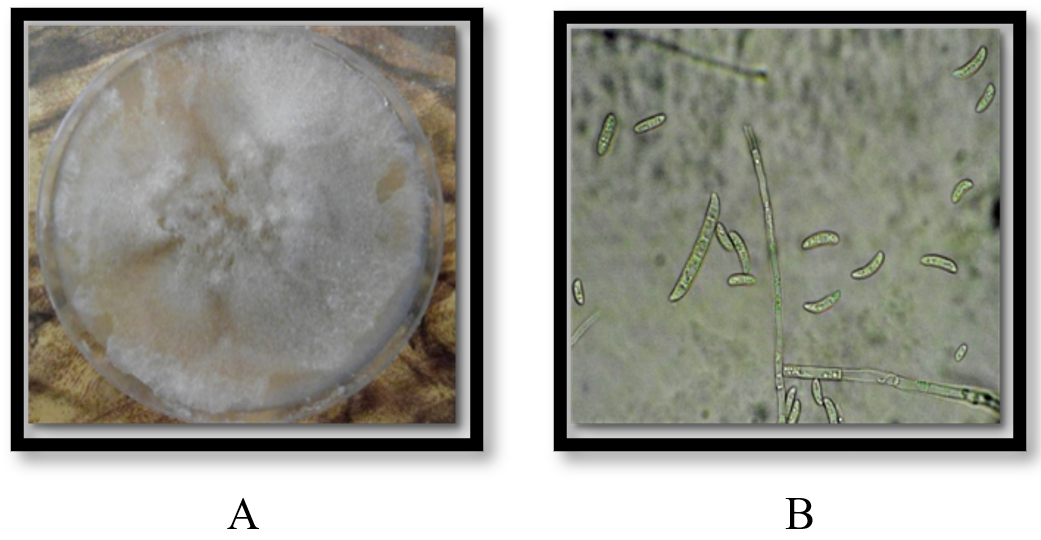
Figure 3. A- Top view of Fusarium oxysporum on Potato Dextrose Agar (PDA) at 25-27 ℃ after 7 days of incubation, B- microscopic feature of Fusarium oxysporum (40×)
Figure 4. A- Top view of Fusarium solani on Potato Dextrose Agar (PDA) at 25-27 ℃ after 7 days of incubation, B- microscopic feature of Fusarium solani (40×)
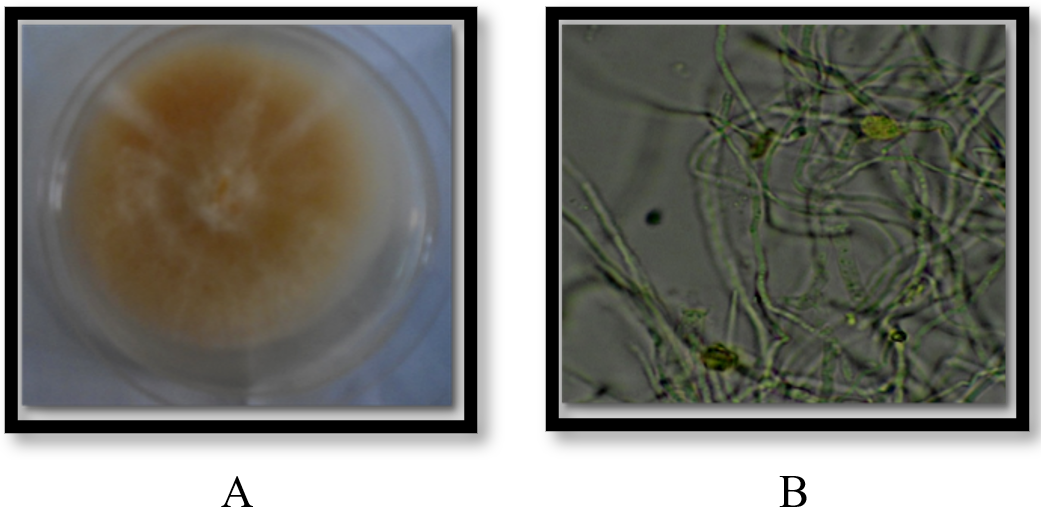
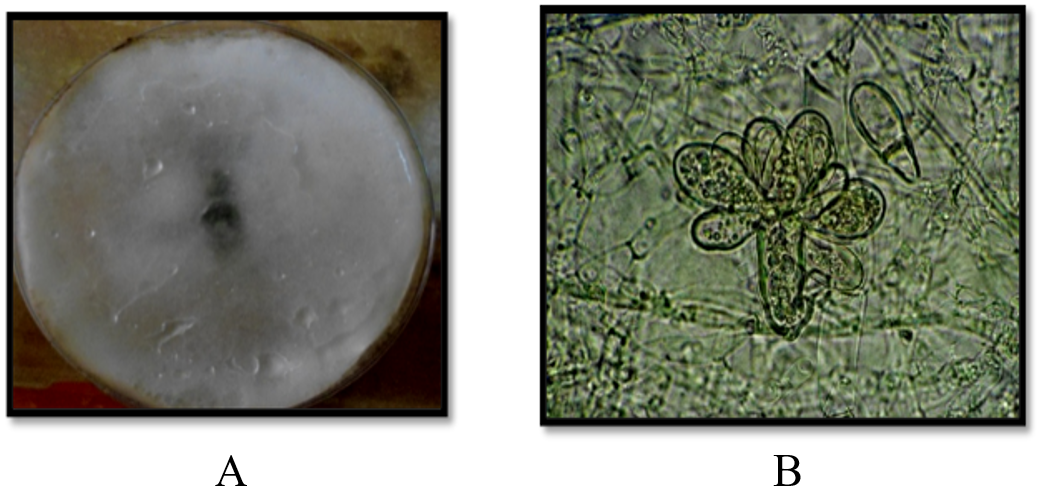
Figure 5. A- Top view of Hypomyces sp. on Potato Dextrose Agar (PDA), B- microscopic feature of Hypomyces sp. (40×)
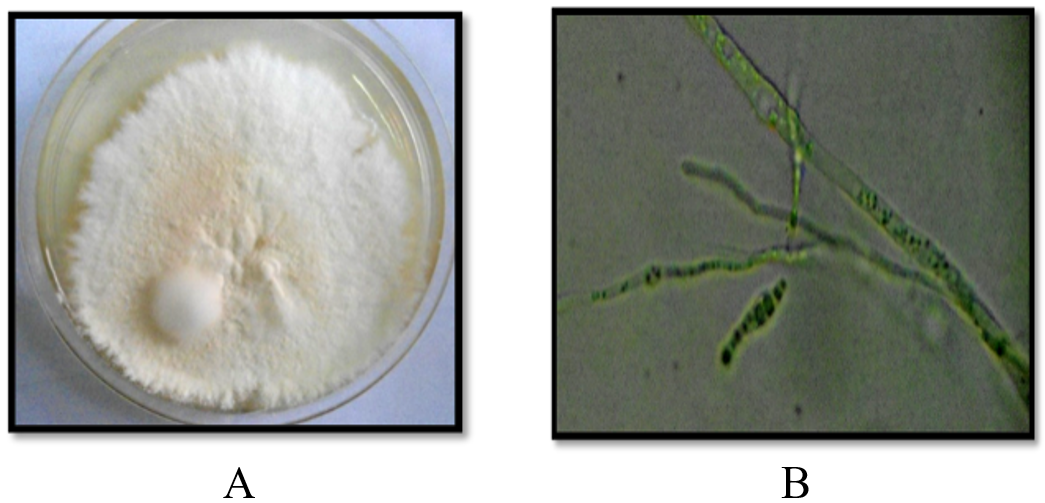
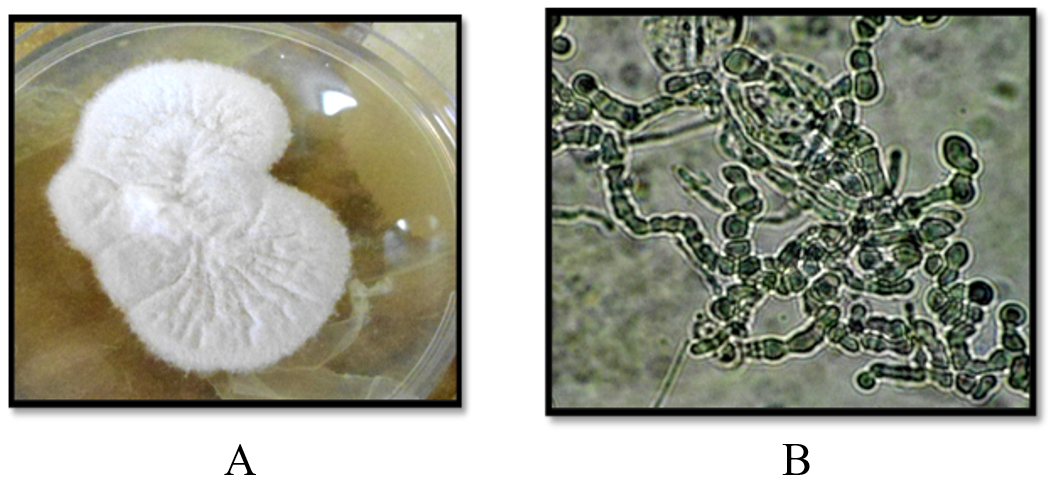
Figure 6. A- Top view of Geotrichium candidum on Potato Dextrose Agar (PDA), B- microscopic feature of G. candidum (40×)
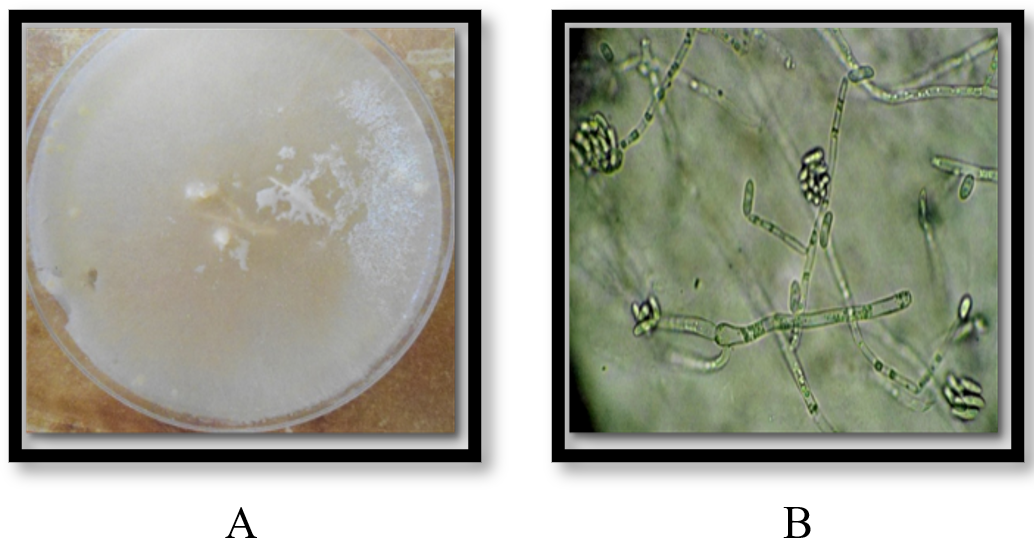
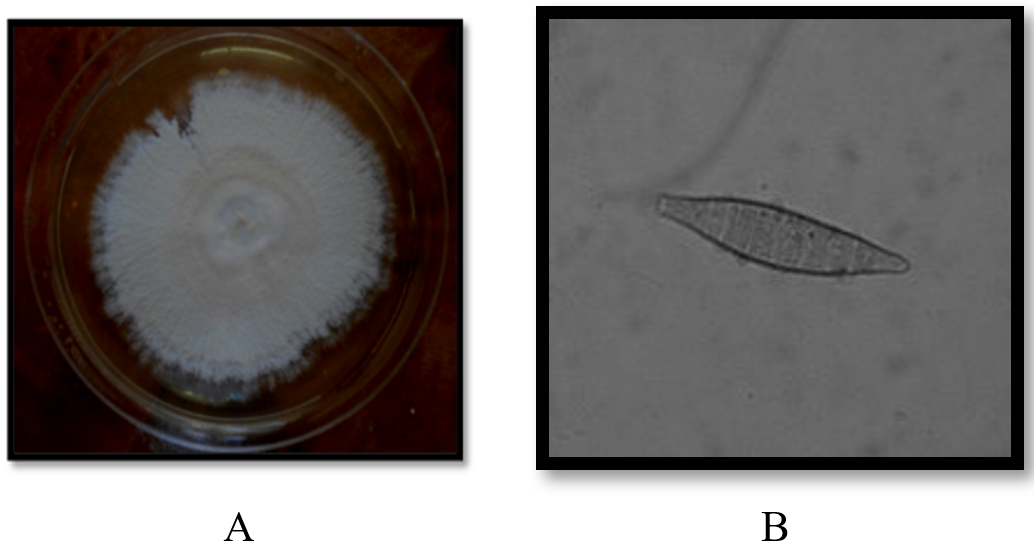
Figure 7. A- Top view of Cephaliophora tropica on Potato Dextrose Agar (PDA), B- microscopic feature of C. tropicalis (40×)
Figure 8. A- Top view of Microsporum audouinii on Potato Dextrose Agar (PDA), B- microscopic feature of M. audouinii (40×)
Figure 9. A- Top view of Microsporum canis on Potato Dextrose Agar (PDA), B- microscopic feature of M. canis (40×)
Figure 10. A- Top view of Trichophyton rubrum on Potato Dextrose Agar (PDA), B- microscopic feature of T. rubrum (40×)
Figure 11. A- Top view of T. verrucosum on Potato Dextrose Agar (PDA), B- microscopic feature of T. verrucosum (40×)
The results of fungal isolation throughout the months revealed a remarkable diversity in the isolated fungal species and variations in the number of isolates.
Microbiological analyses confirmed a wide diversity of fungi isolated from the reservoirs, including common genera such as Aspergillus, Penicillium, Cladosporium, Alternaria, and Curvularia. These results are consistent with recent international studies confirming that industrial or stored water systems provide a favorable environment for the growth of multiple fungal species capable of producing toxins or causing health problems [24].
The current study showed seasonal variation in the number of isolates, decreasing during the colder months and increasing during the hot and humid months (Table 8 and Figure 12). This observation supports the results of previous studies indicating that temperature and relative humidity are critical factors in the growth and spread of environmental fungi [25]. Numaan et al. [26] investigated that genera such as Aspergillus and Curvularia demonstrated a high adaptability to changing environmental conditions, while the increase in genera Penicillium and Cladosporium was associated with lower temperatures and higher humidity, characteristics known for these saprophytic fungi.

Figure 12. Seasonal distribution of fungal isolates
Table 8. Number and type of fungal isolates from water samples in different months
|
Month |
Water Save |
Types of Fungi |
No. |
|
January 2025 |
1 |
A. flavus; A. niveus; A. versicolor; A. niger; C. herbarum; C. cladosporioides; A. altrnata; T. harzianum; Chrysosporium; Curvularia |
10 |
|
February 2025 |
2 |
Curvularia; M. audouinii; A. altrnata |
3 |
|
March 2025 |
3 |
P. cyclopium; M. racemosus; R. stolonifer; A. fumigatus; T. mentagrophytes; Ulocladium |
6 |
|
April 2025 |
4 |
A. flavus; A. niger; M. canis; T. tonsurans; C. cladosporioides Chrysosporium A. tenuissima; P. glabrum; Hypomyces; T. longibranchiatum; Curvularia, Sterile Fungi |
12 |
|
5 |
|||
|
November 2024 |
7 |
A. parasiticus; A. ochraceus; A. flavipes; A. flavus; A. niger; P. griseofulvum; F. moniliforum; M. circinelloides; R. stolonifer; S. brevicaulis; C. herbarum; C. cladosporioides; A. altrnata; C. tropica; Chrysosporium; P. rugulosum, P. brevicompactum, Penicillium sp. |
18 |
|
December 2024 |
8 |
P. rubrum; F. sporotrichioides; S. brevicaulis; E. jeanselmei; A. altrnata |
11 |
|
9 |
P. eupyrena; P. glomerata; Hypomyces; Curvularia; F. moniliforum; S. brumptii |
||
|
Total |
|
|
60 |
Pathogenic species such as Microsporum canis, Trichophyton tonsurans, and Exophiala jeanselmei were also isolated, suggesting the possibility of environmental contamination from human or animal sources. Mycotoxin-producing species such as Aspergillus flavus and A. parasiticus were also recorded, posing a potential health risk when present in closed environments or on food surfaces [27].
3.3 Distribution of fungal species isolated from water save collecting points during the months
Table 9 shows the distribution of fungal isolates according to the collecting points from the samples. The high number of isolates was from point A (24), then from point C (16). While the lowest number is from point B (10). In general, the study demonstrates that seasonal changes and the physical and chemical properties of water directly affect fungal diversity and distribution, underscoring the need for periodic monitoring and continuous disinfection of reservoirs. It also recommends future studies to evaluate the biological efficacy and toxicity of some recorded fungal isolates.
Table 9. Distribution of fungal species isolated from water-saving collecting points during the months
|
Position |
Jan. |
Feb. |
Mar. |
Apr. |
Nov. |
Dec. |
|
A |
5 |
1 |
1 |
6 |
5 |
6 |
|
B |
0 |
1 |
1 |
1 |
6 |
1 |
|
C |
4 |
0 |
1 |
3 |
4 |
4 |
|
D |
1 |
1 |
3 |
2 |
3 |
5 |
|
Total No. |
10 |
3 |
6 |
12 |
18 |
11 |
The present investigation showed clear geographical and seasonal changes in Samarra household tank water microbiological quality. Fungal growth was strongly seasonal, with November having the greatest fungal isolation rate and February the lowest. Aspergillus, Penicillium, Cladosporium, and Curvularia were the most common fungal genera, indicating the health concerns of opportunistic and pathogenic fungi in stored water. Microbial contamination is affected by tank material, maintenance, and water stagnation, as shown by sampling site variation. In some areas, elevated iron levels signal infrastructure conditions and distribution system corrosion.
These studies suggest cleaning and disinfecting water storage tanks, monitoring water quality, and replacing old or corroded pipes to reduce contamination hazards. Also important is public understanding of water storage procedures.
4.1 Limitation
The present study focused on the isolation and identification of fungal species from water samples rather than quantitative microbial enumeration. Therefore, the results were reported in terms of occurrence and number of isolated fungal taxa, while quantitative measurements such as CFU/mL were not performed. In addition, fungal identification was mainly based on conventional morphological characteristics without molecular confirmation methods such as PCR or DNA sequencing. Accordingly, the possibility of misidentification of closely related fungal species cannot be completely excluded.
[1] Sharma, K., Rajan, S., Nayak, S.K. (2024). Water pollution: Primary sources and associated human health hazards with special emphasis on rural areas. In Water Resources Management for Rural Development, pp. 3-14. https://doi.org/10.1016/B978-0-443-18778-0.00014-3
[2] Hu, J., Iwamoto, M., Chen, X. (2024). A review of contact electrification at diversified interfaces and related applications on triboelectric nanogenerator. Nano-Micro Letters, 16(1): 7. https://doi.org/10.1007/s40820-023-01238-8
[3] Kolawole, A.S., Iyiola, A.O. (2023). Environmental pollution: Threats, impact on biodiversity, and protection strategies. In Sustainable Utilization and Conservation of Africa’s Biological Resources and Environment, pp. 377-409. https://doi.org/10.1007/978-981-19-6974-4_14
[4] Slavik, I., Oliveira, K.R., Cheung, P.B., Uhl, W. (2020). Water quality aspects related to domestic drinking water storage tanks and consideration in current standards and guidelines throughout the world - A review. Journal of Water and Health, 18(4): 439-463. https://doi.org/10.2166/wh.2020.052
[5] Cotruvo, J.A. (2017). 2017 WHO guidelines for drinking water quality: First addendum to the fourth edition. Journal-American Water Works Association, 109(7): 44-51. https://doi.org/10.5942/jawwa.2017.109.0087
[6] Ewaid, S.H., Abed, S.A., Al-Ansari, N., Salih, R.M. (2020). Development and evaluation of a water quality index for the Iraqi rivers. Hydrology, 7(3): 67. https://doi.org/10.3390/hydrology7030067
[7] Altahaan, Z.F., Dobslaw, D. (2024). Assessment of post-war groundwater quality in urban areas of Mosul city/Iraq and surrounding areas for drinking and irrigation purposes by using the Canadian environment water quality index CCME-WQI and heavy metal pollution index HPI. Water Research Reports, 21: 2461-2481. https://doi.org/10.30574/wjarr.2024.21.3.1010
[8] Krishan, A., Yadav, S., Srivastava, A. (2023). Water pollution’s global threat to public health: A mini-review. International Journal of Scientific Research in Science, Engineering and Technology, 10(6): 321-334. https://doi.org/10.32628/IJSRSET2310643
[9] Mallik, S.K., Pathak, R., Shahi, N. (2024). Sediment microbiology in the aquatic environment. In Handbook of Aquatic Microbiology, pp. 56-76.
[10] Ibrahim, A.N., Salman, S.A. (2024). Evaluating the physical and chemical properties of treated industrial wastewater in Samarra city and its suitability for irrigation. Samarra Journal of Pure Science, 6(3): 41-55. https://doi.org/10.54153/sjpas.2024.v6i3.682
[11] Waegenaar, F., Pluym, T., Coene, L., Schelfhout, J., García-Timermans, C., De Gusseme, B., Boon, N. (2024). Impact of temperature and water source on drinking water microbiome during distribution in a pilot-scale study. npj Clean Water, 7(1): 76. https://doi.org/10.1038/s41545-024-00371-0
[12] Ogbonna, D.N. (2010). Seasonal dynamics of microbial population and physicochemical characteristics of a water body receiving industrial pollutants in Port Harcourt, Nigeria. African Journal of Biotechnology, 1: 1333-1339. https://doi.org/10.5251/abjna.2010.1.6.1333.1339
[13] Dheeb, B.I., Hashim, S.S., Hussein, H.S., Hamada, T.A. (2022). Study of TGF-β immune marker expression in mice exposed to Candida spp. AIP Conference Proceedings, 2394(1): 030005. https://doi.org/10.1063/5.0121945
[14] Mitchell, E.J., Frisbie, S.H. (2023). A comprehensive survey and analysis of international drinking water regulations for inorganic chemicals with comparisons to the World Health Organization’s drinking-water guidelines. Plos One, 18(11): e0287937. https://doi.org/10.1371/journal.pone.0287937
[15] Al-Youzbakey, K.T., Sulaiman, A.M. (2021). Assessment of water quality along greater ZAB river within Iraqi lands. Italian Journal of Engineering Geology & Environment, 1: 5-17. https://doi.org/10.4408/IJEGE.2021-01.O-01
[16] Hussain, A.F., Sulaiman, G.M., Dheeb, B.I., Hashim, A.J., Abd Alrahman, E.S., Seddiq, S.H., Khashman, B.M. (2020). Histopathological changes and expression of transforming growth factor beta (TGF-β3) in mice exposed to gliotoxin. Journal of King Saud University-Science, 32(1): 716-725. https://doi.org/10.1016/j.jksus.2018.10.013
[17] Mohammed, I., Al-Khalaf, S.K.H., Alwan, H.H., Naje, A.S. (2022). Environmental assessment of Karbala water treatment plant using water quality index (WQI). Materials Today: Proceedings, 60: 1554-1560. https://doi.org/10.1016/j.matpr.2021.12.065
[18] Abdulateef, S.M., Ibraheem, S.R., Hussein, H.S., Dheeb, B.I., et al. (2024). MMP-1 and MMP-7 expression is influenced by ginsenosides in mice exposed to aflatoxin B1: In vivo Study. Jordan Journal of Pharmaceutical Sciences, 17(1): 199-214. https://doi.org/10.35516/jjps.v17i2.1989
[19] Al-Zubaidi, H.A. (2024). Numerical simulation of dissolved oxygen and reaeration coefficients in the Hilla River at Saddat Al-Hindiyah Reservoir, Iraq. International Journal of Design & Nature and Ecodynamics, 19(5): 1801-1808. https://doi.org/10.18280/ijdne.190535
[20] Hill, N.B., Riha, S.J., Walter, M.T. (2018). Temperature dependence of daily respiration and reaeration rates during baseflow conditions in a northeastern US stream. Journal of Hydrology: Regional Studies, 19: 250-264. https://doi.org/10.1016/j.ejrh.2018.09.006
[21] Metcalf, Eddy, A.E.C.O.M. (2014). Wastewater Engineering Treatment and Resource Recovery. McGraw-Hill Education.
[22] Mohammadi, K., Heidari, G., Khalesro, S., Sohrabi, Y. (2011). Soil management, microorganisms and organic matter interactions: A review. African Journal of Biotechnology, 10(86): 19840. https://doi.org/10.5897/AJBX11.006
[23] Al-Dabbas, M. (2024). Some aspects of the environment and biodiversity in Iraq. In the Geography of Iraq, pp. 145-169. https://doi.org/10.1007/978-3-031-71356-9_7
[24] Al-Shamary, A.C., Usamah, H.Y., Kadhim, H.Y. (2020). Study of some ecological characteristics of Iraqi marine waters southern Iraq. Marsh Bulletin 15(1): 19-30.
[25] Metcalf, Eddy, Inc, Asano, T., Burton, F.L., Leverenz, H., Tsuchihashi, R., Tchobanoglous, G. (2007). Water Reuse. United States of America: McGraw-Hill Professional Publishing.
[26] Numaan, M.M., Kadhem, A.J., Moyel, M.S., Bayati, M.B., et al. (2024). Study the possibility of using the treated industrial wastewater of north refineries company, Baiji-Iraq, for irrigation purposes. Tikrit Journal of Engineering Sciences, 31(4): 183-190. https://doi.org/110.25130/tjes.31.4.18
[27] Mohammed, M., Al-Taie, B. (2024). Isolation and identification of aquatic fungi from some water samples in Mosul City. Egyptian Journal of Aquatic Biology and Fisheries, 28(5): 793-804. https://doi.org/10.21608/ejabf.2024.380430