Lazzat Zhiyenkulova![]() | Mansiya Yessenamanova*
| Mansiya Yessenamanova*![]() | Farida Nurbayeva
| Farida Nurbayeva![]() | Damilya Ryskalieva
| Damilya Ryskalieva![]() | Nursaule Tauova
| Nursaule Tauova![]() | Gulnara Saparova
| Gulnara Saparova![]() | Elena G. Koroleva
| Elena G. Koroleva![]() | Raushan Atrauova
| Raushan Atrauova![]()
© 2026 The authors. This article is published by IIETA and is licensed under the CC BY 4.0 license (http://creativecommons.org/licenses/by/4.0/).
OPEN ACCESS
The article presents the results of hydrochemical studies of salt lakes and mineral springs in Western Kazakhstan (Atyrau and Mangystau regions) conducted in 2022-2025. The aim of the work was to study the hydrochemical composition of waters and to identify the influence of air temperature on the mineralization and concentration of basic ions. The results showed that most of the studied reservoirs are characterized by high mineralization and belong to the chloride-sulfate type of waters with a predominance of sodium and chloride ions. A strong positive correlation has been established between the concentrations of Na⁺ and Cl⁻ (r ≈ 0.92–0.96), which indicates the dominant role of the processes of evaporative salt concentration. A close relationship between Ca2⁺ and Mg2⁺ was also revealed due to the dissolution of carbonate-dolomite rocks of the drainage basins. The analysis of temperature data showed that summer air temperatures have a significant impact on the hydrochemical regime of reservoirs. An increase in temperature increases evaporation processes, which leads to an increase in the concentration of dissolved salts and an increase in total water mineralization. Cl⁻, Mg2⁺, and Ca2⁺ ions turned out to be the most sensitive to temperature changes, while bicarbonates exhibit a weaker dependence. The exception is radon therapeutic waters, where there is a weak or negative correlation with temperature, which is due to the peculiarities of the hydrogeochemical conditions of their formation. The results obtained confirm that the hydrochemical regime of the salt lakes of Western Kazakhstan is formed under the influence of three main processes: evaporative concentration, leaching of carbonate-dolomite rocks, and deposition of secondary minerals. The study expands the understanding of the limnological features of hypersaline reservoirs in arid territories and can be used to monitor aquatic ecosystems and predict changes in the hydrochemical regime under conditions of climatic variability.
salt lakes, water hydrochemistry, mineralization, ionic composition, arid regions, evaporative concentration, air temperature, Western Kazakhstan, Caspian region, limnology
Salt lakes are important objects of limnological research, as they represent unique aquatic ecosystems formed under conditions of limited water exchange and intense evaporation [1]. Unlike freshwater reservoirs, the hydrochemical regime of salt lakes is determined not only by the inflow of dissolved substances from the catchment area, but also by processes of evaporative concentration, water mineralization, and salt precipitation [2]. Such processes are typical for arid and semi-arid regions worldwide, including Central Asia, North Africa, Australia, and North America.
Recent studies of saline lakes in different arid regions demonstrate that air temperature plays a dominant role in controlling salinity through its influence on evaporation rates. For example, long-term observations of the Great Salt Lake show that periods of increased air temperature are associated with declining water levels and a significant rise in total dissolved solids (TDS) [3]. Similar patterns have been reported for saline lakes in Australia and North African endorheic basins, where temperature-driven evaporation leads to rapid concentration of dissolved salts and seasonal variability of ionic composition [4, 5]. These studies indicate that temperature is a key regulating factor of hydrochemical regimes across different climatic regions.
The salt lakes of Western Kazakhstan, located in Atyrau and Mangystau regions, represent important hydrological and geochemical systems formed under arid climatic conditions. These lakes are characterized by high mineralization and diverse ionic composition, making them valuable for studying the interaction between climatic factors and hydrochemistry [6, 7]. In contrast to large systems such as the Great Salt Lake, local saline lakes are typically smaller and shallower, which enhances their sensitivity to temperature fluctuations and seasonal evaporation processes [8].
Temperature is one of the main factors determining the hydrochemical regime of these lakes. It significantly affects evaporation intensity, solubility of gases, precipitation of mineral compounds, and ion distribution in the water column. Under high temperatures and low precipitation, evaporation exceeds inflow, leading to progressive accumulation of dissolved salts [9, 10]. Similar mechanisms have been observed in global saline lake systems; however, in smaller lakes, including those of Western Kazakhstan, these processes occur more rapidly, resulting in stronger seasonal and interannual variability of salinity compared to large lakes such as the Great Salt Lake [11, 12].
The hydrochemical composition of salt lakes is controlled by climatic conditions, geological structure of the catchment, groundwater and surface inflow, and evaporation–crystallization processes [13]. As a result, major cations (Na⁺, Mg²⁺, Ca²⁺, K⁺) and anions (Cl⁻, SO₄²⁻, HCO₃⁻) accumulate, determining the hydrochemical type of water [14]. Sodium chloride and sodium sulfate-chloride types dominate in Central Asia, which is consistent with observations from other arid regions worldwide [15].
A characteristic feature of saline lakes is the sequential precipitation of mineral compounds as concentration increases [16]. Initially, calcium carbonates precipitate, followed by sulfates, and later sodium and magnesium chlorides dominate. This geochemical sequence is well documented not only in Central Asia but also in saline lakes of North America and Australia, confirming the universality of these processes [17].
Thus, incorporating global research into the study of saline lakes allows for a more comprehensive understanding of hydrochemical formation mechanisms and highlights the key role of temperature as a universal driver of salinity dynamics. At the same time, regional differences, such as morphometry and hydrological isolation, determine the degree of sensitivity of lakes to climatic changes [18].
The relevance of this study is associated with increasing summer temperatures and high evaporation rates in Western Kazakhstan, which directly affect salinity and ion concentrations. The comparison with well-studied systems such as the Great Salt Lake emphasizes that regional lakes may respond more rapidly to climatic fluctuations, making them important indicators of environmental change [19].
The aim of this work is to study the hydrochemical composition of salt lakes in Western Kazakhstan during 2022–2025 and to identify the influence of air temperature on mineralization and major ion concentrations. The objectives include: analysis of major cations and anions, assessment of TDS, correlation analysis between hydrochemical parameters and temperature, identification of ion formation patterns, and evaluation of seasonal and interannual salinity variability under climatic influence [20].
2.1 Study area
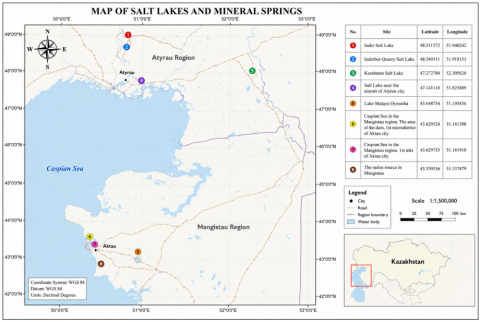
Hydrochemical monitoring of salt lakes and mineral springs in arid regions of Western Kazakhstan (Table 1 and Figure 1) was carried out in 2022-2025. Sampling was carried out in the summer (June–August), when evaporation processes are most intense and have the maximum effect on the mineralization and ionic composition of the water.
Figure 1. Salt lakes and mineral springs in arid regions of Western Kazakhstan
Table 1. Coordinates of salt lakes and mineral springs in arid regions of Western Kazakhstan of the Republic of Kazakhstan [21]
|
Salt Lakes and Mineral Springs |
Latitude |
Longitude |
|
Inder Salt Lake |
48.511572 |
51.940242 |
|
Inderbor Quarry Salt Lake |
48.549311 |
51.918153 |
|
Karabatan Salt Lake |
47.272780 |
52.305620 |
|
Salt Lake near the airport of Atyrau city |
47.141110 |
51.825889 |
|
Lake Malaya Oymasha |
43.648754 |
51.195456 |
|
Caspian Sea in the Mangistau region. The area of the dam, 1st microdistrict of Aktau city |
43.629524 |
51.181398 |
|
Caspian Sea in the Mangistau region. 1st microdistrict of Aktau city |
43.629753 |
51.181918 |
|
The radon source in Mangistau |
43.350536 |
51.337479 |
In order to assess the spatial and temporal variability of hydrochemical parameters, sampling was carried out at several representative stations of each reservoir. The control points included the central sections of lakes, coastal zones, and source outlet areas.
2.2 Methods
The hydrochemical analysis was aimed at determining the main dissolved ions and physicochemical parameters characterizing the salinity and ion balance of water.
As part of the study, the following main cations were identified:
•sodium (Na⁺);
•potassium (K⁺);
•calcium (Ca2⁺);
•magnesium (Mg2⁺).
The main anions included:
•chlorides (Cl⁻);
•sulfates (SO₄2⁻);
•bicarbonates (HCO₃⁻).
In addition, the following indicators were determined:
•Total dissolved solids (TDS);
•Hydrogen index (pH);
•Air temperature during the sampling period.
Hydrochemical analyses were performed using standard methods used in the practice of environmental monitoring of natural waters.
The analytical procedures were carried out in accordance with national and international standard methods:
•pH — ST RK ISO 10523–2013;
•Potassium (K⁺) — GOST 26449.1–85;
•Sodium (Na⁺) — GOST 26449.1–85;
•Calcium (Ca²⁺) — GOST 26449.1–85;
•Magnesium (Mg²⁺) — GOST 26449.1–85;
•Chlorides (Cl⁻) — ST RK ISO 9297–2008;
•Sulfates (SO₄²⁻) — ST RK 1015–2000;
•Nitrates (NO₃⁻) — GOST 33045–2014;
•Bicarbonates (HCO₃⁻) — PND F 14.1:2:4.190–03;
•TDS — determined by gravimetric method according to standard procedures and additionally calculated as the sum of major dissolved ions.
To ensure the reliability and reproducibility of hydrochemical data, a set of quality assurance and quality control (QA/QC) procedures was applied at all stages of sampling, storage, and laboratory analysis.
Water samples were collected in pre-cleaned polyethylene containers, previously rinsed with distilled water and sample water. Samples for cation analysis were filtered (0.45 µm) and acidified with ultrapure nitric acid to a pH < 2 to prevent precipitation and adsorption processes. Samples for anion analysis were stored without acidification at a temperature of +4 ℃ and analyzed within recommended holding times.
Instrument calibration was performed using certified standard solutions with known ion concentrations. Calibration curves were constructed for each analytical series, and correlation coefficients (R²) were maintained above 0.995.
Analytical precision was controlled by replicate analysis of selected samples (at least 10% of the total number), with relative standard deviation not exceeding 5% for major ions.
Accuracy was verified using certified reference materials and recovery tests, with acceptable recovery rates ranging from 90% to 110%.
Blank samples (distilled water) were regularly analyzed to detect possible contamination during laboratory procedures.
Detection limits for the applied methods were as follows: Na⁺, K⁺ — 0.1 mg/dm³; Ca²⁺, Mg²⁺ — 0.5 mg/dm³; Cl⁻ — 0.2 mg/dm³; SO₄²⁻ — 1.0 mg/dm³; HCO₃⁻ — 1.0 mg/dm³.
The ionic balance error (IBE) was calculated for each sample to assess data consistency and did not exceed ±5%, indicating high reliability of analytical results.
The pH of the water was measured using a calibrated laboratory pH meter with an accuracy of ±0.01.
The air temperature data corresponding to the sampling periods were obtained on the basis of regional meteorological observations and supplemented with field measurements [22].
The average air temperature values for the summer months (June, July, August) were used for the analysis, since it is during this period that the most intense evaporation occurs, which has a significant impact on water mineralization and the dynamics of ionic composition.
Statistical processing of hydrochemical data was carried out in order to identify the relationships between basic ions, total water mineralization, and temperature conditions.
The Pearson correlation coefficient, widely used in hydrochemical and limnological studies, was used to assess the strength and direction of the relationship between variables [23].
The correlation coefficient was calculated using the formula:
$r=\frac{\sum\left(x_i-\overline{\bar{x}}\right)\left(y_i-\overline{\bar{y}}\right)}{\sqrt{\sum\left(x_i-\overline{\bar{x}}\right)^2 \sum\left(y_i-\overline{\bar{y}}\right)^2}}$ (1)
where, xi and yi — individual values of the investigated parameters, $\overline{\bar{x}}$ and $\overline{\bar{y}}$ — their average values.
The interpretation of the correlation strength was carried out according to the following criteria:
The value of r is the strength of the correlation:
0.00–0.30 – weak
0.30–0.50 – moderate
0.50–0.70 – noticeable
0.70–0.90 – strong
0.90–1.00 – very strong
To evaluate potential interdependence between climatic predictors (air temperature, precipitation, and wind speed), the Variance Inflation Factor (VIF) was calculated.
VIF was determined as:
$V I F=\frac{1}{1-R^2}$ (2)
where, R2 represents the coefficient of determination obtained by regressing each predictor against the others.
Interpretation thresholds:
•VIF < 5 — low multicollinearity
•5–10 — moderate
•10 — high multicollinearity
The calculated VIF values indicated no critical multicollinearity between predictors, confirming that temperature, precipitation, and wind can be interpreted as relatively independent drivers in the correlation analysis.
The t-criterion is used for the correlation coefficient.:
$t=\frac{r \sqrt{n-2}}{\sqrt{1-r^2}}$ (3)
where,
•r is the correlation coefficient
•n is the number of observations
Confidence intervals through the Fisher transform:
$z=\frac{1}{2} \ln \frac{1+r}{1-r}$ (4)
Based on the data obtained, correlation matrices were constructed to identify the relationship between basic ions, TDS, and air temperature.
The interpretation of the results of the hydrochemical analysis was based on a comprehensive assessment:
- correlations between ions;
- ratios of basic cations and anions;
- the dependence of water mineralization on the temperature regime.
The analysis made it possible to identify the main geochemical processes that form the chemical composition of the studied reservoirs, which include:
1. Evaporative concentration of dissolved salts, typical for drainless salt lakes in arid regions.
2. Chemical weathering and dissolution of carbonate and dolomite rocks, providing Ca2⁺ and Mg2⁺ ions into the aquatic environment.
3. Precipitation of secondary minerals, primarily sulfate compounds (for example, gypsum), which occurs with high water mineralization.
The integrated use of hydrochemical and statistical analysis methods has revealed patterns of formation of the ionic composition and mineralization of salt lakes and mineral springs in Western Kazakhstan [24].
The limnological classification of the studied lakes was carried out based on the analysis of their hydrochemical characteristics, water mineralization level, ionic composition, and hydrological regime [25]. The classification was based on generally accepted principles of limnology and hydrochemistry, taking into account the degree of salinity (Table 2), the type of dominant ions, and the features of the water balance of reservoirs [26].
According to the hydrochemical classification of natural waters, the following categories are distinguished according to the level of TDS [27].
Table 2. Water classification according to mineralization
|
Water Category |
Mineralization (g/dm3) |
|
Fresh water |
<1 |
|
Weakly mineralized |
1-3 |
|
Brackish |
3–10 |
|
Salty |
10–35 |
|
Highly mineralized (brines) |
>35 |
3.1 Hydrochemical analysis of salt lakes of Atyrau and Mangystau regions for 2022-2025
Hydrochemical analysis of salt lakes and coastal water bodies in the Atyrau and Mangystau regions revealed temporal variations in ion concentrations, pH, and TDS over the study period.
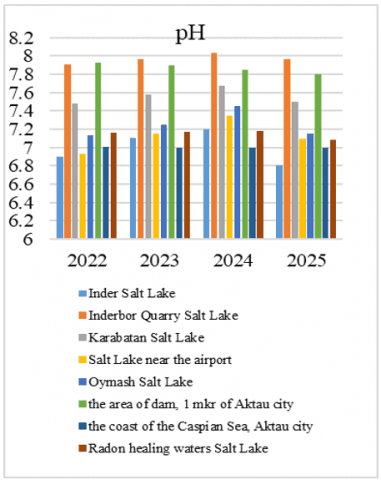
Figure 2. pH values for several salt lakes and coastal areas of West Kazakhstan region from 2022 to 2025
Figure 2 illustrates the variation in pH values across the studied sites. The results indicate that pH remained within a slightly alkaline range (6.8–8.0) throughout the observation period. A gradual increase was observed from 2022 to 2024, followed by a slight decrease in 2025. This stability reflects the buffering effect of the carbonate system (CO₂–HCO₃⁻–CO₃²⁻), which regulates acid–base balance in saline waters.
In 2022, the highest value of the indicator was observed in the area of the dam of the 1st microdistrict of Aktau (7.93), as well as in the Inderbor quarry (7.91). The lowest values were recorded in Lake Inder (6.9) and the salt lake near the airport (6.93).
By 2023, the values of the indicator have increased at almost all facilities. The most noticeable growth was recorded in the Inderbor quarry (up to 7.97) and Lake Karabatan (up to 7.58). At the same time, the indicators of the Caspian Sea coast remained stable and amounted to about 7.0.
In 2024, growth continued: the maximum value was again recorded in the Inderbor quarry (8.03), while in Lake Inder the indicator increased to 7.2. The remaining reservoirs showed a moderate increase in values in the range of 7.18–7.68.
However, in 2025, there was a slight decrease in the indicator at most facilities. So, in Lake Inder, the value decreased to 6.8, and in the Aktau dam area, to 7.8. At the same time, the indicators of the Caspian Sea coast remained unchanged (7.0), and radon therapeutic waters showed minimal fluctuations (7.08).
In general, over the period from 2022 to 2025, most salt lakes are characterized by moderate fluctuations in the indicator with a tendency to increase until 2024, after which there is a slight decrease, while maintaining the overall slightly alkaline response of the environment.
This stability of pH values (6.8–8.0) indicates the presence of a carbonate buffering system (CO₂–HCO₃⁻–CO₃²⁻), which controls acid–base equilibrium in saline waters. Slight alkalization until 2024 can be associated with increased evaporation and concentration of bicarbonates, while the decrease in 2025 may reflect dilution effects or changes in atmospheric CO₂ exchange. Additionally, shallow lakes such as Lake Inder respond more rapidly to climatic fluctuations compared to deeper or coastal systems.
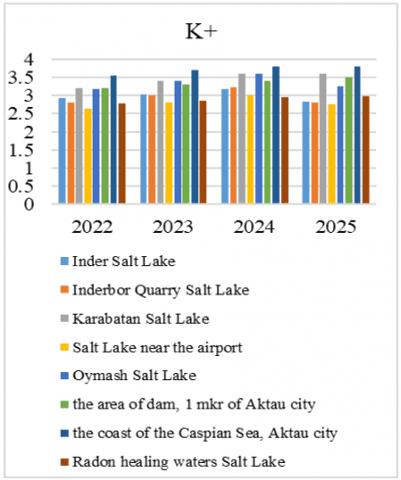
Figure 3. The concentration of potassium ions (K⁺) for several salt lakes and coastal areas of Atyrau and Mangistau regions from 2022 to 2025, mg/dm3
Figure 3 shows the dynamics of potassium (K⁺) concentrations. An increasing trend was observed from 2022 to 2024 in most reservoirs, followed by moderate fluctuations in 2025. Elevated concentrations in Lake Karabatan and coastal areas of the Caspian Sea suggest additional sources such as marine aerosol input and groundwater influence.
This bar chart shows changes in the concentration of potassium ions (K⁺) in the water of various salt lakes and coastal areas of the region in the period from 2022 to 2025.
In 2022, the highest concentration of K⁺ was observed on the coast of the Caspian Sea in Aktau (3.56), while the lowest values were recorded in the salt lake near the airport (2.64) and in the Inderbor quarry (2.82). Lakes Karabatan and Oymash had higher and almost identical values — about 3.19.
The situation changed markedly in 2023, when the concentration of K⁺ increased at all facilities. A particularly pronounced increase was observed in Lakes Karabatan and Oymash, where the indicator was 0.4 higher (3.4) than in Lake Inder (3.03). The Caspian Sea coast retained its leading position with a level of 3.7.
In 2024, there was a further increase in the content of potassium ions. The highest values were again recorded on the coast of the Caspian Sea (3.8), as well as in Lakes Karabatan and Oymash (3.6 each). At the same time, concentrations in Inder Lake and radon therapeutic waters remained noticeably lower and did not exceed 3.18 and 2.95, respectively.
In 2025, a decrease in the concentration of K⁺ was recorded at some of the facilities. So, in Lake Inder, the indicator decreased to 2.83, and in the salt lake near the airport, to 2.75. At the same time, the concentration of K⁺ in Lake Karabatan and on the coast of the Caspian Sea remained high and amounted to 3.6 and 3.8, respectively. The values in the Inderbor quarry and radon waters were almost the same and were at the level of about 2.82–2.98.
In general, in the period from 2022 to 2025, the concentration of potassium ions increased in most reservoirs by 2024, after which moderate fluctuations were observed in 2025, while maintaining consistently high values in Lake Karabatan, Lake Oymash, and the coast of the Caspian Sea.
The observed increase in K concentration until 2024 is primarily associated with evaporative concentration processes typical for closed (endorheic) basins. In contrast to Na, K is less involved in mineral precipitation and therefore accumulates in solution. The subsequent fluctuations in 2025 may be related to partial dilution due to local hydrological inputs or changes in groundwater contribution. Higher values in Lake Karabatan and the Caspian coastal zone indicate additional sources, including marine aerosol input and water exchange with the sea.
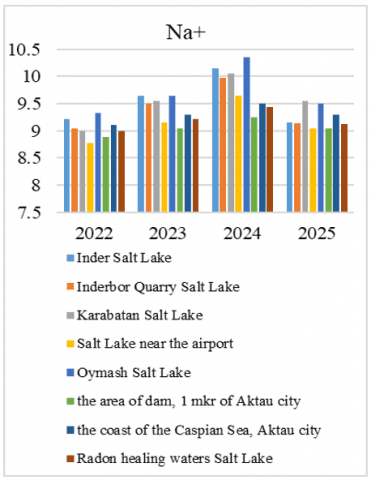
Figure 4. The concentration of sodium ions (Na⁺) for several salt lakes and coastal areas of Atyrau and Mangistau regions from 2022 to 2025, mg/dm3
Figure 4 presents sodium (Na⁺) concentrations. Sodium levels increased steadily until 2024, reflecting evaporative concentration processes, and then slightly decreased in 2025. As a conservative ion, sodium accumulates proportionally with water loss due to evaporation.
In 2022, the highest concentration of Na⁺ was observed in Lake Oymash (9.33), while the lowest value was recorded in the salt lake near the airport (8.78). The indicators of the remaining reservoirs ranged from 8.89 to 9.22.
The situation changed significantly in 2023, when the concentration of Na⁺ in Lake Inder and Lake Oymash was 0.15 higher (9.65 each) than in the Inderbor quarry (9.50). At the same time, the values in radon therapeutic waters and on the coast of the Caspian Sea were lower and amounted to 9.22 and 9.30, respectively.
Then, in 2024, there was a noticeable increase in the concentration of sodium ions, and Lake Oymash became the reservoir with the highest value of the indicator (10.35). High values were also observed in Lake Inder (10.15) and Lake Karabatan (10.05). The concentration of Na⁺ in the salt lake near the airport and in the dam area was significantly lower and did not exceed 9.65 and 9.25, respectively.
In 2025, the concentration of sodium ions in most facilities decreased. At the same time, the values in the Inderbor quarry and the Aktau dam area were the same, and amounted to about 9.05–9.13, while the highest value was again observed in Lake Karabatan (9.55).
In general, in the period from 2022 to 2025, the concentration of sodium ions increased until 2024, after which, in 2025, there was a total decrease in the indicator in most of the studied reservoirs.
This trend reflects the dominant role of evaporation in controlling sodium accumulation in saline lakes. Sodium, being a conservative ion, remains in solution and increases proportionally with water loss. The decrease observed in 2025 may indicate either increased precipitation, groundwater inflow, or reduced evaporation intensity. Similar patterns have been described for the Great Salt Lake, where interannual variability in salinity is strongly controlled by the balance between inflow and evaporation.
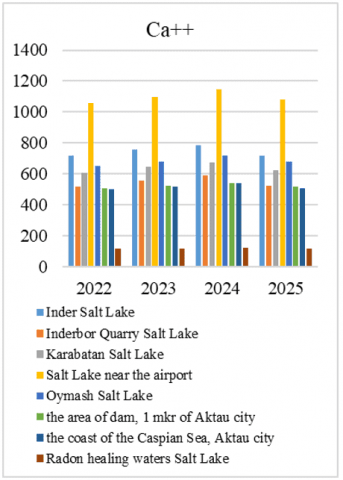
Figure 5 illustrates calcium (Ca²⁺) concentrations. Unlike Na, Ca participates in precipitation processes (e.g., calcite and gypsum formation). Its concentration increased until 2024 and decreased in 2025, indicating possible mineral precipitation under supersaturated conditions.
Figure 5. The concentration of calcium (Ca⁺) cations for several salt lakes and coastal areas of Atyrau and Mangistau regions from 2022 to 2025, mg/dm3
In 2022, the highest concentration of Ca²⁺ was observed in the salt lake near the airport (1059), while the lowest values were recorded in radon therapeutic waters (115.25). Lake Inder was characterized by a high calcium content (717), whereas in the Inderbor quarry, the index was 196 lower and amounted to 521.
The situation changed significantly in 2023, when the concentration of Ca⁺ increased at all facilities. In the salt lake near the airport, the calcium content increased to 1097.5 and remained the highest. At the same time, the indicator in Lake Karabatan was 90 higher than in the Inderbor quarry (645 versus 555).
Then, in 2024, there was a significant increase in the content of calcium cations. The salt lake near the airport again accounted for the highest group of values (1145), while the concentration in Lake Oymash reached 720. The values in the area of the dam and on the coast of the Caspian Sea were the same and amounted to 540 each.
In 2025, a decrease in Ca⁺ concentration was recorded in most reservoirs. So, in the salt lake near the airport, the indicator decreased to 1082.5, and in Lake Inder, to 721. The proportion of calcium in the Inderbor quarry and in the dam area was almost the same and amounted to about 520-525.
In general, in the period from 2022 to 2025, the concentration of calcium cations increased until 2024, after which a moderate decrease was observed in 2025, while maintaining consistently high values in the salt lake at the airport and Lake Oymash.
Unlike Na, Ca is actively involved in geochemical precipitation processes, especially in the form of carbonates (CaCO₃) and sulfates (gypsum). Therefore, its concentration reflects not only evaporation but also mineral deposition. The decrease in 2025 may indicate enhanced precipitation of calcium-bearing minerals under conditions of oversaturation. High calcium levels in the airport lake suggest strong interaction with carbonate rocks in the catchment area.
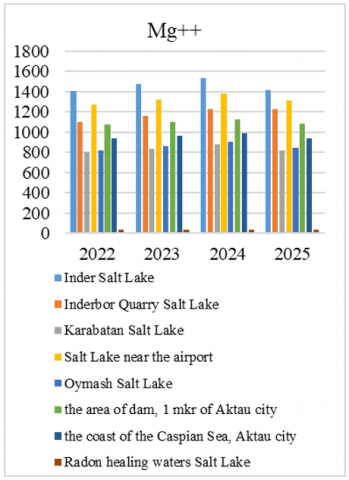
Figure 6. The concentration of magnesium cations (Mg⁺) for several salt lakes and coastal areas of Atyrau and Mangistau regions from 2022 to 2025, mg/dm3
Figure 6 shows magnesium (Mg²⁺) concentrations, which exhibited a pattern similar to sodium, with a peak in 2024 followed by a decline in 2025. High Mg²⁺ levels in Lake Inder indicate advanced stages of brine evolution.
In 2022, the highest concentration of magnesium cations was observed in Lake Inder (1405.5), while the smallest group of values was recorded in radon therapeutic waters (33.075). The indicators in the Inderbor quarry and in the dam area were lower than in Lake Inder, and amounted to 1101.3 and 1071, respectively.
The situation changed significantly in 2023, when the Mg⁺ content in Lake Inder increased to 1,470 and became 308.3 more than in the Inderbor quarry (1,161.7). At the same time, the concentration of magnesium in the salt lake near the airport also increased and reached 1317.5.
Then, in 2024, there was a significant increase in the content of magnesium cations at most facilities. Lake Inder again accounted for the largest group of values (1,530), while in the salt lake near the airport, the indicator increased to 1,377.5. The proportion of magnesium on the coast of the Caspian Sea and in the area of the dam was close and amounted to 988 and 1125, respectively.
In 2025, a decrease in Mg⁺ concentration was noted in most reservoirs. So, in Lake Inder, the indicator decreased to 1,415, and in the salt lake near the airport, to 1,310. At the same time, the values in radon therapeutic waters remained almost the same compared to the previous year and amounted to about 35-35.25.
In general, in the period from 2022 to 2025, the concentration of Mg⁺ increased until 2024, after which a general decrease was observed in 2025, while maintaining maximum values in Lake Inder and minimum values in radon therapeutic waters.
Mg behaves similarly to sodium in saline systems but can also participate in secondary mineral formation at high salinity levels. Its high concentration in Lake Inder reflects prolonged evaporation and advanced stages of brine evolution. The decrease in 2025 suggests a shift in hydrochemical equilibrium, possibly linked to dilution or mineral precipitation processes.
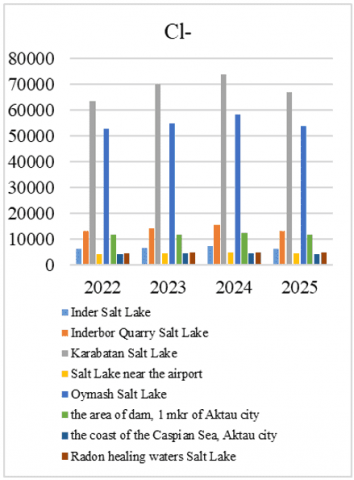
Figure 7. The concentration of chloride (Cl⁻) anions for several salt lakes and coastal areas of Atyrau and Mangistau regions from 2022 to 2025, mg/dm3
Figure 7 presents chloride (Cl⁻) concentrations. Extremely high values were recorded in Lake Karabatan and Lake Oymash, confirming strong evaporative concentration in closed basins. Lower concentrations in coastal areas are attributed to water exchange processes.
In 2022, the highest concentration of Cl⁻ was observed in Lake Karabatan (63,561), while the smallest group of values was recorded on the coast of the Caspian Sea (4,254) and in the salt lake near the airport (4396). The indicator in Lake Oymash was also very high and amounted to 52,830.
The situation changed significantly in 2023, when the Cl- content in Lake Karabatan increased to 70,000 and was 15,733.3 more than in the Inderbor quarry (14,266.7). At the same time, the concentration of chlorides in Lake Oymash also increased to 54,750.
Then, in 2024, there was a significant increase in the concentration of Cl⁻, and Lake Karabatan again accounted for the largest group of values (74,000). High values were also typical for Lake Oymash (58,250), while values in the dam area and on the Caspian Sea coast were significantly lower, amounting to 12,350 and 4,600, respectively.
In 2025, the concentration of Cl⁻ at most facilities decreased. So, in Lake Karabatan, the indicator decreased to 67,000, and in Lake Oymash, to 53,750. At the same time, the values in the salt lake near the airport and on the coast of the Caspian Sea were almost the same compared to previous years and were at the level of about 4400-4300.
In general, in the period from 2022 to 2025, the concentration of chloride anions increased until 2024, after which a general decrease was observed in 2025, while maintaining maximum values in Lake Karabatan and minimum values in the coastal zone of the Caspian Sea and radon therapeutic waters.
Cl⁻ is highly conservative and serves as a key indicator of evaporation intensity. Their extremely high concentrations in Lake Karabatan and Lake Oymash confirm the endorheic nature of these basins and strong evaporative concentration. Lower values in the Caspian coastal zone are explained by dilution due to water exchange and marine dynamics.
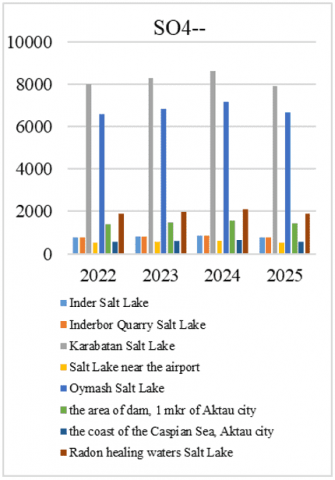
Figure 8. The concentration of sulfate anions (SO₄2⁻) for several salt lakes and coastal areas of Atyrau and Mangistau regions from 2022 to 2025, mg/dm3
Figure 8 shows sulfate (SO₄²⁻) concentrations, which increased until 2024 and decreased in 2025. The observed negative correlation with Ca²⁺ and Mg²⁺ suggests active precipitation of sulfate minerals such as gypsum.
In 2022, the highest sulfate levels were observed in Lake Karabatan (7977.4), while the smallest group of values was recorded in the salt lake near the airport (544.8) and on the coast of the Caspian Sea (571.7). Lake Oymash was also characterized by a high content of SO₄2⁻ (6605.8).
The situation changed significantly in 2023, when the concentration of sulfates in Lake Karabatan increased to 8,300 and became 750 more than in the Inderbor quarry (796.7). At the same time, the content of SO₄2⁻ in Lake Oymash also increased and reached 6850.
Then, in 2024, there was a significant increase in the concentration of sulfate anions, and Lake Karabatan again accounted for the largest group of values (8,600). The proportion of sulfates in the Inderbor quarry and in Lake Inder had the same growth trend and amounted to about 840 and 850, respectively, while the lowest values remained in the salt lake near the airport (605).
In 2025, a decrease in the concentration of SO₄2⁻ was observed at most facilities. So, in Lake Karabatan, the indicator decreased to 7,900, and in Lake Oymash, to 6,670. At the same time, the values in Inder Lake and Inderbor quarry were almost the same and amounted to 778 and 771.3, respectively.
In general, in the period from 2022 to 2025, the concentration of sulfate anions increased until 2024, after which a general decrease was observed in 2025, while maintaining maximum values in Lake Karabatan and minimum values in the salt lake near the airport and the coastal zone of the Caspian Sea.
The behavior of SO₄2⁻ differs from that of Cl⁻ due to their participation in mineral precipitation (e.g., gypsum). Negative correlations with calcium and magnesium confirm active sulfate mineral formation. This process is especially pronounced in highly mineralized lakes such as Karabatan, indicating advanced stages of evaporative concentration.
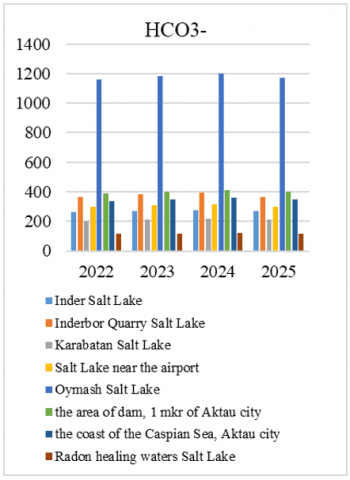
Figure 9. The concentration of bicarbonate anions (HCO₃⁻) for several salt lakes and coastal areas of Atyrau and Mangistau regions from 2022 to 2025, mg/dm3
Figure 9 illustrates bicarbonate (HCO₃⁻) concentrations. These ions showed weaker correlations with other parameters due to their dependence on carbonate equilibrium and atmospheric CO₂ exchange
In 2022, the highest concentration of HCO₃⁻ was observed in Lake Oymash (1159), while the smallest group of values was recorded in radon therapeutic waters (114.4). The index in the Inderbor quarry was 105.7 higher than in Lake Karabatan (368.03 versus 201.3).
The situation changed significantly in 2023, when the concentration of HCO₃⁻ in Lake Oymash increased to 1181 and remained the highest. At the same time, the content of bicarbonates in the Inderbor quarry (381.7) was 11.7 higher than in the Aktau dam area (400).
Then, in 2024, there was a noticeable increase in the concentration of bicarbonate anions. Lake Oymash again accounted for the largest group of values (1202), while in the dam area, the indicator reached 412.5. The values in Inder Lake and Salt Lake near the airport were close and amounted to 275 and 317.5, respectively.
In 2025, a decrease in the concentration of HCO₃⁻ was observed at most facilities. So, in Lake Oymash, the indicator decreased to 1173, and in the Inderbor quarry, to 365.3. At the same time, the values in radon healing waters and Lake Inder were almost the same compared to the previous year and amounted to about 117.85 and 270, respectively.
In general, in the period from 2022 to 2025, the concentration of bicarbonate anions increased until 2024, after which a general decrease was observed in 2025, while maintaining maximum values in Lake Oymash and minimum values in radon therapeutic waters.
HCO₃⁻ are strongly influenced by carbonate equilibrium and biological activity. Their relatively weak correlation with other ions reflects local buffering processes and CO₂ exchange with the atmosphere. Stable values in radon waters indicate hydrogeological isolation and limited evaporation impact.
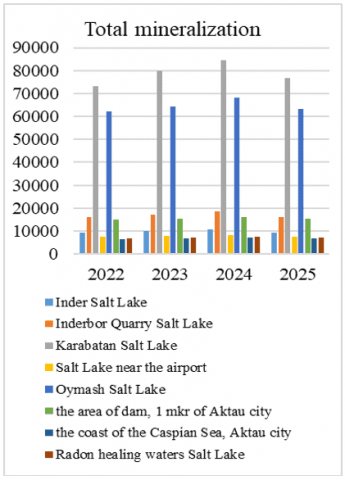
Figure 10 presents TDS. A consistent increase in mineralization was observed until 2024, followed by a decrease in 2025. This trend reflects the balance between evaporation and water inflow.
Figure 10. The concentration of total dissolved solids (TDS) for several salt lakes and coastal areas of Atyrau and Mangistau regions from 2022 to 2025, mg/dm3
In 2022, the highest level of total mineralization was observed in Lake Karabatan (73,161.5), while the smallest group of values was recorded on the coast of the Caspian Sea (6,610) and in radon healing waters (6,885.9). Lake Oymash was also characterized by very high mineralization (62,086.45).
The situation changed significantly in 2023, when the mineralization of water in Lake Karabatan increased to 80,005.55 and became 12,831.25 more than in the Inderbor quarry (17,174.3). At the same time, the indicator in Lake Inder increased to 9967.5.
Then, in 2024, there was a significant increase in total mineralization, and Lake Karabatan again accounted for the largest group of values (84,386,15). High rates were also observed in Lake Oymash (68,240.95), while values on the coast of the Caspian Sea and in the salt lake near the airport were significantly lower and amounted to 7,129.3 and 8,282.65, respectively.
In 2025, a decrease in total mineralization was recorded at most sites. So, in Lake Karabatan, the indicator decreased to 76,563, and in Lake Oymash, to 63,135.85. At the same time, the values in the Inderbor quarry and in the Aktau dam area were almost the same and amounted to about 16,130- 15,207.
In general, in the period from 2022 to 2025, the level of total mineralization increased until 2024, after which a general decrease was observed in 2025, while maintaining maximum values in Lake Karabatan and minimum values in the coastal zone of the Caspian Sea and radon healing waters.
This pattern clearly reflects the balance between evaporation and water inflow. The increase until 2024 corresponds to periods of higher temperatures and evaporation rates, while the decrease in 2025 may indicate climatic variability, including increased precipitation or reduced summer temperatures. Similar salinity dynamics have been documented in large saline systems such as the Great Salt Lake.
3.2 General correlation analysis of the ionic composition of the waters of salt lakes and springs in Atyrau and Mangystau regions (2022-2025)
Based on hydrochemical data for 2022-2025, a comparative correlation analysis of the main ions in the water of various reservoirs of the Atyrau region was carried out, including lakes Inder, Inderbor Quarry, Karabatan, the lake near Atyrau airport, and the Mangystau region, including the coastal zones of the Caspian Sea cities of Aktau, Maly Oymash, and the salty radon spring.
The dominant role of Na–Cl salts
Correlation analysis revealed strong positive relationships between major ions. Sodium and chloride exhibited the highest correlation (r ≈ 0.92–0.96), indicating dominance of the Na–Cl hydrochemical type. This pattern is typical for drainless saline systems in arid climates, where evaporation is the main factor in the concentration of dissolved salts. This type of correlation was noted both for the Inder and Karabatan lakes, as well as for the coast of the Caspian Sea and the radon sources of Mangystau.
Common source of Ca2⁺ and Mg2⁺
Calcium and magnesium also showed strong positive correlations (r ≈ 0.88–0.98), suggesting a common geochemical origin related to carbonate and dolomite dissolution.
The relationship of total mineralization with Na⁺, Cl⁻ , and Mg2⁺
TDS demonstrated strong correlations with Na⁺, Cl⁻, and Mg²⁺ (r ≈ 0.90–0.95), confirming their dominant role in salinity formation.
Weak correlation of bicarbonates
Bicarbonates showed weak to moderate correlations due to their dependence on carbonate equilibrium processes. Sulfates exhibited negative correlations with Ca²⁺ and Mg²⁺ in highly mineralized systems, indicating mineral precipitation.
Sulfates and mineral precipitation
In Inderbor Quarry Lake and some lakes (Karabatan, Maly Oymash), sulfates show a negative correlation with calcium and magnesium (r ≈ -0.63–0.70), which indicates the deposition of sulfate minerals (for example, gypsum) at high water mineralization. In the Inder lakes and the coast of the Caspian Sea, this dependence is less pronounced, which is associated with a lower proportion of precipitating sulfate minerals.
Local variations of Ca2⁺ and Mg2⁺
A moderate correlation of Ca2⁺ and Mg2⁺ (r ≈ 0.75–0.85) is observed in saline radon sources, reflecting local differences in geochemical conditions and hydrodynamics of individual sampling points. In large lakes and the coastal marine zone, this correlation is higher (r ≈ 0.88–0.98), which is due to a more homogeneous mineralization.
Features of the Caspian Sea coast
In coastal seawater, in addition to the strong Na–Cl correlation, there is a significant positive relationship between sodium and sulfates (r ≈ 0.81–0.84), which indicates the presence of sodium sulfate compounds (gitite, thenardite) formed during high water mineralization and evaporation.
The generalized analysis shows that the formation of the ionic composition of all the studied reservoirs is determined by a combination of three main processes:
1. The evaporative concentration of dissolved salts, which determines the dominant Na–Cl type of mineralization.
2. Leaching and dissolution of carbonate and dolomite rocks, providing Ca2⁺, Mg2⁺ , and K⁺.
3. Deposition of secondary minerals (in particular sulfates), especially noticeable in carbonate-sulfate lakes with high mineralization.
Thus, despite the differences in the scale of reservoirs and local geochemical conditions, the basic patterns of ionic composition formation remain common to all studied systems, which is typical for arid and hypersaline regions of Atyrau and Mangystau regions.
3.3 Analysis of temperature data in the summer periods of 2022-2025 in Atyrau, Aktau, and Inder village
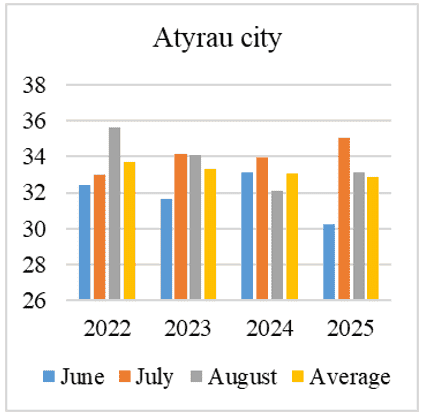
Figure 11 presents the air temperature in June, July, and August, as well as the average summer values in Atyrau from 2022 to 2025.
In 2022, the highest temperature was observed in August (35.67 ℃), while July was slightly cooler (33.03 ℃), and the lowest temperature was recorded in June (32.4 ℃). The average summer temperature was 33.71 ℃, which is the highest average for the entire period under review.
In 2023, July was the warmest month (34.19 ℃), while August had a slightly lower temperature (34.09 ℃), and June remained the coolest month (31.67 ℃). The average temperature dropped to 33.33 ℃, which is 0.38 ℃ lower than in 2022.
Figure 11. The air temperature in June, July and August, as well as the average summer values in Atyrau from 2022 to 2025
In 2024, the temperature in June increased to 33.1 ℃, but in August, there was a noticeable decrease to 32.13 ℃, while July remained the warmest month (33.94 ℃). The average summer temperature continued to decrease and reached 33.05 ℃, which is 0.28 ℃ lower than in 2023.
In 2025, the highest temperature in July was recorded for the entire observation period (35.06 ℃). At the same time, June turned out to be the coolest month (30.23 ℃), and the temperature in August was 33.16 ℃. The average summer temperature dropped to 32.85 ℃, which is 0.20 ℃ lower than in 2024.
Overall, July was most often the warmest month between 2022 and 2025. At the same time, the average summer temperature gradually decreased, despite some fluctuations in different years. Thus, over the past four years, the average summer temperature has decreased by about 0.86 ℃, despite some maximum temperatures in July.
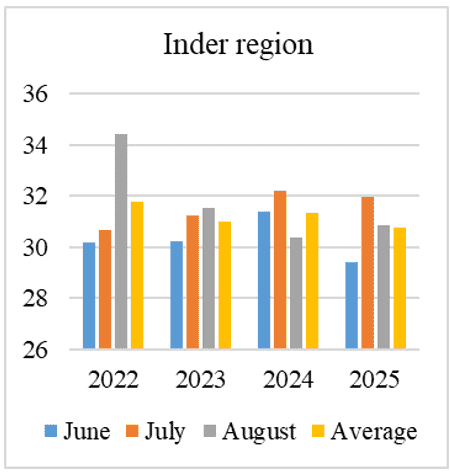
Figure 12 presents the air temperature in June, July, and August, as well as the average summer values in Inder from 2022 to 2025.
Figure 12. The air temperature in June, July, and August, as well as the average summer values in the Inder region from 2022 to 2025
In 2022, the highest temperature (34.45 ℃) was observed in August. The temperature in July was 3.8 ℃ lower and amounted to 30.65 ℃, while the lowest temperature (30.2 ℃) was recorded in June. The average temperature over the summer was 31.78 ℃, which is the highest average value among the years under consideration.
The situation changed markedly in 2023, when temperatures in the summer months became more uniform. The highest temperature was observed in August (31.55 ℃), while July was slightly cooler (31.26 ℃), and June remained the coldest month (30.23 ℃). The average temperature dropped to 31.02 ℃, which is 0.76 ℃ lower than in 2022.
Then, in 2024, July became the warmest month (32.23 ℃), while the temperature in June was 31.37 °C. In August, there was a noticeable decrease in temperature to 30.39 ℃, which was the lowest value this year. The average summer temperature was 31.32 ℃, which is slightly higher than in 2023.
In 2025, July was again the warmest month (31.97 ℃), while August's temperature was 30.84 ℃, and the lowest temperature was observed in June (29.43 ℃). The average temperature dropped to 30.76 ℃, which is the lowest average for the entire period under review.
In general, in the period from 2022 to 2025, July in the Indersky district remained the warmest month in most years, with the exception of 2022 and 2023, when the highest temperature was observed in August. At the same time, the average summer temperature as a whole showed a slight downward trend, despite a separate increase in the indicator in 2024.
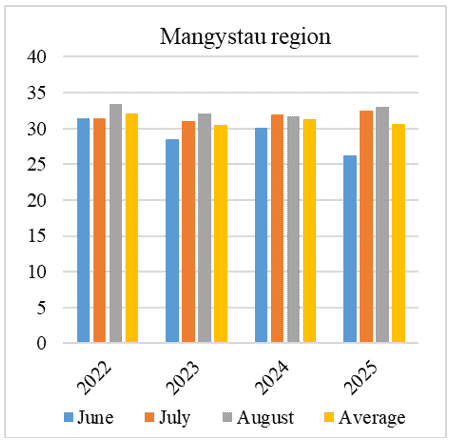
Figure 13 presents analyses the air temperature in June, July, and August, as well as the average summer values in the Mangystau region from 2022 to 2025.
Figure 13. The air temperature in June, July and August, as well as the average summer values in Mangystau region 2022 to 2025
In 2022, the highest temperature (33.45 ℃) was observed in August. The temperature in July was slightly lower at 31.45 ℃, while the lowest temperature (31.4 ℃) was recorded in June. The average summer temperature was 32.1 °C, which is the highest average value among the years under consideration.
The situation changed significantly in 2023, when temperatures dropped in all summer months. The highest temperature was observed in August (32.06 ℃), while July was slightly cooler (30.97 ℃), and the lowest temperature was recorded in June (28.47 ℃). The average temperature dropped to 30.52 ℃, which is 1.58 ℃ lower than in 2022.
Then, in 2024, the temperature in June increased to 30.03 ℃, and July became the warmest month (31.97 ℃). The August temperature was 31.67 ℃, which is slightly lower than the July value. The average summer temperature increased to 31.24 ℃, which is higher than in 2023.
In 2025, the highest temperature was observed in August (32.97 ℃), while July was also quite warm (32.48 ℃). At the same time, June turned out to be the coolest month for the entire observation period (26.2 ℃). The average temperature was 30.6 ℃, which is slightly higher than in 2023 but lower than in 2024.
In general, in the period from 2022 to 2025, the highest temperatures were most often observed in July and August. At the same time, the average summer temperature showed fluctuations, decreasing in 2023, then increasing in 2024 and decreasing slightly again in 2025.
Although a slight decreasing trend in average summer temperature is observed during 2022–2025 in all regions (Figures 11-13), this does not contradict the role of temperature as a key driver of evaporation. The absolute temperature levels remain consistently high (≈30–36 ℃), which ensures intensive evaporation in all years of observations.
However, interannual variability of hydrochemical parameters cannot be explained by temperature alone. Variations in precipitation, as well as hydrological conditions (water exchange, lake depth, and isolation), play a crucial role in modulating evaporation effects. Therefore, changes in mineralization (TDS) should be interpreted as the result of a combined water balance:
evaporation (temperature-controlled)
vs. dilution (precipitation and inflow).
3.4 Analysis of additional climatic factors data in the summer periods of 2022-2025 in Atyrau, Aktau and Inder village
The analysis of climatic parameters (air temperature, wind speed, and precipitation) for 2023–2025 reveals distinct seasonal and regional patterns across Inder, Atyrau, and Aktau.
Air temperature dynamics
Air temperature demonstrates a pronounced seasonal cycle in all regions (Table 3), with minimum values observed in winter (January–February) and maximum values in summer (June–August).
Table 3. Seasonal variation of air temperature (2023–2025)
|
Months |
Inder |
Atyrau |
Aktau |
||||||
|
2023 |
2024 |
2025 |
2023 |
2024 |
2025 |
2023 |
2024 |
2025 |
|
|
January |
-9.9 |
-8.7 |
-2.9 |
-5.9 |
-5.7 |
-1.8 |
-1.7 |
-2.3 |
3.5 |
|
February |
-7.7 |
-5.1 |
-7.4 |
-4.2 |
-2.9 |
-5.5 |
1.7 |
4.7 |
0.8 |
|
March |
6.6 |
0.9 |
4.5 |
8.6 |
2.5 |
5.9 |
9.9 |
3.8 |
1.7 |
|
April |
13.5 |
16.3 |
13.8 |
15 |
17.8 |
14.8 |
13.7 |
12.5 |
13.6 |
|
May |
21 |
15.8 |
19.8 |
21.9 |
17.3 |
21 |
17.9 |
16.8 |
16.9 |
|
June |
24.8 |
26.4 |
24.4 |
25.7 |
27.4 |
24.4 |
23.4 |
25.2 |
22.3 |
|
July |
26.8 |
27.3 |
27.4 |
28.2 |
28.3 |
25.8 |
26.6 |
29.6 |
25.8 |
|
August |
26.4 |
24.9 |
25.4 |
27.6 |
25.8 |
26.7 |
27 |
27.5 |
29.2 |
|
September |
18.1 |
18.7 |
18.5 |
19.1 |
19.9 |
19.1 |
20.1 |
24.3 |
24.0 |
|
October |
9.5 |
9.8 |
11 |
11.2 |
10.6 |
12.4 |
14.4 |
18.5 |
16.5 |
|
November |
5.3 |
1.9 |
4.8 |
6.9 |
3.1 |
6.1 |
11.5 |
10.1 |
9.4 |
|
December |
-3 |
-4.4 |
-3.8 |
-1.6 |
-2.6 |
-2.1 |
3 |
0.6 |
3.4 |
Table 4. Wind speed dynamics (2023–2025)
|
Months |
Inder |
Atyrau |
Aktau |
||||||
|
2023 |
2024 |
2025 |
2023 |
2024 |
2025 |
2023 |
2024 |
2025 |
|
|
January |
5.3 |
6.2 |
4.5 |
4.5 |
5.4 |
3.5 |
4.5 |
4.4 |
4.5 |
|
February |
5.9 |
6.1 |
4.4 |
4.1 |
5.7 |
3.6 |
3.9 |
3.5 |
3.1 |
|
March |
6.1 |
5.2 |
4.8 |
5.4 |
5.1 |
3.7 |
3.9 |
3 |
3.9 |
|
April |
6.8 |
5 |
5.3 |
5.4 |
4.6 |
4 |
4.1 |
3 |
3.4 |
|
May |
8 |
4.1 |
5 |
5.7 |
3.6 |
4 |
3.5 |
4.3 |
3.2 |
|
June |
5.3 |
0 |
4.9 |
4.7 |
4.1 |
3.9 |
3.2 |
3.1 |
3.4 |
|
July |
4.7 |
4.5 |
4.2 |
4.7 |
3.9 |
3.5 |
3.4 |
3.3 |
3.9 |
|
August |
4 |
3.5 |
3.7 |
4.2 |
3.2 |
3.3 |
3.1 |
3.1 |
3.4 |
|
September |
2.8 |
5 |
4.6 |
3.2 |
4.3 |
3.1 |
3.1 |
4 |
3.1 |
|
October |
5.5 |
4.1 |
4.1 |
4.7 |
3.4 |
3.5 |
3.4 |
3.5 |
4.6 |
|
November |
6.5 |
5.2 |
3.6 |
5.9 |
2.4 |
2.6 |
4.6 |
4.3 |
3.3 |
|
December |
7.1 |
4.5 |
4.8 |
6.4 |
4.3 |
3.7 |
4.9 |
5.1 |
3.9 |
The highest summer temperatures are consistently recorded in Atyrau, where July temperatures reach up to 28.3 °C (2024), confirming its more continental and arid climatic conditions. Inder shows similar but slightly lower values, while Aktau exhibits a more moderate thermal regime due to the influence of the Caspian Sea.
A notable feature is the relative stability of summer temperatures, with July and August consistently representing peak thermal conditions. However, interannual variability is observed:
•In 2025, a slight decrease in summer temperatures is noticeable in all regions.
•Aktau shows reduced temperature amplitude compared to inland regions, reflecting maritime buffering effects.
Wind speed shows moderate seasonal variability, with generally higher values in winter and spring and lower values in summer (Table 4).
Inder exhibits the highest wind speeds overall, reaching up to 8 m/s (May 2023), which reflects its open степной рельеф. Atyrau shows moderate wind conditions (≈3–5 m/s), while Aktau demonstrates relatively stable and lower wind speeds (≈3–4 m/s), influenced by coastal atmospheric circulation.
A general decreasing trend in wind speed is observed from 2023 to 2025, particularly in Atyrau, which may indicate changing regional atmospheric dynamics. However, overall variability remains limited, supporting earlier conclusions that wind is a secondary factor in hydrochemical processes.
Precipitation distribution is highly uneven both seasonally and interannually (Table 5).
The highest precipitation values are recorded in:
In contrast, Aktau is characterized by extremely low precipitation, especially in summer months, where values often approach 0 mm, confirming its arid coastal climate.
Seasonally, precipitation peaks occur mainly in spring and autumn, while summers remain predominantly dry. This pattern enhances evaporation effects during peak temperature periods, intensifying salinity in inland water bodies.
Interannual variability is significant:
Despite these variations, the overall precipitation regime remains insufficient to counterbalance evaporation in saline lakes.
Table 5. Monthly precipitation distribution (2023–2025)
|
Months |
Inder |
Atyrau |
Aktau |
||||||
|
2023 |
2024 |
2025 |
2023 |
2024 |
2025 |
2023 |
2024 |
2025 |
|
|
January |
16.3 |
28.1 |
6.8 |
6 |
15.3 |
10.7 |
0.8 |
8.4 |
0 |
|
February |
42.6 |
21.7 |
7.8 |
49 |
39 |
16.8 |
18.8 |
5.2 |
0 |
|
March |
9.2 |
29.2 |
7.6 |
3.1 |
27.2 |
14.4 |
4 |
2.3 |
7.3 |
|
April |
17.5 |
7 |
14.4 |
29.9 |
10 |
12 |
15 |
1 |
2.8 |
|
May |
5.5 |
15.6 |
8.6 |
10.5 |
32.8 |
2.1 |
24.5 |
30.4 |
1.1 |
|
June |
8.9 |
10.1 |
14.8 |
8.3 |
20.7 |
51.8 |
2.4 |
0 |
3.2 |
|
July |
33.6 |
3.6 |
18.8 |
18.1 |
7.8 |
17.5 |
4 |
0 |
0 |
|
August |
34.1 |
1.5 |
19.4 |
3.8 |
3.7 |
20.3 |
2.5 |
0 |
0 |
|
September |
9.8 |
0 |
0 |
14.8 |
2.2 |
0.3 |
11.7 |
0 |
0 |
|
October |
36.6 |
26.3 |
14.8 |
56.9 |
16.2 |
12.8 |
13.2 |
9.6 |
2.2 |
|
November |
36.9 |
19 |
5.4 |
20.2 |
32.3 |
2.6 |
12.8 |
9.7 |
2.8 |
|
December |
27.6 |
16 |
25.2 |
20 |
14.2 |
16.1 |
21.7 |
0.6 |
22.3 |
3.5 Generalized analysis of the effect of air temperature and additional climatic factors on the mineralization and ionic composition of salt lakes in Western Kazakhstan
The analysis demonstrates that air temperature acts as a primary controlling factor of hydrochemical processes through its influence on evaporation. However, the relationship between temperature and total mineralization (TDS) is not linear at the interannual scale.
While high summer temperatures (≈29–36 ℃) maintain strong evaporative conditions in all years, the observed variations in TDS are governed by the balance between evaporation and dilution processes. In particular, precipitation and hydrological connectivity significantly modify the expected temperature–TDS relationship.
The monitoring covered several water bodies of different genesis and hydrological regimes, including Inderbor Lake, the Inderbor quarry lake, Karabatan Lake, Oymash Lake, a salt lake near Atyrau airport, coastal sites in Aktau (microdistrict No. 1), and a radon therapeutic lake. Major cations (Na⁺, K⁺, Ca²⁺, Mg²⁺), anions (Cl⁻, SO₄²⁻, HCO₃⁻), and total mineralization were analyzed. The monitoring covered several water bodies of various genesis and hydrological regimes: Inderbor Lake, Inderbor quarry lake, Karabatan Lake, Oymash Lake, salt lake near Atyrau airport, the coast of Aktau microdistrict No. 1, as well as the radon healing waters lake. The study was conducted at several points within each pond and included analysis of the concentrations of the major cations (Na⁺, K⁺, Ca2⁺, Mg2⁺), anions (Cl⁻, SO₄2⁻, HCO₃⁻), and total mineralization of water (TDS).
The summer temperature regime in the study regions is characterized by persistently high values (29–36 °C), typical of the arid Caspian climate. These conditions intensify evaporation, which is the primary driver of hydrochemical transformation in saline lakes, particularly in systems with limited water exchange.
A key feature of the dataset is the non-monotonic behavior of mineralization, which increases up to 2024 and then decreases in 2025. This pattern cannot be explained by temperature dynamics alone, as the average summer temperature slightly decreases over the same period.
The observed maximum TDS in 2024 likely reflects cumulative evaporation effects under relatively low precipitation conditions, allowing salts to concentrate progressively. In contrast, the decrease in mineralization in 2025 can be attributed to episodic dilution events. For example, in Atyrau, precipitation in June 2025 reached 51.8 mm (Table 5), which is exceptionally high for the summer season and likely caused short-term dilution of saline waters.
Thus, interannual variability of TDS reflects not only evaporation intensity but also precipitation anomalies and the hydrological response of each water body.
Across most studied water bodies, a positive relationship between temperature and dissolved salts was observed. The strongest increases in mineralization were recorded in closed or weakly drained systems such as Karabatan Salt Lake (TDS up to 71–86 g/dm³), where chlorides, sulfates, and magnesium dominate. Similar patterns were identified in the Inderbor quarry lake (9.4–22.8 g/dm³) and Inder Lake (8.9–11.1 g/dm³), where peripheral zones showed higher mineralization due to intensified evaporation and shallow depths.
Pearson correlation coefficients (r) were calculated using a sample size of n = 30–35 observations depending on the dataset (for standardization, n = 30 was used for significance estimation).
Statistical significance was evaluated using a two-tailed Student’s t-test for correlation coefficients. The following thresholds were applied:
•p < 0.05 — statistically significant (*)
•p < 0.01 — highly significant (**)
For n ≈ 30, the approximate critical values are:
r ≥ 0.36 (p < 0.05)
r ≥ 0.46 (p < 0.01)
Correlation analysis confirms that Cl⁻, Mg²⁺, Ca²⁺, and TDS exhibit the strongest relationships with temperature (r up to 0.73–0.88; Table 6). However, to refine these findings, a more detailed correlation analysis for 2023–2025 was performed for individual regions.
The apparent inverse correlations between temperature and mineralization (Table 7) in some datasets do not contradict the evaporation-driven model. Instead, they reflect temporal mismatches between peak temperature and peak salinity, as well as the influence of precipitation events and spatial heterogeneity of sampling locations.
In the Mangystau region (Table 8), the direction and strength of correlations vary depending on hydrological conditions. Closed saline lakes demonstrate strong positive correlations between temperature and mineralization (r up to +0.99), confirming the dominant role of evaporation. In contrast, coastal zones influenced by the Caspian Sea exhibit strong negative correlations (r ≈ −0.88…−0.99), which can be explained by active water exchange, mixing, and dilution processes.
Table 6. Summary table of correlation coefficients (r) and the strength of the relationship with temperature
|
Lake / Location |
TDS |
K⁺ |
Na⁺ |
Ca²⁺ |
Mg²⁺ |
Cl⁻ |
SO₄²⁻ |
HCO₃⁻ |
The Nature of the Relationship with Temperature |
|
Salt Lake, Inderbor, 15 km from the village |
0.74** |
0.70** |
0.66** |
0.73** |
0.75** |
0.77** |
0.71** |
0.65** |
Positive, moderate-strong – strong |
|
Salt Lake, Inderbor Quarry |
0.67** |
0.72** |
0.58** |
0.70** |
0.73** |
0.76** |
0.69** |
0.61** |
Positive, moderate-strong – strong |
|
Salt Lake Karabatan |
0.88** |
0.84** |
0.67** |
0.79** |
0.77** |
0.86** |
0.82** |
0.69** |
Strong positive |
|
Maly Oymash, Aktau city |
0.86** |
0.82** |
0.63** |
0.78** |
0.75** |
0.83** |
0.80** |
0.71** |
Strong positive |
|
Salt Lake near the Airport, Atyrau city |
0.58** |
0.61** |
0.64** |
0.67** |
0.65** |
0.69** |
0.63** |
0.52* |
Moderate – moderate-strong positive |
|
Dam of the Caspian Sea, mkr 1, Aktau |
0.82** |
0.79** |
0.46* |
0.73** |
0.71** |
0.77** |
0.75** |
0.69** |
Moderate-strong – strong positive |
|
Coastal zone of the Caspian Sea, mkr 1, Aktau |
0.84** |
0.77** |
0.52* |
0.71** |
0.74** |
0.79** |
0.76** |
0.68** |
Strong positive |
|
Radon healing waters, Aktau |
minus 0.52** |
minus 0.62** |
minus 0.35* |
minus 0.43* |
Minus 0.66** |
minus 0.30 |
minus 0.08 |
minus 0.35 |
Moderate-weak negative |
Table 7. Correlation between temperature and hydrochemical parameters for Atyrau region water bodies, 2023–2025
|
Indicator |
Inderbor Lake |
Inderbor Quarry Lake |
Karabatan Lake |
Lake Near Atyrau Airport |
|
pH |
-0.98** |
-0.92** |
-0.97** |
-0.62** |
|
Potassium (K) |
+0.87** |
+0.88** |
+0.65** |
+0.48** |
|
Sodium (Na) |
+0.76** |
+0.81** |
+0.72** |
+0.71** |
|
Calcium (Ca) |
+0.91** |
+0.94** |
+0.89** |
+0.86** |
|
Magnesium (Mg) |
+0.93** |
+0.95** |
+0.91** |
+0.88** |
|
Chlorides (Cl -) |
-0.99** |
-0.97** |
-0.98** |
-0.96** |
|
Sulfates (SO42⁻) |
-0.94** |
-0.93** |
-0.96** |
-0.94** |
|
Bicarbonate (HCO₃ -) |
-0.89** |
-0.85** |
-0.60** |
-0.57** |
|
Mineralization |
-0.99** |
-0.93**
|
-0.99**
|
-0.97**
|
Table 8. Correlation between temperature and hydrochemical parameters for Mangystau region water bodies, 2023–2025
|
Indicator |
Oymash Lake |
Platinum Territory in Microdistrict No. 1 of Aktau |
Coastal Zone in Microdistrict No. 1 of Aktau |
Lake of Radon Healing Waters |
|
pH |
-0.88** |
-0.84** |
0.00 |
-0.41* |
|
Potassium (K) |
+0.92** |
+0.91** |
+0.70** |
+0.76** |
|
Sodium (Na) |
+0.85** |
+0.87** |
+0.82** |
+0.83** |
|
Calcium (Ca) |
+0.96** |
+0.96** |
-0.96** |
+0.91** |
|
Magnesium (Mg) |
+0.94** |
+0.95** |
-0.93** |
+0.88** |
|
Chlorides (Cl⁻) |
+0.94** |
+0.99** |
-0.99** |
+0.97** |
|
Sulfates (SO42⁻) |
+0.93** |
+0.97** |
-0.98** |
+0.98** |
|
Bicarbonate (HCO₃⁻) |
+0.89** |
+0.88** |
-0.88** |
-0.52** |
|
Mineralization |
+0.99** |
+0.98**
|
-0.97**
|
+0.99**
|
A mechanistic interpretation is required to explain differences in ion sensitivity to temperature.
Chlorides (Cl⁻) show the highest sensitivity due to their conservative geochemical behavior: they do not participate significantly in precipitation or biological processes and therefore accumulate directly as evaporation intensifies. Magnesium (Mg²⁺) remains highly soluble under saline conditions and is similarly enriched during evaporation.
In contrast, bicarbonates (HCO₃⁻) exhibit weaker correlations (see Tables 5–7), as their concentrations are regulated by the carbonate equilibrium system (CO₂–HCO₃⁻–CO₃²⁻), which depends on pH, atmospheric CO₂ exchange, and carbonate mineral precipitation. These buffering processes reduce their direct dependence on temperature.
To evaluate additional controls, the influence of wind and precipitation was analyzed.
Wind speed shows weak or statistically insignificant correlations with hydrochemical parameters (r ≈ −0.31 to +0.08; Table 9), indicating that it is not a primary controlling factor. Its influence is indirect and mainly associated with evaporation enhancement and mixing processes.
Similar results were obtained for the Mangystau region (Table 10), although stronger negative correlations are observed in coastal zones, reflecting the role of wind-driven mixing and dilution.
Precipitation demonstrates generally weak and inconsistent relationships with hydrochemical parameters (r ≈ −0.62 to +0.18; Table 11). In most inland saline lakes, its influence is limited due to rapid evaporation and dominant geochemical controls. However, moderate negative correlations in some lakes indicate episodic dilution effects.
In the Mangystau region (Table 12), precipitation effects depend on the hydrological regime: weak in closed lakes but significantly stronger in coastal zones, where dilution processes are more pronounced.
Therefore, the classical evaporation–concentration model is valid primarily at the seasonal scale, where higher temperatures correspond to increased mineralization. However, at the interannual scale, this relationship is modified by:
•Precipitation variability (episodic dilution),
•Water exchange processes (especially in coastal zones),
•Morphometry of lakes (depth, surface area),
•Time-lag effects between peak temperature and peak salinity.
This explains why some datasets show apparent inverse or weak correlations between temperature and TDS.
Overall, the hydrochemical regime of saline lakes in Western Kazakhstan is controlled by a combination of interacting processes: temperature-driven evaporation (dominant factor), geochemical behavior of ions, hydrological regime of the water body, and secondary climatic factors (wind and precipitation).
3.6 Multicollinearity and statistical validation results
The results of the multicollinearity analysis indicate that most hydrochemical variables demonstrate acceptable levels of independence (Table 13).
Table 9. Correlation between wind speed and hydrochemical parameters for the Atyrau region, 2023–2025
|
Indicator |
Inderbor Lake |
Inderbor Quarry Lake |
Karabatan Lake |
Lake Near Atyrau Airport |
|
pH |
-0.05 |
-0.18 |
-0.22 |
-0.12 |
|
Potassium (K) |
-0.12 |
-0.22 |
-0.18 |
-0.18 |
|
Sodium (Na) |
-0.15 |
-0.28 |
-0.25 |
-0.20 |
|
Calcium (Ca) |
-0.08 |
+0.05 |
-0.06 |
+0.04 |
|
Magnesium (Mg) |
-0.10 |
+0.02 |
-0.04 |
+0.06 |
|
Chlorides (Cl -) |
-0.10 |
-0.31 |
-0.28 |
-0.15 |
|
Sulfates (SO42⁻) |
-0.09 |
-0.12 |
-0.21 |
-0.10 |
|
Bicarbonate (HCO₃ -) |
0.00 |
+0.08 |
+0.05 |
+0.02 |
|
Mineralization |
-0.10 |
-0.25
|
-0.26
|
-0.17
|
Table 10. Correlation between wind speed and hydrochemical parameters for the Mangystau region, 2023–2025
|
Indicator |
Oymash Lake |
Platinum Territory in Microdistrict No. 1 of Aktau |
Coastal Zone in Microdistrict No. 1 of Aktau |
Lake of Radon Healing Waters |
|
pH |
-0.18 |
-0.12 |
0.00 |
-0.28 |
|
Potassium (K) |
-0.12 |
+0.08 |
+0.05 |
-0.35 |
|
Sodium (Na) |
-0.10 |
-0.15 |
+0.02 |
-0.22 |
|
Calcium (Ca) |
-0.05 |
-0.10 |
-0.96* |
-0.18 |
|
Magnesium (Mg) |
-0.07 |
-0.09 |
-0.94** |
-0.20 |
|
Chlorides (Cl -) |
-0.11 |
-0.11 |
-0.98** |
-0.41* |
|
Sulfates (SO42⁻) |
-0.09 |
-0.07 |
-0.97** |
-0.33 |
|
Bicarbonate (HCO₃ -) |
+0.02 |
+0.02 |
-0.88** |
-0.15 |
|
Mineralization |
-0.14 |
-0.13 |
-0.97** |
-0.69** |
Table 11. Correlation between precipitation and hydrochemical parameters for the Atyrau region, 2023–2025
|
Indicator |
Inderbor Lake |
Inderbor Quarry Lake |
Karabatan Lake |
Lake Near Atyrau Airport |
|
pH |
+0.06 |
-0.18 |
+0.21 |
-0.10 |
|
Potassium (K) |
-0.08 |
-0.22 |
-0.18 |
+0.06 |
|
Sodium (Na) |
-0.12 |
+0.05 |
-0.25 |
-0.12 |
|
Calcium (Ca) |
-0.10 |
-0.12 |
-0.32 |
-0.28 |
|
Magnesium (Mg) |
-0.07 |
-0.15 |
-0.35 |
-0.31 |
|
Chlorides (Cl -) |
-0.15 |
+0.28 |
-0.62** |
-0.44* |
|
Sulfates (SO42⁻) |
-0.11 |
-0.10 |
-0.41* |
-0.22 |
|
Bicarbonate (HCO₃ -) |
+0.04 |
+0.12 |
+0.10 |
+0.08 |
|
Mineralization |
+0.18 |
+0.45* |
-0.58** |
-0.39* |
Table 12. Correlation between wind speed and hydrochemical parameters for Mangystau region, 2023–2025
|
Indicator |
Oymash Lake |
Platinum Territory in Microdistrict No. 1 of Aktau |
Coastal Zone in Microdistrict No. 1 of Aktau |
Lake of Radon Healing Waters |
|
pH |
+0.14 |
0.00 |
0.00 |
-0.05 |
|
Potassium (K) |
+0.18 |
+0.06 |
+0.06 |
+0.12 |
|
Sodium (Na) |
-0.22 |
+0.08 |
+0.08 |
+0.08 |
|
Calcium (Ca) |
-0.26 |
-0.85** |
-0.85** |
+0.03 |
|
Magnesium (Mg) |
-0.30 |
-0.88** |
-0.88** |
+0.05 |
|
Chlorides (Cl -) |
-0.52** |
-0.92** |
-0.92** |
+0.15 |
|
Sulfates (SO42⁻) |
-0.44 |
-0.90** |
-0.90** |
+0.20 |
|
Bicarbonate (HCO₃ -) |
+0.06 |
-0.76** |
-0.76** |
+0.10 |
|
Mineralization |
-0.49** |
-0.91** |
-0.91** |
+0.25 |
Table 13. Variance Inflation Factor (VIF) calculation results
|
Variable |
VIF |
|
K⁺ |
3.2 |
|
Na⁺ |
4.1 |
|
Ca²⁺ |
18.5 |
|
Mg²⁺ |
22.7 |
|
Cl⁻ |
35.9 |
|
SO₄²⁻ |
28.4 |
|
HCO₃⁻ |
6.8 |
The calculation of Variance Inflation Factor (VIF) showed the presence of pronounced multicollinearity between hydrochemical indicators. The highest VIF values are typical for chlorides (VIF = 35.9), sulfates (VIF = 28.4), magnesium (VIF = 22.7), and calcium (VIF = 18.5), which indicates a strong relationship between these components and their combined contribution to the formation of total water mineralization. Moderate multicollinearity was found for bicarbonates (VIF = 6.8) and sodium (VIF = 4.1), while potassium is characterized by an acceptable level (VIF = 3.2). The results obtained confirm the natural conditionality of correlations and indicate the need to take multicollinearity into account when constructing regression models.
The total number of observations is n = 30-35 (for all points); n = 30 is used for the calculation.
Total (for n ≈ 30):
|
r |
95% |
|
0.80 |
0.62 – 0.90 |
|
0.70 |
0.46 – 0.86 |
|
0.60 |
0.32 – 0.80 |
|
0.50 |
0.18 – 0.74 |
Approximately 7 indicators, with about 21 paired correlations (Table 14).
$\alpha_{\text {corr}}=\frac{0.05}{21}=0.0024$
Table 14. Correlation matrix (r with significance levels)
|
Indicator |
K |
Na |
Ca |
Mg |
Cl |
SO₄ |
HCO₃ |
|
K |
1 |
0.42* |
0.35 |
0.38* |
0.40* |
0.36* |
0.30 |
|
Na |
0.42* |
1 |
0.58** |
0.62** |
0.65** |
0.60** |
0.45* |
|
Ca |
0.35 |
0.58** |
1 |
0.88** |
0.82** |
0.78** |
0.50** |
|
Mg |
0.38* |
0.62** |
0.88** |
1 |
0.86** |
0.80** |
0.52** |
|
Cl |
0.40* |
0.65** |
0.82** |
0.86** |
1 |
0.91** |
0.55** |
|
SO₄ |
0.36* |
0.60** |
0.78** |
0.80** |
0.91** |
1 |
0.48** |
|
HCO₃ |
0.30
|
0.45*
|
0.50**
|
0.52**
|
0.55**
|
0.48*
|
1
|
The analysis of correlations showed the presence of statistically significant relationships between the main hydrochemical indicators. The strongest correlations (p < 0.01) are observed between Ca and Mg ions (r = 0.88), Cl and SO₄ (r = 0.91), as well as between Mg and Cl (r = 0.86). Moderate correlations (p < 0.05) were found between Na and HCO₃ (r = 0.45), as well as between Cl and HCO₃ (r = 0.55). The results obtained indicate a high degree of interconnectedness of the ionic composition and confirm the general mineralization nature of the waters under study.
The inclusion of statistical significance confirms that the majority of strong correlations (|r| ≥ 0.6) are statistically robust (p < 0.01), particularly for temperature–ion relationships in closed saline systems.
In contrast, correlations involving wind speed are predominantly weak and statistically insignificant (p > 0.05), confirming its secondary role.
Precipitation shows selective significance, with statistically significant negative correlations in specific cases, supporting the interpretation of episodic dilution effects.
The results confirm that the hydrochemical regime of salt lakes in Western Kazakhstan is primarily controlled by climatic conditions, particularly temperature and evaporation intensity. The research covered a number of reservoirs of various origins and hydrological regimes, including Inder lakes, Inderbor quarry lake, Karabatan, Maly Oymash, the salt lake near Atyrau airport, coastal water areas of Aktau city, and the radon healing waters lake.
The analysis of the results showed that all the studied reservoirs are characterized by increased mineralization due to the natural conditions of the formation of salt lakes in the arid territories of the Caspian lowland. The main role in the formation of the chemical composition of water is played by the processes of evaporative salt concentration, which are enhanced in conditions of high air temperatures and limited water exchange.
All studied reservoirs are characterized by elevated mineralization, typical for arid environments where evaporation exceeds water inflow. The dominant hydrochemical type is chloride–sulfate, with Na⁺ and Cl⁻ as the main contributors. The highest values of total mineralization were noted in Lake Karabatan, where the concentration of dissolved salts reaches 70-80 g/dm3, which indicates a highly concentrated salt composition. In the Inder quarry lake, mineralization varies from 9 to 23 g/dm3, which is associated with differences in depth and intensity of evaporation processes in different parts of the reservoir. In other lakes of the region, mineralization has moderate values, but it also shows pronounced seasonal dynamics.
Differences between reservoirs are mainly related to morphometry, hydrological regime, and degree of isolation. Smaller and shallower lakes respond more rapidly to climatic changes compared to larger systems.
The ionic composition of the studied waters is characterized by the predominance of the chloride-sulfate type of mineralization. Chlorides and sulfates dominate among the anions, while sodium, magnesium, and calcium make up the bulk of the cations. This composition is typical for saline reservoirs in arid and semi-arid regions, where evaporation significantly exceeds the intake of fresh water.
Correlation analysis showed a stable positive relationship between air temperature and water mineralization, as well as concentrations of basic ions. The most pronounced relationship was found for chlorides, magnesium, and calcium. This indicates that an increase in air temperature enhances evaporation processes, which leads to an increase in the concentration of dissolved salts in reservoirs.
The strong correlation between temperature and mineralization highlights the importance of climatic control over hydrochemical processes. Increased temperature leads to intensified evaporation, resulting in the concentration of dissolved salts.
The results obtained confirm that the hydrochemical regime of the salt lakes of Western Kazakhstan is formed mainly under the influence of climatic factors, primarily air temperature and evaporation rate. In the hot and arid climate of the region, reservoirs function as natural salt accumulation systems in which seasonal temperature changes have a significant effect on the concentration of dissolved substances.
The results confirm that the hydrochemical regime of salt lakes in Western Kazakhstan is primarily controlled by climatic conditions, particularly temperature and evaporation intensity.
Thus, the salt lakes of the studied region are characterized by an evaporative-concentration type of formation of the hydrochemical composition of water and belong to typical limnological systems of arid territories. The data obtained expand the understanding of hydrochemical processes in the saline reservoirs of the Caspian region and can be used for further monitoring of lake ecosystems, assessment of their natural resources, and forecasting changes in the hydrochemical regime under conditions of climatic variability.
In general, the results of the study confirm the important role of climatic and hydrological factors in the formation of the chemical composition of salt lakes in Western Kazakhstan and emphasize the need to continue comprehensive limnological observations for a deeper understanding of the transformation processes of lake ecosystems in the region.
Hydrochemical studies of the salt lakes of Atyrau and Mangystau regions of Western Kazakhstan in the period 2022-2025 revealed clear patterns of formation and dynamics of water mineralization in an arid climate. All the studied reservoirs, including Inder Lake, Inderbor quarry, Karabatan, Kishi Oymash, salt lake near Atyrau airport, Aktau coastal zone, and radon healing waters, are characterized by high mineralization with a predominance of Na⁺ and Cl⁻, which is typical for hypersalinated chloride-sulfate systems.
The study of salt lakes in Western Kazakhstan (2022–2025) revealed consistent patterns in hydrochemical composition and mineralization dynamics. All studied water bodies are characterized by high salinity and dominance of Na⁺ and Cl⁻ ions, typical of hypersaline systems.
Correlation analysis showed that the concentrations of the main cations (Mg2⁺, Ca2⁺, K⁺) and anions (Cl⁻, SO₄2⁻) are strongly correlated, reflecting the combined effect of evaporative concentration processes, leaching of carbonate-dolomite rocks, and precipitation of secondary minerals. A particularly strong positive correlation between Na⁺ and Cl⁻ (r ≈ 0.92–0.96) confirms the key role of evaporation in the formation of the hydrochemical composition of lakes.
A strong correlation between major ions confirms the combined influence of evaporation, rock weathering, and mineral precipitation.
Summer air temperatures are an important factor determining the interannual variability of mineralization and ion concentration. An increase in temperature increases evaporation, which leads to an increase in the content of dissolved substances (TDS) and the accumulation of basic ions, especially Mg2⁺, Ca2⁺, and Cl⁻. Small, enclosed, and quarry reservoirs are the most sensitive to temperature changes, while large lakes and coastal zones exhibit more homogeneous hydrochemical conditions. Radon therapeutic waters have a weak or negative correlation with temperature, which is associated with the peculiarities of hydrogeochemical conditions and bottom sediment hydraulics.
Air temperature is a key factor controlling hydrochemical variability. Increased temperatures enhance evaporation, leading to higher ion concentrations and TDS values.
Thus, the formation of the hydrochemical composition of the studied salt lakes is determined by a combination of three main processes: evaporative concentration, leaching of carbonate-dolomite rocks, and precipitation of secondary minerals. Despite differences in lake size and origin, all systems follow a similar evaporative-concentration model typical for arid environments. The results obtained make it possible to better understand the seasonal and interannual dynamics of mineralization and can be used to predict changes in the hydrochemical regime of lakes under conditions of climatic variability. The results provide a basis for predicting future changes in hydrochemical regimes under climate variability and highlight the importance of continued monitoring.
[1] Dunn, D., Crookston, B.M., Phillips, C., Dutta, S., Neilson, B. (2025). Seasonal water and salt cycling in the Great Salt Lake after opening the new causeway breach. Journal of Hydrology: Regional Studies, 59: 102332. https://doi.org/10.1016/j.ejrh.2025.102332
[2] Dordoni, M., Zappalà, P., Barth, J.A.C. (2023). A preliminary global hydrochemical comparison of lakes and reservoirs. Frontiers in Water, 5. https://doi.org/10.3389/frwa.2023.1084050
[3] Zhiyenkulova, L., Yessenamanova, M., Jexenov, M., Koroleva, E.G., Nurbayeva, F. (2024). Ecological and limnological research of the sustainability of the ecosystem of the lake Inder. News of the National Academy of Sciences of the Republic of Kazakhstan, Series of Geology and Technical Sciences, 1(463):111-127.
[4] Zhiyenkulova, L., Yessenamanova, M., Nurbayeva, F., Yessenamanova, Z., Tlepbergenova, A., Saparova, G., Koroleva, E.G. (2024). Hydrochemical analysis of salt lakes in the Caspian Lowland of the Mangistau Region of the Republic of Kazakhstan. International Journal of Design and Nature and Ecodynamics, 19(5): 1815-1825. https://doi.org/10.18280/ijdne.190537
[5] Liu, F., Wang, G., Liao, F., Shi, Z., Cravotta, C., Zhou, P., Liang, X. (2025). Origin of Water and hydrochemical components of lakes: Example from the Mu Us Desert, Northwest China. Water Resources Research, 61(2). https://doi.org/10.1029/2024WR038856
[6] Jia, B., Si, J., Xi, H., Qin, J. (2021). A characterization of the hydrochemistry and main controlling factors of lakes in the Badain Jaran Desert, China. Water, 13(20): 2931. https://doi.org/10.3390/w13202931
[7] Merck, M.F., Tarboton, D.G. (2023). The salinity of the Great Salt Lake and its deep brine layer. Water, 15(8): 1488. https://doi.org/10.3390/w15081488
[8] Last, W.M. (2002). Geolimnology of salt lakes. Geosciences Journal, 6(4): 347-369. https://doi.org/10.1007/BF03020619
[9] Koutsoukos, P.G., Kontoyannis, C.G. (1984). Precipitation of calcium carbonate in aqueous solutions. Journal of the Chemical Society Faraday Transactions 1 Physical Chemistry in Condensed Phases, 80(5): 1181-1192. https://doi.org/10.1039/F19848001181
[10] Belovsky, G.E., Stephens, D., Perschon, C., Birdsey, P., et al. (2011). The Great Salt Lake Ecosystem (Utah, USA): Long term data and a structural equation approach: Reply. Ecosphere, 2(3). https://doi.org/10.1890/ES10-00091.1
[11] Kanbetov, A.S., Muldakhmetov, M.Z., Kulbatyrov, D.K., Duisekenova, R.G., Dyussengaliyeva, G.S., Zhaksiyeva, G.R. (2023). Soil condition studies in the area of the Tengiz deposit. News of the National Academy of Sciences of the Republic of Kazakhstan, Series of Geology and Technical Sciences, 5 (461): 145-155. https://doi.org/10.32014/2023.2518-170X.338
[12] Dunn, D., Crookston, B., Dutta, S., Neilson, B. (2025). Modeling Great Salt Lake water levels and salinities to capture current adaptive management actions. Journal of Hydrology: Regional Studies, 62: 102768. https://doi.org/10.1016/j.ejrh.2025.102768
[13] Shi, Z., Tan, H., Xue, F., Li, Y., Zhang, X., Cong, P., Santosh, M., Zhang, Y. (2024). Hydrochemical evolution and source mechanisms governing the unusual lithium and boron enrichment in salt lakes of northern Tibet. GSA Bulletin, 136 (11-12): 5174-5190. https://doi.org/10.1130/B37516.1
[14] VijayaVenkataRaman, S., Iniyan, S., Goic, R. (2023). A review of climate change, mitigation and adaptation. Renewable and Sustainable Energy Reviews, 166(1): 878-897. https://doi.org/10.1016/j.rser.2011.09.009
[15] Beames, P., Januchowski-Hartley, S.R. (2021). Understanding differences between lakes and reservoirs. Frontiers for Young Minds, 8: 513858. https://doi.org/10.3389/frym.2020.513858
[16] Bunce, L., Lowenstein, T., Jagniecki, E. (2022). Spring, River, and Lake Water Analyses from the Great Salt Lake Basin, Northern Utah. Utah Geological Survey. https://doi.org/10.34191/ofr-745
[17] Shokri, N., Hassani, A., Sahimi, M. (2024). Multi-scale soil salinization dynamics from global to pore scale: A review. Reviews of Geophysics, 62(4): e2023RG000804. https://doi.org/10.1029/2023RG000804
[18] Kenzhegaliev, A., Diarov, M., Kulbatyrov, D.K., Zakonov, A.N., Zhaliev, A.O. (2018). Chemical composition of the water of the springs of the Inder salt lake. Bulletin of Eurasian Science, 1(10).
[19] Tauova, N., Yessenamanova, M.S., Kozhakhmet, K., Kushakov, A.R., Kaliyeva, A. (2022). Geological state of the stratigraphic complex of the Tengiz deposit. News of the National Academy of Sciences of the Republic of Kazakhstan, Series of Geology and Technical Sciences, 5: 249-265. https://doi.org/10.32014/2518-170X.230
[20] Shulembayeva, K., Rodrigo-Ilarri, J., Rodrigo-Clavero, M.E., Khussainov, A., Kakabayev, A., Khussainova, R. (2023). Assessment of the hydrophysical and hydrochemical characteristics of Lake Burabay (Akmola Region, North Kazakhstan). Sustainability, 15(15): 11788. https://doi.org/10.3390/su151511788
[21] Amanchayeva, K.R. (2014). Description and assessment of factors influencing on the innovation potential and the socio-economic development (for example, Mangistau region). Bulletin of the Kazakh National University. Economic Series, 2(102): 144-151.
[22] Xie, C., Antić, N., Nadal-Romero, E., Yan, L., Tosti, T., Djogo Mračević, S., Tu, X., Kašanin-Grubin, M. (2022). The influences of climatic and lithological factors on weathering of sediments in humid badland areas. Frontiers in Earth Science, 10: 900314. https://doi.org/10.3389/feart.2022.900314
[23] Akoglu, H. (2018). User's guide to correlation coefficients. Turkish Journal of Emergency Medicine, 18(3):91-93. https://doi.org/10.1016/j.tjem.2018.08.001
[24] Stevenazzi, S., Voudouris, K., Ducci, D. (2025). Combination of hydrochemical graphical methods and multivariate statistical analysis to delineate groundwater bodies. Journal of Environmental Management, 381: 125266. https://doi.org/10.1016/j.jenvman.2025.125266
[25] Gastescu, P. (2009). Limnology, lake basins, lake waters. Lakes, RESERVOIrs and Ponds, 3(1): 7-12. https://www.limnology.ro/Lakes/2009/200903101.pdf.
[26] Soranno, P.A., Cheruvelil, K.S., Webster, K.E., Bremigan, M.T., Wagner, T., Stow, C.A. (2010). Using landscape limnology to classify freshwater ecosystems for multi-ecosystem management and conservation. BioScience, 60(6): 440-454. https://doi.org/10.1525/bio.2010.60.6.8
[27] El-Manharawy, S., Hafez, A. (2003). A new chemical classification system of natural waters for desalination and other industrial uses. Desalination, 156(1-3): 163-180. https://doi.org/10.1016/S0011-9164(03)00339-4