Simon Kim Hui Law*![]() | Norazzlina M.Sa’don
| Norazzlina M.Sa’don![]() | Abdul Razak Abdul Karim
| Abdul Razak Abdul Karim![]()
© 2026 The authors. This article is published by IIETA and is licensed under the CC BY 4.0 license (http://creativecommons.org/licenses/by/4.0/).
OPEN ACCESS
Karst regions are considered geotechnically unpredictable terrain due to their complex subsurface conditions. The formation of cavities, sinkholes, and irregular rock morphology can become apparent without warning. Hence, traditional site investigation methods become unreliable for accurate subsurface characterization. This paper presents an integrated approach that can improve subsurface characterization and geohazard mitigation in the karst environment. Borehole-derived soil profiles and corresponding laboratory results were used to calibrate and validate the geophysical surveys, namely Electrical Resistivity Tomography (ERT), Multichannel Analysis of Surface Waves (MASW), and Seismic Refraction Tomography (SRT). The efficacy of each technique was compared against the borehole data. All techniques showed individual strengths and limitations. In this circumstance, ERT successfully delineated low resistivity anomalies (< 10 Ωm), which were subsequently confirmed by boreholes as saturated clay/slump zones associated with karst-related instability. Similarly, ERT also effectively identifies high resistivity zones (> 1000 Ωm), which is consistent with a near-surface cavity above the groundwater table. On the other hand, SRT managed to differentiate residual soil (0.4–1.6 km/s) from limestone bedrock (> 2.1 km/s). The SRT revealed a highly undulating rockhead, with varying bedrock depth reaching 10 m over a 15 m lateral distance along the surveyed profile. Conversely, MASW effectively identified low shear wave velocity zones (Vs < 150 m/s) that spatially correspond to ERT low resistivity saturated clay/slump zones, which provide complementary stiffness and thickness information. However, compared with ERT, MASW has a lower resolution to characterize cavity features. The main contribution of this study lies in the integration of application, involving ERT, SRT, and MASW, geophysics survey in characterizing karst features for the Bau limestone Formation, Bau, Sarawak, Malaysia. The combined results provide a more defensible, cross-validated subsurface model than conventional borehole-only exploration. It also demonstrated extreme heterogeneity where rockhead elevation and ground stiffness vary remarkably. Practically, the study proposes a more structured site investigation workflow for karst terrain, where geophysical profiling is used to delineate zones of potential instability and rockhead irregularity. Targeted borehole verification would then be carried out at selected locations of anomalies. This would reduce the likelihood of missing narrow karst features. This integrated geophysical characterization approach provides a better basis for foundation selection and pile design.
geophysical, karst, Electrical Resistivity Tomography, Seismic Refraction Tomography, Multichannel Analysis of Surface Waves, site investigation, geohazard, Bau limestone
Karst terrain refers to areas where rocks, including limestone, dolomite, and evaporites, have been dissolved by water, forming sinkholes, caverns, underground streams, as well as irregular rock formations [1, 2]. For engineering practice, the key challenge is that karst features are spatially discontinuous and highly variable, so subsurface conditions may change remarkably over short distances.
Karst-related hazards can occur as shallow sinkholes or as deeper cavities and pinnacled/irregular rockheads. For shallow sinkholes close to the ground surface, geosynthetic reinforcement and ground improvement may reduce surface deformation. Recent numerical studies [3-8] have been developed using centrifugation and full-scale experiments to investigate the soil arching phenomenon, stress redistribution, and geosynthetic deflection in karst cavities. These studies highlight cavity opening, cyclic loading, and time-dependent stiffness, providing essential load transfer mechanisms and stress distribution functions that directly support geophysical interpretation. However, for site investigation and foundation design, the primary uncertainty often lies in detecting deeper voids, slump zones, and abrupt rockhead depressions that may not be intersected by boreholes.
Undetected cavities occurring at depth can contribute to sudden failure and collapse of buildings or infrastructure, leading to significant economic loss and threats to life [1]. The common techniques used in site investigations, especially those involving boreholes at wide intervals, often neglect hidden cavities, thereby providing insufficient information on the subsurface conditions of the site. Drilling boreholes can be used to assess subsurface conditions at pile locations; however, the point-based nature of boreholes and the irregular distribution of karst features can limit detection reliability and affect overall interpretation. To enhance borehole-based detection, Liu et al. [9] developed a multifrequency acoustic wave (MFAW) system to detect cavities near boreholes; however, its applicability across sites with different geological conditions remains to be established. Despite such advances, karst detection methods still face limitations in providing design-relevant information on cavity size, depth, and overburden thickness [10, 11]. Therefore, continuous profiling methods that improve coverage between boreholes are needed.
Among surface geophysical techniques, ground penetrating radar [12-14], Multichannel Analysis of Surface Waves (MASW) [15, 16], Electrical Resistivity Tomography (ERT) [17, 18], and Seismic Refraction Tomography (SRT) are widely applied because they provide complementary information relevant to karst engineering.
ERT is sensitive to contrasts in electrical resistivity and is therefore effective for identifying zones associated with voids, clay/water-filled features, and saturated weak zones. However, interpretation may be subjective because resistivity is highly influenced by moisture content, pore water pressure, and clay content.
SRT provides P-wave velocity structure and is commonly used to delineate the bedrock interface and rockhead undulations. Its limitation is in its reduced sensitivity for small cavities within the overburden soil.
MASW provides shear-wave velocity (Vs) profiles that reflect small strain stiffness and layer thickness, offering a useful indication of soft/loose zones. However, its resolution decreases with depth, and it is less effective in resolving cavity geometry compared to resistivity imaging.
Prior studies have demonstrated the value of individual methods but also highlighted their limitations when used in isolation. Tan et al. [19] noted that the common techniques improve detection. However, they still require numerous boreholes, which can be expensive and impractical for large-scale projects. Sonar is only effective for bored piles. Therefore, integrated geophysical characterization methods combined with targeted boreholes provide a more efficient and economical solution to accurately characterize underground features in highly heterogeneous karst environments.
Meanwhile, there are also discrepancies in the literature that highlight a lack of consensus among researchers on the effectiveness of different geophysics techniques. Tan [20] observed that geophysical investigations were unable to identify cavities in limestone terrain because of the thick overlying soil. On the other hand, Gue [21] supported the use of geophysics surveys in large-scale development projects, claiming that they are both cost and time-effective. However, the lack of localized information and widely spaced boreholes in conventional exploration has prevented comprehensive karst feature characterization. Byer et al. [22], on the other hand, proved that when combining geophysical techniques with exploratory borehole data, the subsurface profile can be greatly enhanced. Geophysics methods, such as ERT, SRT, and MASW, can effectively supplement conventional drilling by profiling the subsurface characteristics and capturing the stiffness variability in the ground. Alemdağ et al. [23] applied five geophysical techniques, namely, the ERT, MASW, SRT, Self-Potential (SP), and Ground Penetrating Radar (GPR). They concluded that ERT was the most effective method of all, and it can provide accurate characterization of the depth and the shape of karst features. Doll et al. [24] stated that SRT cannot resolve depths in excess of about 6 m because it fails to register the concomitant decrease in velocity with depth. In contrast, SRT was claimed by Azwin et al. [25] to possess no limitations in the ability to ascertain the depth to bedrock. Collectively, these studies suggest that the performance of ERT, SRT, and MASW is site dependent and that combined techniques provide a more reliable basis for engineering design than any single dataset.
From a local design perspective, the Malaysian standards, the JKR Handbook [26], and the DID Manual [27] do not incorporate any geophysical methods within their design guideline and remain restricted to borehole sampling. On the global scale, only Geoguide from Hong Kong provides a summary of geophysical methods and a vague explanation of their use.
This study combined geophysical methods, including ERT, MASW, and SRT, with borehole and laboratory data to enhance geohazard evaluation for construction and urban development in the karst region of Bau, Kuching, Sarawak, Malaysia. The main aim of this study is to identify and characterize subsurface conditions in karst terrains, thereby minimizing the risk of collapse to the overlying infrastructure and buildings. Specifically, the study evaluates the capability of each method (ERT, SRT, and MASW) against the borehole profiling method and demonstrates how their combined application improves subsurface characterization in the Bau limestone Formation. This study is the first subsurface characterization in the Bau area using a combination of geotechnical and geophysical methods in a subtropical karst environment. It fills the gap in efficient site characterization processes for karstic regions and serves as a helpful practical approach for similar regions worldwide.
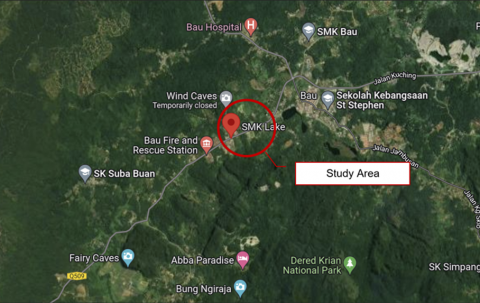
The study area is located in the Bau region, about 30 km southwest of Kuching, Sarawak, Malaysia. Figure 1 shows the location of the study area on Google Maps. This area is renowned for its vast karst formations, which have developed over long geological periods through the dissolution of underlying limestone rocks. Close by are the limestone caverns called Wind Cave and Fairy Cave. Because of the distinctive geological configuration of the karst topography, the region is popular for geotourism.
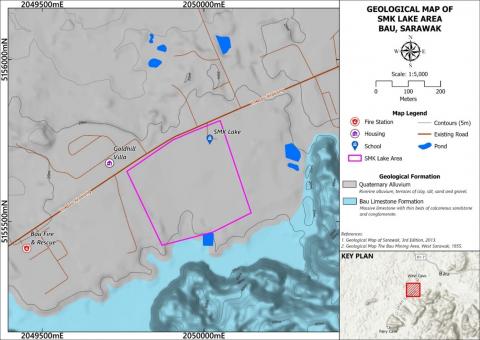
The geological map of Sarawak, presented in Figure 2, shows that the Bau limestone Formation, which is Late Jurassic to Late Cretaceous in age, forms the bedrock of the study area. It consists of thick limestone interbedded with thin calcareous sandstone and conglomerate. Many faults, fractures, and joints in the limestones caused the appearance of karstic features. These structures provide conduits for groundwater flow, increasing the dissolution of limestone and the development of an intricate pattern of underground cavities, sinkholes, and subsurface drainage beneath the site.
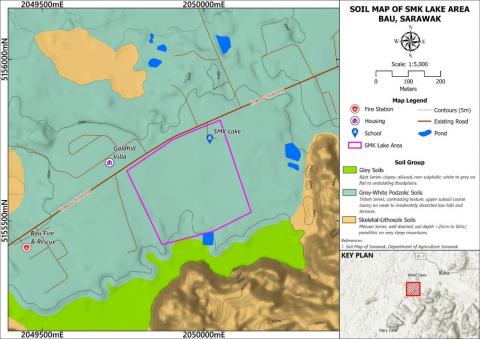
Based on the soil map of the study area in Figure 3, there are two major types of overburden soil overlaying the limestone formation: the skeletal soil and the brown forest soil. The skeletal soil consists of very sandy to clayey soils that were derived principally from the nearby hillsides. The brown forest soil is composed of bare limestone, thin humus pockets overlying the bare rock, and it is confined only to the karst topography. It is also interesting to note that there is a river nearby, Sg. Sarawak Kanan (Sarawak Kanan River), which might not be immediately apparent from the geological and soil maps. The study area is covered by a thick layer of alluvial deposit, which is usually very soft and highly compressible.
Figure 1. Location of study area
Figure 2. Geological map of the study area
Source: Geological Survey Department Malaysia
Figure 3. Soil map of the study area
Source: Soil Map of the Bau region
The study area is also close to a gold mine, which was active until the late twentieth century. The mining activities also contributed to the creation of karst landforms to some extent. The location is also close to the equator. Hence, it experiences a tropical rainforest climate with heavy rainfall throughout the entire year, accompanied by warm temperatures that accelerate the limestone weathering and karst formation due to extensive water infiltration. The region has transitioned from being agriculturally oriented to being utilized for both domestic and commercial activities due to population growth. The study area is vulnerable to subsidence, making it of particular interest because the site was previously occupied by old government quarters and has since been cleared for new construction.
3.1 Integrated site characterization
In this study, three geophysical survey methods were used, namely, ERT, SRT, and MASW. In addition to the geophysical survey methods, direct geotechnical sampling by means of borehole sampling and laboratory index testing was also deployed to validate against the geophysical survey results.
3.2 Acquisition of geophysical data
SRT and MASW were acquired using a 24-channel OYO McSeis SX-XP seismograph. The receiver spread consisted of 24 geophones arranged at 2 m spacing, providing a total spread length of 46 m. To obtain continuous coverage along the profile line, a roll-along approach was adopted with a minimum overlap of 12 geophones between adjacent spreads. A seismic source was generated by hammer impact on a steel plate, and for MASW acquisition, shot points were applied at 2 m intervals between geophones. For SRT acquisition, remote shot positions were used where practical to improve depth penetration. Data was recorded at a sampling interval of 500 microseconds with 1024 samples per record (0.512 s record length) and a 256 samples per trigger. During acquisition, a low-cut filter of 5 Hz and a high-cut filter of 1000 Hz were applied.
Two two-dimensional ERT profiles were acquired along the same investigation corridor using a Wenner–Schlumberger array. A total of 20 electrodes were deployed with an electrode spacing of 2m and 3m, respectively. The profile sections presented in this study have interpreted lengths of 50 m (Line 1) and 80 m (Line 2), with interpreted depths of investigation of approximately 25 m and 40 m, respectively. Data acquisition used transmitter output voltages of 50 V, 100 V, 150 V, and 300 V. These voltages were selected to maintain stable current injection while ensuring adequate signal quality under different contact resistances. Interpretation in this study focuses on the upper subsurface, where data coverage and inversion sensitivity are the highest.
3.3 Data Processing and Signal Inversion
Seismic data were processed using PickWin95 and PlotRefa. First arrival travel times were picked in PickWin95 and then imported into PlotRefa for tomographic inversion using the Simultaneous Iterative Reconstruction Technique to generate two-dimensional P-wave velocity sections for SRT. For MASW, the recorded wavefield was analyzed to obtain surface wave dispersion characteristics. Dispersion curves were extracted and interpreted to derive shear wave velocity sections for assessing near-surface stiffness variation along the survey line. During data acquisition, the field layout and equipment arrangement are as illustrated in Figure 4.

Figure 4. Site conditions and geophysical survey setup during data acquisition
Electrical resistivity data were processed using the open-source software ResIPy. The inversion reconstructs subsurface resistivity distribution using a finite element modelling framework. The resistivity model was iteratively updated to reduce the root mean square misfit between measured apparent resistivity and modelled responses. The inverted resistivity sections were then prepared for interpretation together with borehole information.
The ERT inversion was started using a homogeneous half-space as the initial model. In ResIPy, this starting resistivity is taken from the average apparent resistivity of the measured dataset, which provides a neutral baseline without forcing any predefined subsurface geometry. The model was then updated iteratively by reducing the mismatch between the measured and calculated apparent resistivity, while applying smoothness constraints (Tikhonov regularisation) to avoid unrealistic sharp artefacts in the resistivity image.
The balance between data fit and model smoothness is controlled by the regularisation parameter (λ). In practice, λ is commonly set within about 0.1 to 1.0, with values around 0.5 to 1.0 often providing a reasonable compromise for typical field datasets. Iterations were continued until the misfit reduction became small and the solution stabilised, which is usually achieved within about 5 to 8 iterations.
Inversion performance was evaluated using the root‑mean‑square (RMS) error between observed and modelled apparent resistivity at each iteration. Once the inversion converged and the RMS error fell within the range generally considered acceptable for engineering interpretation, the final resistivity sections were interpreted together with the available borehole information.
3.4 Geotechnical verification
Rotary wash boring boreholes were carried out at locations slightly offset from the geophysical profile lines to provide verification data. Four boreholes were used in this study, namely BH2 drilled to 20.50 m, BH3 drilled to 30.00 m, BH4 drilled to 32.00 m, and BH5 drilled to 19.00 m. Borehole offsets from the geophysical profile lines ranged from 13 m to 25 m. The site investigation works, including drilling, sampling, and in-situ testing, were conducted in accordance with BS 5930 (Code of practice for ground investigations).

Figure 5. Typical resistivity ranges for common rock and soil types
The authors redrawn based on published ranges in Palacky [28].
In the overburden soils, Standard Penetration Tests (SPT) and disturbed sampling were performed at regular depth intervals, generally at approximately 1.5 m spacing, prior to encountering limestone. Upon reaching limestone, continuous rock coring was carried out, and core recovery information (e.g., Total Core Recovery (TCR) and Rock Quality Designation (RQD) where applicable) was logged to support assessment of rock mass condition, weathering profile, and potential karst-related features. Representative soil and rock samples recovered from the boreholes were submitted for laboratory testing.
Laboratory tests were undertaken to characterize soil index properties, strength, compressibility, and selected chemical parameters. Soil index and classification testing followed BS 1377:1990 (Methods of test for soils for civil engineering purposes), including moisture content (Part 2: 1990: 3), particle density / specific gravity (Part 2: 1990: 8.3), bulk and dry density (Part 2: 1990: 7.2), Atterberg limits (Part 2: 1990: 4.5 & 5.3), and particle size distribution (Part 2: 1990: 9). Where required, Unconsolidated Undrained (UU) triaxial tests were conducted in accordance with BS 1377: Part 7: 1990: 8, and one-dimensional consolidation tests followed BS 1377: Part 5: 1990: 3. Chemical tests on soil and water samples were performed in accordance with BS 1377: Part 3: 1990, including pH value (Part 3: 1990: 9), total sulphate content (Part 3: 1990: 5.5), and organic matter content (Part 3: 1990: 3). For rock samples, uniaxial compressive strength (UCS) testing was performed in accordance with ASTM D7012-04.
Figure 5 illustrates typical resistivity ranges for common rock and soil types, and these values were used to guide the initial interpretation of conductive and resistive anomalies. The site‑specific correlation in this study was established by calibrating those published reference ranges with local borehole information, rather than deriving a new empirical formula. The interpretation was refined by comparing the geophysical responses at locations nearest to BH2, BH3, BH4, and BH5 with borehole‑confirmed material descriptions and rockhead depths. The calibrated criteria were applied consistently along the full profiles, and the level of agreement with borehole observations, including the influence of borehole offset, is reported in the Results section.
4.1 Electric
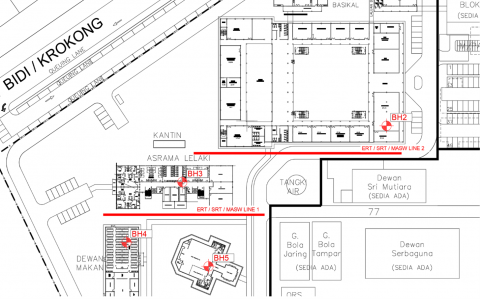
ERT mapped spatial resistivity contrasts along Line 1 and Line 2, shown in the site investigation plan in Figure 6. The inverted resistivity values range from 2.90 Ωm to 498.72 Ωm for Line 1 and 1.13 Ωm to 3986.12 Ωm for Line 2, as shown in Figures 7 and 8. The resistivity sections were interpreted with reference to published ranges and were cross-referenced with borehole observations.
Figure 6. Site investigation plan
For Line 1, the ERT section in Figure 7 shows two main low-resistivity zones below 10.50 Ωm. The first zone is located at an approximate distance of 4m to 12 m and is concentrated in the upper part of the section, roughly within elevation 0 m to -10 m. The second zone occurs at approximately distances of 26 m to 35 m, extending roughly from an elevation of 0 m to -15 m. These zones are consistent with saturated fine-grained soils or water-influenced weakened overburden, rather than open-air-filled voids.
Figure 7. ERT profile of Line 1
Figure 8. ERT profile of Line 2
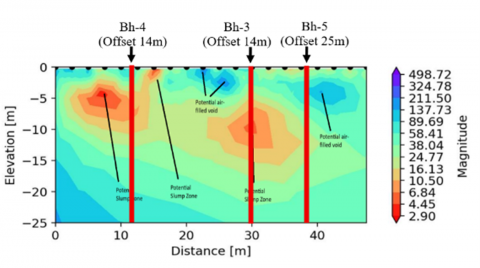
For Line 2, the ERT section in Figure 8 shows a wider resistivity range, including near-surface resistive zones exceeding 1000 Ωm, mainly within the upper portion of the section. Distinct resistive responses are visible near the ground surface at distances of 15 m to 30 m and around distances of 70 m to 80 m. In addition, a large mid-depth zone centered approximately around a distance of 45 m to 65 m is identified and interpreted in the figure as a potential sinkhole-related feature. Overall, the ERT sections indicate strong lateral and vertical variability along the corridor, consistent with heterogeneous karst-related ground conditions.
4.2 Seismic Refraction Tomography profiles
SRT delineated the interface between the softer overburden and the underlying limestone, as shown in Figure 9 for Line 1 and Figure 10 for Line 2. The P-wave velocity distribution separates residual soil at approximately 0.4 km/s to 1.6 km/s from the higher velocity limestone, generally above 2.1 km/s.

Figure 9. SRT and MASW profile of Line 1

Figure 10. SRT and MASW profile of Line 2
For Line 1, Figure 9 shows a highly irregular limestone surface. A clear example of strong relief is observed between approximately distances of 10 m and 25 m, where the limestone boundary dips by roughly about 10 m over a short lateral distance, indicating steep rockhead undulation that is of typical karst terrain.
For Line 2, Figure 10 shows an undulating rockhead surface, but the relief over short segments is less pronounced than Line 1. The SRT sections provide the main control on rockhead geometry, while smaller weak zones within the overburden are not consistently expressed.
4.3 MASW
The MASW shear wave velocity sections in Figures 9 and 10 provide stiffness distribution within the upper ground. Zones with Vs lower than 150 m/s occur mainly within the upper part of the section, consistent with softer near-surface overburden. The MASW sections show lateral stiffness variation that broadly aligns with the stratigraphic pattern interpreted from SRT, and they complement ERT by indicating where lower resistivity zones coincide with lower stiffness.
4.4 Geotechnical verification with borehole correlation
Boreholes BH2, BH3, BH4, and BH5 are shown relative to the survey lines in Figure 6, and their projected locations along the ERT and SRT sections are shown in Figures 7 to 10. Rotary wash boring boreholes were conducted with offsets of 13 m to 25 m from the profile lines. A quantitative comparison between geophysical predictions and borehole observations is summarized in Table 1.
Table 1. Summary of geophysical predictions and borehole verification results
|
Profile Line |
Borehole No. |
Targeted Features |
Geophysical Prediction |
Borehole Findings |
Interpretation of Variance |
|
Line 1 |
BH4 (Offset 14 m) |
Bedrock Interface |
SRT: 12 m |
9 m |
Variance due to heterogeneity: A 3 m change in rockhead depth over a 14 m offset confirms the steep rock gradient topography |
|
Karst Feature |
ERT: Slump Zone (4 m to 10 m) |
11 m to 12 m |
High Correlation: ERT correctly identified the zone of instability at an offset away from the cavity |
||
|
Line 1 |
BH3 (Offset 14 m) |
Bedrock Interface |
SRT: 9 m |
12 m |
Variation due to heterogeneity: Rockhead dips deeper at the borehole position vs the profiled line |
|
Karst Feature |
ERT: Slump Zone (6 m to 15 m) |
13 m to 20 m |
Direct Match: ERT anomaly successfully bracketed the size of the cavity, but the slump zone dips steeply towards the borehole position |
||
|
Line 1 |
BH5 (Offset 25 m) |
Karst Feature |
ERT: No slump zone |
No cavity |
True Negative: Confirms continuous competent ground at lateral distance > 25m |
|
Line 2 |
BH2 (Offset 13 m) |
Bedrock Interface |
SRT: 17 m |
18 m |
High accuracy: Approximately 1m deviation indicates a relatively flat and consistent bedrock |
|
Karst Feature |
ERT: No slump zone |
No cavity |
True Negative: Validates the absence of karst features. |
For the bedrock interface, SRT predictions show close agreement to borehole rockhead depths, with differences attributed primarily to heterogeneity of the ground and borehole offset. At BH4, SRT predicted rockhead at 12 m while the borehole encountered rockhead at 9 m, giving a 3 m difference over a 14 m offset. At BH3, SRT predicted rockhead at 9 m while the borehole encountered rockhead at 12 m, indicating rockhead deepens towards the borehole position. At BH2, SRT predicted 17 m while the borehole recorded 18 m, showing about 1 m difference.
For karst-related weakened overburden, ERT interpretations are supported by targeted borehole observations. At BH4, ERT indicated a weakened zone from 4 m to 10 m, while the borehole recorded a karst-related feature at 11 m to 12 m. At BH3, ERT indicated a weakened zone from 6 m to 15 m, while borehole evidence indicates the feature extends deeper at the borehole location, reported as 13 m to 20 m. BH5 and BH2 provide negative verification points where ERT indicated no weakened zone, and the boreholes recorded no cavity.
Overall, the borehole correlation confirms strong short-distance heterogeneity and shows that the main depth differences between geophysical predictions and borehole depths are consistent with offset distance and steep feature dip, rather than a contradiction of the geophysical interpretation.
5.1 Efficacy of integrated methods in karst detection
The results obtained from both the geophysics methods and exploratory borehole clearly demonstrated complementary strengths between ERT, SRT and MASW for characterizing karst-related ground conditions. From this study, the ERT has proven to be most effective in identifying potential slump zones and clay-infilled or water-influenced features within the overburden. As found from the ERT, the low-resistivity zones correlate well with the exploratory borehole, namely BH3 and BH4. This confirms the efficacy of ERT as a reliable tool for detecting subsurface karst features.
This outcome is consistent with multi-prong investigations that emphasize ERT as an effective technique for mapping karst-related disturbed zones where there is sufficient electrical contrast between infill material and surrounding ground. However, Tan [20] reported that geophysical investigations may fail to identify cavities in limestone terrain when thick overburden reduces detection clarity, suggesting that detectability depends strongly on the local overburden condition and infill type.
On the other hand, SRT, limited by its wavelength, was less effective at identifying small cavities, but excelled at delineating the interface between bedrock and soft overburden soil. This is in line with Doll et al. [24], who discussed depth and resolution limitations in refraction-based interpretation, although other studies, such as Azwin et al. [25], reported favorable performance for depth to bedrock mapping under appropriate conditions.
MASW provided supporting evidence on near-surface stiffness variation, and it was most useful when interpreted together with ERT and SRT rather than as a stand-alone cavity detection tool.
5.2 Lateral heterogeneity and borehole offset
One of the most crucial findings in the study is the quantitative differences between the exploratory borehole and the geophysics results. It is noteworthy that these differences are not errors but are attributed to the horizontal offset of the boreholes from the line of profile.
In non-karstic formations, the SRT bedrock prediction can often match the borehole within a very small tolerance, indicating consistent and levelled strata. However, in a highly karstic formation, the SRT predicted the bedrock at 12 m while the borehole encountered it at 9 m. This 3 m discrepancy over a lateral offset distance of 14 m corresponds to an average bedrock surface gradient of 3 m divided by 14 m, approximately 21.4% gradient. This gradient visually illustrates the steepness of the rockhead surface and highlights how rapidly rockhead elevation can change over a short distance.
This offset effect does not invalidate the SRT result, but quantitatively demonstrates that the subsurface profile in Bau limestone can shift dramatically over distances as short as 14 m.
From an engineering perspective, this steep gradient has the greatest impact on foundations that require reliable foundation level control. End bearing piles and socketed piles are most sensitive because small lateral shifts can lead to significant variation in required toe levels and socket lengths. Driven piles may experience unexpected early refusal or variable set due to abrupt rockhead changes, while shallow foundations may be more influenced by the thickness and stiffness of the overburden where weak zones exist.
5.3 Implications for site investigation standards
The demonstrated lateral heterogeneity demonstrated a serious efficacy problem in the current practice. As illustrated, relying upon boreholes only, even at closer spacings, still carries a high risk of missing narrow karst features, as illustrated in BH2 and BH5. Without the continuous profiling of the ERT and SRT, the connectivity and extent of these geohazards would be completely missed. Consequently, this study advocates for the integration of geophysical methods with the borehole method, especially for the characterization of karst features. This is crucial because geophysical methods are able to bridge the data gaps between physical sampling points.
This aligns with Byer et al. [22], who showed that combining geophysical techniques with borehole data enhances the subsurface model compared with drilling alone. It also supports the view of Gue [21] that geophysical surveys are cost and time-effective for larger developments, while addressing the concern raised by Tan [20] by emphasizing that geophysical results should be verified with targeted boreholes, particularly where overburden conditions reduce detectability.
In practice, the likelihood of missing karst features increases as borehole spacing increases, because boreholes provide point information, and narrow features may not be intersected. Continuous geophysical profiling reduces this risk by identifying zones of concern between boreholes, allowing verification boreholes to be positioned at key resistivity contrasts, inferred weak zones, and steep rockhead transitions.
While the integration of geophysical methods was successful in our study, we must still acknowledge the limitations of each individual geophysical method. These geophysics methods are meant to complement and supplement each other. A limitation encountered in our study was the reduced precision of the MASW method beyond approximately 10 m. This is likely due to signal attenuation in the heterogeneous material. Further investigation could potentially mitigate this limitation by carrying out cross-hole MASW. This also highlights that MASW is exceptional for shallower depth, and the SRT was more reliable at defining the depth of bedrock.
1. ERT is the most effective method in this study for identifying water-influenced weak zones and clay-infilled karst features within the overburden, providing clear lateral continuity of these zones along the profiles.
2. SRT provides the most reliable definition of rockhead geometry and highlights strong bedrock undulation typical of karst terrain, but it is less sensitive to localized weak zones in the overburden.
3. MASW complements ERT and SRT by providing stiffness distribution in the upper ground and supporting identification of weak overburden zones where low stiffness coincides with conductive resistivity responses, although it does not define cavity geometry as clearly as ERT.
4. Borehole verification confirms extreme lateral heterogeneity in the Bau limestone formation. A 3 m difference in rockhead depth over a 14 m offset corresponds to a bedrock surface gradient of approximately 21.4% gradient, demonstrating that ground conditions can change significantly over short distances.
5. The integrated use of geophysical profiling with targeted boreholes provides a more defensible basis for foundation design in karst terrain by reducing the likelihood of missing narrow hazards and improving rockhead control for pile founding decisions.
The authors gratefully acknowledge Universiti Malaysia Sarawak (UNIMAS) for the provision of facilities and resources that made this research possible. The authors also extend their sincere appreciation to the Pasukan Projek Khas 2, Jabatan Kerja Raya Malaysia, for facilitating access to the project site and for providing the essential technical information that supported the completion of this study.
|
ERT |
Electrical Resistivity Tomography |
|
SRT |
Seismic Refraction Tomography |
|
MASWk |
Multichannel Analysis of Surface Waves |
|
GPR |
Ground Penetrating Radar |
|
SP |
Self-Potential |
|
MFAW |
Multifrequency acoustic wave |
|
UCS |
Uniaxial Compressive Strength |
|
RMS |
Root mean square |
|
JKR |
Jabatan Kerja Raya Malaysia |
|
DID |
Department of Irrigation and Drainage Malaysia |
|
SIRT |
Simultaneous Iterative Reconstruction Technique |
|
Vs |
Shear wave velocity, m/s |
|
P-wave |
Compressional wave velocity, km/s |
[1] Yassin, R.R., Haji, S., Muhammad, R.F. (2020). Mitigation the geohazard of carbonate Karst features in construction sites by applying of combined techniques in (Kinta Valley) Perak-Peninsular Malaysia. International Journal of Engineering Research & Technology, 9(4). https://doi.org/10.17577/IJERTV9IS040075
[2] Waltham, A.C., Fookes, P.G. (2003). Engineering classification of karst ground conditions. Quarterly Journal of Engineering Geology and Hydrogeology, 36(2): 101-118. https://doi.org/10.1144/1470-9236/2002-33
[3] Pham, M.T., Vo, D.N., Nguyen, D.T., Do, N.A. (2023). Numerical analysis of load transfer mechanisms within embankment reinforced by geosynthetic above cavity. Transportation Infrastructure Geotechnology, 10: 311-328. https://doi.org/10.1007/s40515-021-00220-4
[4] Pham, M.T., Nguyen, D.D., Nguyen, T.D., Nguyen, T.D., Pham, V.H. (2024). Numerical investigation of load transfer in geosynthetic-reinforced embankments over cavities: Effects of opening process and cyclic loading. Geotechnical and Geological Engineering, 42: 7287-7306. https://doi.org/10.1007/s10706-024-02927-w
[5] Pham, M.T., Nguyen, M.L., Dias, D. (2024). Numerical study of geosynthetic-reinforced soils above voids – validation on centrifuge tests. International Journal of Geotechnical Engineering, 18(2): 119-132. https://doi.org/10.1080/19386362.2024.2353446
[6] Pham, M.T., Vu, Q.G., Nguyen, T.C.B., Dias, D. (2024). Numerical analysis of soil arching development in geosynthetic-reinforced embankments over extended cavities. Geotechnical and Geological Engineering, 42: 7407-7432. https://doi.org/10.1007/s10706-024-02933-y
[7] Villard, P., Huckert, A., Briançon, L. (2016). Load transfer mechanisms in geotextile-reinforced embankments overlying voids: Numerical approach and design. Geotextiles and Geomembranes, 44(3): 381-395. https://doi.org/10.1016/j.geotexmem.2016.01.007
[8] Naftchali, F.M., Bathurst, R.J. (2024). Numerical modelling of reinforced fill over a void considering rate-dependent stiffness of the reinforcement. Geotextiles and Geomembranes, 52(4): 635-653. https://doi.org/10.1016/j.geotexmem.2024.03.006
[9] Liu, L., Shi, Z.-M., Peng, M., Tsoflias, G.P., Liu, C.C., Tao, F.J., Liu, C.S. (2020). A borehole multifrequency acoustic wave system for karst detection near piles. Journal of Applied Geophysics, 177: 104051. https://doi.org/10.1016/j.jappgeo.2020.104051
[10] Laskow, M., Gendler, M., Goldberg, I., Gvirtzman, H., Frumkin, A. (2011). Deep confined karst detection, analysis and paleo-hydrology reconstruction at a basin-wide scale using new geophysical interpretation of borehole logs. Journal of Hydrology, 406(3-4): 158-169. https://doi.org/10.1016/j.jhydrol.2011.06.011
[11] Duan, C., Yan, C., Xu, B., Zhou,Y. (2017). Crosshole seismic CT data field experiments and interpretation for karst caves in deep foundations. Engineering Geology, 228: 180-196. https://doi.org/10.1016/j.enggeo.2017.08.009
[12] Zajc, M., Celarc, B., Gosar, A. (2015). Structural-geological and karst feature investigations of the limestone–flysch thrust-fault contact using low-frequency ground penetrating radar (Adria–Dinarides thrust zone, SW Slovenia). Environmental Earth Sciences, 73(12): 8237-8249. https://doi.org/10.1007/s12665-014-3987-x
[13] Angelis, D., Tsourlos, P., Tsokas, G., Vargemezis, G., Zacharopoulou, G., Power, C. (2018). Combined application of GPR and ERT for the assessment of a wall structure at the Heptapyrgion fortress (Thessaloniki, Greece). Journal of Applied Geophysics, 152: 208-220. https://doi.org/10.1016/j.jappgeo.2018.04.003
[14] Kilic, G., Eren, L. (2018). Neural network-based inspection of voids and karst conduits in hydro-electric power station tunnels using GPR. Journal of Applied Geophysics, 151: 194-204. https://doi.org/10.1016/j.jappgeo.2018.02.026
[15] Xia, J. (2014). Estimation of near-surface shear-wave velocities and quality factors using multichannel analysis of surface-wave methods. Journal of Applied Geophysics, 103: 140-151. https://doi.org/10.1016/j.jappgeo.2014.01.016
[16] Hu, Y., Xia, J., Mi, B., Cheng, F., Shen, C. (2018). A pitfall of muting and removing bad traces in surface-wave analysis. Journal of Applied Geophysics, 153: 136-142. https://doi.org/10.1016/j.jappgeo.2018.04.013
[17] Martínez-Pagán, P., Gómez-Ortiz, D., Martín-Crespo, T., Manteca, J.I., Rosique, M. (2013). The electrical resistivity tomography method in the detection of shallow mining cavities: A case study on the Victoria Cave, Cartagena (SE Spain). Engineering Geology, 156: 1-10. https://doi.org/10.1016/j.enggeo.2013.01.013
[18] Liu, B., Liu, Z., Li, S., Fan, K., Nie, L., Zhang, X. (2017). An improved time-lapse resistivity tomography to monitor and estimate the impact on the groundwater system induced by tunnel excavation. Tunnelling and Underground Space Technology, 66: 107-120. https://doi.org/10.1016/j.tust.2017.04.008
[19] Tan, H., Huang, J., Qi, S. (2012). Application of cross-hole radar tomography in karst area. Environmental Earth Sciences, 66(1): 355-362. https://doi.org/10.1007/s12665-011-1244-0
[20] Tan, B.K. (1987). Some geotechnical aspects of urban development over limestone terrain in Malaysia. Bulletin of the International Association of Engineering Geology, 36: 57-63. https://doi.org/10.1007/BF02590477
[21] Gue, S.S. (1999). Foundations in limestone areas of Peninsular Malaysia. In Civil and Environmental Engineering Conference (C&EEC) New Frontiers & Challenges, Bangkok, Thailand. https://gnpgroup.com.my/wp-content/uploads/Publication/1999_02.pdf.
[22] Byer, G.B., Mundell, J.A., Vanderlaan, J.H.M. (2002). Geotechnical/geophysical evaluation of karst limestone sites - A case history. In 15th EEGS Symposium on the Application of Geophysics to Engineering and Environmental Problems. https://doi.org/10.3997/2214-4609-pdb.191.13CAV2
[23] Alemdağ, H., Köroğlu, F., Aydın, Z.Ö., Şeren, A., Babacan, A.E., Ersoy, A.F. (2024). Deciphering of karst geomorphology and sinkhole (doline) structures using multiple geophysical and geological methods (Trabzon, NE Türkiye). Bulletin of Engineering Geology and the Environment, 83: 286. https://doi.org/10.1007/s10064-024-03779-7
[24] Doll, W.E., Nyquist, J.E., Carpenter, P.J., Kaufmann, R.D., Carr, B.J. (1998). Geophysical surveys of a known karst feature, Oak Ridge Y-12 Plant, Oak Ridge, Tennessee (No. Y/TS-1736). Oak Ridge Y-12 Plant (Y-12), Oak Ridge, TN (United States). https://doi.org/10.2172/8046
[25] Azwin, I.N., Saad, R., Nordiana, M.M. (2013). Applying the seismic refraction tomography for site characterization. APCBEE Procedia, 5: 227-231. https://doi.org/10.1016/j.apcbee.2013.05.039
[26] Jabatan Kerja Raya Malaysia (JKR). (2016). JKR Geotechnical Engineering Handbook (JKR 21300-0077-16). Geotechnical Engineering Branch, Public Works Department Malaysia. https://www.scribd.com/document/790224081/Jkr-Handbook-Geotechnical.
[27] Department of Irrigation and Drainage Malaysia. (2009). DID Manual: Volume 6-Geotechnical Manual, Site Investigation and Engineering Survey.
[28] Palacky, G.J. (1988). Resistivity characteristics of geologic targets. In Electromagnetic Methods in Applied Geophysics. https://doi.org/10.1190/1.9781560802631.ch3