Sri Hartuti*![]() | Juanda
| Juanda![]() | Martunis
| Martunis![]()
© 2025 The authors. This article is published by IIETA and is licensed under the CC BY 4.0 license (http://creativecommons.org/licenses/by/4.0/).
OPEN ACCESS
Ground roasted coconut is a widely recognized traditional spice in Southeast Asia. Its quality is significantly affected by factors such as harvest maturity and post-harvest handling practices. However, systematic investigations into these variables remain limited. This study aimed to evaluate the effects of coconut maturity (9–13 months) and drying temperature (40–60℃) on the physicochemical properties of ground roasted coconut. A response surface methodology (RSM) employing a central composite design (CCD) was applied to develop a mathematical model describing the relationship between moisture content, free fatty acids (FFA), and fat content (FC) in relation to the treatment variables. The coefficients of determination (R²) were 0.927 for moisture content, 0.649 for FFA, and 0.50 for fat content. Coconut harvest maturity and drying temperature exerted a significant effect on moisture content, whereas FFA and fat content were not significantly influenced. Optimal processing conditions were identified at 10–11 months of harvest maturity and a drying temperature of 58–60℃, yielding ground roasted coconut with a moisture content of 0.8%, FFA content of 0.5%, and fat content of 64.47%. Under these optimised conditions, the colour parameters of ground roasted coconut were as follows: L* = 44.39, a* = 13.53, b* = 22.36, chroma = 26.13, and hue angle = 58.80. The resulting product also exhibited consistent colour, texture, and aroma characteristics comparable to those of commercially available ground roasted coconut, thereby confirming its suitability for market applications.
coconut, drying, maturity, physicochemical, roasted, response surface methodology, temperature
Coconuts play a vital role in the economies of tropical regions, offering a diverse range of applications [1, 2]. Across numerous countries, an array of processed coconut products is widely available, derived from both young and mature coconuts [3]. Products made from young coconut flesh include coconut syrup, coconut jam, ice cream, and coconut pudding. Meanwhile, mature coconuts are processed into grated coconut, coconut flour, ground roasted coconut, coconut chips, copra, and edible desiccated coconut. This category also encompasses fresh grated coconut, coconut milk, coconut oil, and various forms of coconut-based cakes [2-9].
Ground roasted coconut is a characteristic spice widely used across Southeast Asia, including in Indonesia. It is produced from grated coconut that is subsequently dried, roasted, and ground [10]. It delivers a savoury flavour, a distinctive aroma, a deep brown hue, and a subtle oiliness. To date, ground roasted coconut has been produced in a variety of quality grades. These variations arise from factors such as coconut variety, degree of maturity level, and differences in processing, particularly during the drying and roasting stages, suggesting that quality can be optimised at each step of production.
In recent years, ground roasted coconut has become increasingly popular as a versatile ingredient in cooking spices, chicken curry, duck curry, and beef rendang, valued for its distinctive aroma, mouthfeel, and nutrient profile. Despite this burgeoning interest, most research has concentrated on industrial-scale drying of coconut kernels, desiccated coconut, or grated coconut [6], leaving the specific processing pathways to optimise roasted coconut quality underexplored.
Maturity of the coconut at harvest fundamentally influences kernel composition and subsequent quality attributes. Young (water) coconuts, harvested at six to eight months, contain a translucent endosperm and high juice content, whereas fully mature nuts (eleven to thirteen months) develop firm white flesh with lower moisture and elevated lipid levels. Young coconuts contain relatively low levels of free fatty acids (FFA), accounting for less than 0.5% of total fat. In contrast, mature coconuts exhibit higher FFA concentrations (typically 1–2% or more), predominantly composed of lauric acid, followed by capric acid, caprylic acid, and minor amounts of myristic acid [11]. These physicochemical shifts, particularly in moisture, sugar, and oil fractions, affect roasting behaviour, colour development, and sensory characteristics of the ground product [3].
Drying temperature represents another critical parameter for both processing efficiency and product quality. Elevated temperatures expedite moisture removal and reduce processing time, but may provoke non-enzymatic browning, lipid oxidation, and loss of volatile flavour compounds. Studies on convective drying of grated coconut have demonstrated that temperatures between 50℃ and 60℃ strike a compromise between drying rate and colour retention, whereas temperatures exceeding 70℃ risk diminishing lightness and inducing off flavours [5]. However, the interplay between kernel maturity and drying temperature on the quality of ground roasted coconut remains to be systematically quantified.
Response surface methodology (RSM), notably the central composite design (CCD) [5, 12-14], provides a robust statistical framework to model multifactorial interactions and identify optimal processing conditions with a limited number of experiments. The application of CCD to varying maturity levels and drying temperatures enables the identification of both linear and non-linear influences on roasting yield, colour parameters, moisture content, and sensory attributes. This approach provides valuable insights for academic research and industrial practice alike, supporting the development of high-quality ground roasted coconut products. To date, no studies have employed experimental designs, such as the central composite design (CCD), to quantify the interaction between the ripeness level of harvested coconuts and drying temperature, nor to develop a mathematical model capable of predicting the optimal quality of ground roasted coconut. This study aims to identify the optimal physicochemical properties of ground roasted coconut by examining the influence of coconut maturity levels and drying temperatures, employing a CCD approach.
2.1 Research tools and materials
The equipment utilised in this study included a Maksindo-FDH6 food dehydrator, grinder, drying apparatus, analytical balance, drying oven, desiccant, protective gloves, cleaning cloths, tissues, face masks, camera, Erlenmeyer flasks, burettes, measuring pipettes, measuring cups, glass stirrers, water bath, upright cooler, colourimeter, Soxhlet extraction unit, condenser, and volumetric flasks. The primary raw material used was coconut sourced from Aceh Besar District, Aceh Province, Indonesia, a coastal region known for its agricultural produce. Additional reagents and materials included ethanol, sodium hydroxide (NaOH), phenolphthalein indicator, distilled water, and filter paper.
2.2 Research procedure
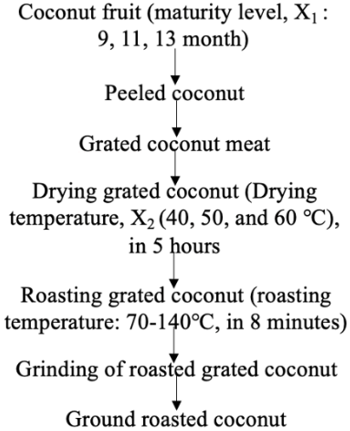
The methodology of this study was structured into several key stages: sample preparation, physicochemical analysis, and statistical evaluation using a central composite design. The process began with the preparation of grated coconut, followed by drying, roasting, and grinding, which resulted in the final ground roasted coconut product. The production of ground roasted coconut begins with the selection of coconuts at three distinct maturity stages: semi-ripe (harvested at 8–9 months), ripe (10–11 months), and overripe or mature coconuts (12–13 months). The selected coconuts are peeled, thoroughly cleaned, and grated to produce fresh coconut shreds. Each 500-gram sample is then dried using a food dehydrator at temperatures of 40℃, 50℃, and 60℃ for a duration of five hours. The roasting process was conducted in a pan heated by a stove. The initial roasting temperature was 70℃ and gradually increased, reaching 140℃ at the end of the process. The roasted samples were subsequently ground to obtain ground roasted coconut. A flow diagram of the production process is presented in Figure 1. Temperature changes during roasting were carefully controlled to avoid excessive heating, and the samples were continuously stirred to prevent damage or burning. The treated samples were then analysed for moisture content, fat content, free fatty acid content, and colour parameters, including chroma and hue.
Figure 1. Flowchart of the production process of ground roasted coconut
2.2.1 Moisture content
Moisture content (MC) analysis was conducted in accordance with AOAC guidelines, employing the oven-drying method [2, 12]. Initially, a porcelain cup was dried in an oven for approximately one hour. It was then transferred to a desiccator for 15 minutes and weighed once it had reached room temperature. Subsequently, 5 grams of the sample were placed into the cup, which was then dried in an oven at 102–105℃ for 5 to 6 hours. After drying, the cup was returned to the desiccator for 15 minutes to cool and then reweighed. This drying and weighing cycle was repeated until a constant weight was obtained. Moisture content was calculated using Eq. (1).
$\%$ Moisture Content $=\frac{C-A}{B-A} \times 100 \%$ (1)
where, A is the weight of the empty cup (g), B is the weight of the cup filled with the sample (g), and C is the weight of the cup with the dried sample (g).
2.2.2 Free fatty acid
Free fatty acid (FFA) content was determined in accordance with AOAC standards, using the titration method [13, 14]. A 5-gram sample was weighed and placed into a 150 ml Erlenmeyer flask containing 50 ml of alcohol. The mixture was stirred until homogeneous, then heated in a water bath at 60–65℃ until boiling. After cooling, 2 ml of phenolphthalein indicator was added, and the sample was titrated with 0.1 N sodium hydroxide (NaOH) until a persistent pale pink colour was observed. The volume of NaOH required to reach this endpoint was recorded. FFA content was calculated using Eq. (2).
$\%$ FFA Content $=\frac{V \times N \times M}{W}$ (2)
where, V is the volume of NaOH, N is the normality of standardized NaOH, M is the molecular weight of oleic acid (282.47 g/mol), and W is the sample mass.
2.2.3 Fat content
Fat content (FC) analysis was carried out using the Soxhlet extraction method [15]. The sample was first weighed, placed on filter paper, and inserted into a fat tube. This was then weighed and transferred into a fat flask connected to a Soxhlet apparatus. The fat tube was positioned within the extractor chamber and irrigated with a fat solvent. The extraction unit was assembled and heated at 40℃ for six hours. Following extraction, the fat solvent in the flask was distilled until fully evaporated. The distillate collected in the extractor chamber was removed to prevent it from re-entering the flask. The flask was then dried in an oven at 105℃ and cooled in a desiccator until a constant weight was achieved. Fat content was calculated using Eq. (3).
$\%$ Fat Content $=\frac{W_3-W_2}{W_1} \times 100 \%$ (3)
where, W₁ is the sample weight (g), W₂ is the weight of the empty fat flask (g), and W₃ is the weight of the fat flask + extracted fat (g).
2.2.4 Colour determination
The colour of each sample was measured using a portable colour meter (Linsang LS172). The measurement followed the CIELAB colour system, which includes L*, a*, b*, chroma, and hue parameters [5, 16-20]. The L*, a*, and b* values were calculated as follows: L* = (Lₛ – L₀) representing lightness, a* = (aₛ – a₀) indicating the red–green axis, and b* = (bₛ – b₀) indicating the yellow–blue axis [21, 22]. The colour measurements were performed in triplicate for each sample, and the mean values were subsequently calculated.
2.2.5 Data analysis
Data analysis was conducted using a two-factor CCD [22-28], enabling the assessment of interactions between coconut maturity level (X1) and drying temperature (X2). The objective was to identify optimal processing conditions that influence the physicochemical quality of the ground roasted coconut produced.
The limitations and variation levels of the treatment factors, along with their corresponding treatment codes, are presented in Table 1. A full central composite design (CCD) with two factors at the face‑centred point was selected to facilitate the determination of coconut ripeness level and drying temperature, adjusted to the food dehydrator employed as the drying apparatus. Accordingly, five experimental units were assigned to the centre points of the cube, four to the cube points, and four to the axial points. The treatment combinations are presented in Table 2.
Table 1. Levels of variation of treatment factors
|
Variable (X) |
Factor Levels |
||
|
Lower (−1) |
Middle (0) |
Upper (+1) |
|
|
Coconut maturity level, X1 (month) |
9 |
11 |
13 |
|
Drying temperature, X2 (℃) |
40 |
50 |
60 |
Optimal conditions for the treatment responses were determined using mathematical modelling, based on a standard second-order polynomial equation, as illustrated in Eq. (4) [23, 28].
$Y=\beta_0+\beta_1 X_1+\beta_2 X_2+\beta_{11} X_1^2+\beta_{22} X_2^2+\beta_{12} X_1 X_2$ (4)
where, Y is the value of the treatment response (moisture content, FFA, FC); βo is an intercept/constant; β1 and β2 are linear coefficients; β11and β22 are quadratic coefficients; β12 is a treatment interaction coefficient, namely the age of the coconut fruit (X1) and the drying temperature (X2).
Table 2. Combination of treatments
|
Std Order |
Run Order |
Variable X |
Response (Y₁, Y₂, Y₃) |
|
|
X₁ |
X₂ |
|||
|
5 |
1 |
9 (-1) |
50 (0) |
|
|
8 |
2 |
11(0) |
60 (+1) |
|
|
3 |
3 |
9 (-1) |
60 (+1) |
|
|
7 |
4 |
11 (0) |
40 (-1) |
|
|
10 |
5 |
11 (0) |
50 (0) |
|
|
9 |
6 |
11 (0) |
50 (0) |
|
|
1 |
7 |
9 (-1) |
40 (-1) |
|
|
11 |
8 |
11 (0) |
50 (0) |
|
|
2 |
9 |
13 (+1) |
40 (-1) |
|
|
6 |
10 |
13 (+1) |
50 (0) |
|
|
12 |
11 |
11 (0) |
50 (0) |
|
|
13 |
12 |
11 (0) |
50 (0) |
|
|
4 |
13 |
13 (+1) |
60 (+1) |
|
Roasted ground coconut is produced through several stages, namely grating, drying, roasting, and grinding [10]. It possesses distinctive characteristics, including a yellowish‑brown to dark brown colour, a savoury flavour, and a characteristic fragrant aroma [29]. The texture is smooth and slightly oily, resembling a paste or soft powder that readily blends into culinary preparations. Roasted ground coconut is widely employed as a spice [10, 30] in the preparation of beef, chicken, duck, fish, and other dishes within the Acehnese community, as well as in several other regions of Indonesia. The product, typically in paste form, exhibits a savoury taste, a pronounced roasted coconut aroma, and an appealing brown colour.
The research data (Table 3) indicate that coconut maturity and drying temperature in the food dehydrator exert differential effects on the physicochemical quality of the resulting ground roasted coconut, particularly with respect to changes in moisture content, FC, FFA content, and colour. The moisture content obtained in this study ranged from 0.545% to 3.545%. Almost all samples exhibited moisture levels below 3%; however, one sample recorded a value of 3.545% at a maturity level of nine months and a drying temperature of 40℃. This value slightly exceeds the quality requirement for dried grated coconut, namely 3% as specified in SNI 01‑3715‑2000 [31]. Generally, coconuts harvested at nine months exhibit higher moisture content than older coconuts (11–13 months), resulting in a longer evaporation process during drying [10].
Table 3. Response value of treatment based on the central composite design
|
Std Order |
Run Order |
Variable X |
Response (Y) |
|||
|
X₁ |
X₂ |
MC, % (Y₁) |
FFA, % (Y₂) |
FC, % (Y₃) |
||
|
5 |
1 |
9 |
50 |
1.734 |
0.070 |
65.10 |
|
8 |
2 |
11 |
60 |
0.648 |
0.042 |
64.47 |
|
3 |
3 |
9 |
60 |
2.134 |
0.077 |
69.74 |
|
7 |
4 |
11 |
40 |
1.664 |
0.032 |
66.99 |
|
10 |
5 |
11 |
50 |
1.138 |
0.061 |
61.41 |
|
9 |
6 |
11 |
50 |
0.871 |
0.028 |
66.61 |
|
1 |
7 |
9 |
40 |
3.545 |
0.026 |
66.45 |
|
11 |
8 |
11 |
50 |
1.111 |
0.045 |
64.21 |
|
2 |
9 |
13 |
40 |
0.659 |
0.046 |
68.33 |
|
6 |
10 |
13 |
50 |
0.632 |
0.039 |
61.38 |
|
12 |
11 |
11 |
50 |
0.848 |
0.051 |
65.14 |
|
13 |
12 |
11 |
50 |
0.961 |
0.057 |
66.01 |
|
4 |
13 |
13 |
60 |
0.545 |
0.048 |
67.80 |
FFA are among the key parameters used to assess the quality of ground roasted coconut. FFA levels are considered acceptable if they do not exceed the threshold specified by the Indonesian National Standard (SNI). As no specific SNI currently exists for roasted coconut, the reference value used in this study is based on the standard for dried coconut, which stipulates a maximum FFA content of < 0.14% (SNI 01-3715-2000) [31]. The FFA content observed in this study ranged from 0.026% to 0.077%, as presented in Table 3. All values were well below the maximum limit set by the applicable SNI, indicating that the ground roasted coconut samples met the safety and quality requirements.
The fat content of ground roasted coconut observed in this study ranged from 61.38% to 69.74%. The highest fat content (69.74%) was obtained from coconuts harvested at 9 months and dried at 60°C, while the lowest (61.38%) resulted from coconuts harvested at 13 months and dried at 50°C (Table 3). Previous studies have indicated that flour made from mature coconuts tends to have a higher fat content than that derived from medium-ripe or young coconuts, with average fat percentages of 50.625%, 54.0325%, and 58.3575%, respectively [32]. Other researchers [2] reported that the fat content of roasted coconut is lower than that of freshly grated coconut, with values of 39.83 ± 1.14% and 47.19 ± 1.28%. These findings contrast with the present study, which shows relatively consistent fat content across varying maturity levels and drying temperatures, as detailed in Table 3.
3.1 CCD analysis of moisture content, free fatty acids, and fat content of ground roasted coconut
The analysis of variance (ANOVA) results generated by the central composite design model for the characteristics of moisture content (Y₁), free fatty acids (Y₂), and fat content (Y₃) of ground roasted coconut are presented in Table 4. The model for moisture content yielded a significance value of p = 0.001 (p < 0.05), indicating that the model as a whole was significant and demonstrated good data variation for this parameter. The lack‑of‑fit test produced a p-value of 0.024 (< α = 0.05), suggesting a lack of fit, meaning that the data were not fully compatible with the model [21]. The coefficient of determination (R²) for the moisture content parameter was 0.9272, indicating that the treatment factors X₁ and X₂ accounted for 92.72% of the variation in the moisture content of ground roasted coconut.
Table 4. Results of analysis of central composite design models for the characteristics of ground roasted coconut
|
Response |
Regression Equation |
Significance (p < 0.05) |
Lack of Fit (p < 0.05) |
R² |
|
Moisture content (Y₁) |
Y₁ = 37.10 - 3.34X₁ - 0.568 X₂ + 0.0937 X₁*X₁ + 0.00347X₂*X₂ + 0.01621 X₁*X₂ (5) |
0.001 |
0.024 |
92.72% |
|
Free fatty acid (Y₂) |
Y₂ = - 0.249 - 0.0213 X₁ + 0.0163 X₂ + 0.002X₁*X₁ + 0.00008X₂*X₂ - 0.0006X₁*X₂ (6) |
0.123 |
0.616 |
64.92% |
|
Fat content (Y₃) |
Y₃ = 125.0 - 0.08 X₁ - 2.35 X₂ + 0.098 X₁*X₁ + 0.0288 X₂*X₂ - 0.0477 X₁*X₂ (7) |
0.33 |
0.33 |
50.02% |
Table 4 also indicates that the significance value of the model for free fatty acids (FFA) was 0.123 (p > 0.05), demonstrating that the model as a whole was not significant for FFA content in ground roasted coconut. The lack‑of‑fit test yielded a p-value of 0.616 (> α = 0.05), indicating no lack of fit and confirming that the data were consistent with the model. The coefficient of determination (R²) for the FFA parameter was 0.6492, suggesting that treatment factors X₁ and X₂ explained 64.92% of the variation in FFA content. In contrast, the significance value of the model for fat content was 0.33 (p > 0.05), indicating that the model was not significant and exhibited poor data variation for this parameter. The lack‑of‑fit test produced a p-value of 0.33 (> α = 0.05), again showing no lack of fit and confirming model consistency. The R² value for fat content was 0.5002, meaning that treatment factors X₁ and X₂ accounted for 50.02% of the variation in fat content of ground roasted coconut.
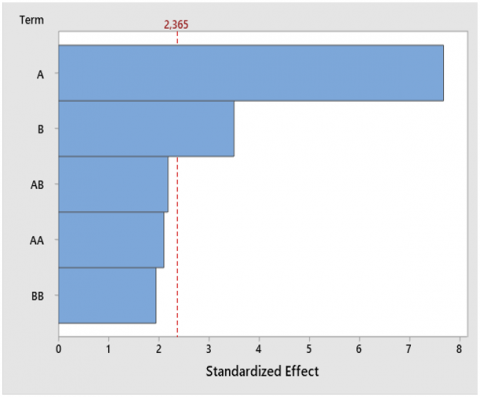
The Pareto diagram illustrates the absolute magnitude of the standardised effects, ranked from highest to lowest [23, 33, 34]. As shown in Figure 2(a), the coconut maturity level (X₁) exerted the greatest and most significant influence on the moisture content of ground roasted coconut. Drying temperature also had a significant, though comparatively smaller, effect. In contrast, the interaction term and the quadratic effect were not significant at the 95% confidence level.
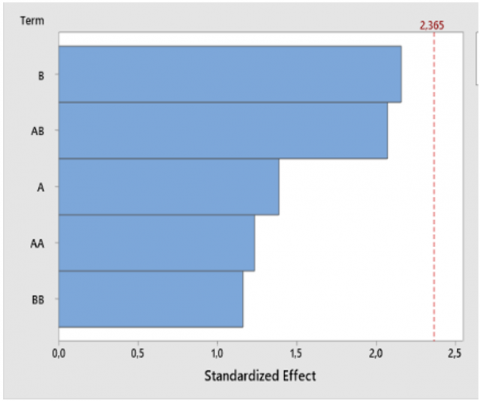
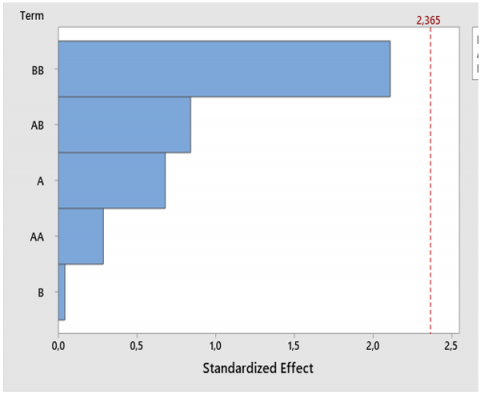
The Pareto diagram in Figure 2(b) illustrates that neither coconut maturity level (X₁), drying temperature (X₂), nor their interaction and quadratic effects had a statistically significant influence on FFA levels. The Pareto diagram in Figure 2(c) shows that neither coconut maturity level (X₁), drying temperature (X₂), nor their interaction and quadratic effects significantly influenced the fat content of ground roasted coconut at the 95% confidence level.
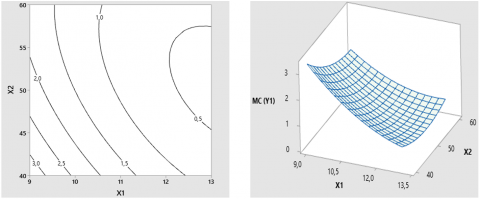
The contour and surface plots illustrating the influence of coconut maturity level (X₁) and drying temperature (X₂) on the moisture content of ground roasted coconut (Y₁) reveal that the highest moisture content observed was 3%, while the lowest was 0.5%, occurring along contour lines representing equivalent values, as shown in Figure 3. According to the Indonesian National Standard (SNI 01-3715-2000) [31], high-quality dried grated coconut should contain no more than 3% moisture. While the desiccated coconut standard CXS 177-1991 was adopted in 1991, revised in 2011, amended in 2022, this study indicates that to achieve a moisture content below 3%, drying must be conducted at temperatures between 45℃ and 60℃ across all levels of coconut maturity. Maintaining moisture content below this threshold is essential for prolonging shelf life and preserving the sensory attributes of the final ground roasted coconut product.
(a)
(b)
(c)
Figure 3. Contour plot and surface plot of MC of ground roasted coconut (Y1) at various levels of coconut maturity (X1) and drying temperature (X2)
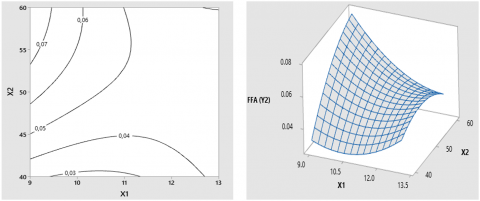
The contour and surface plots (Figure 4) show that the highest FFA content recorded was 0.077%, while the lowest was 0.026%, occurring along contour lines representing equivalent values for combinations of X₁ and X₂. According to quality standards, dried grated coconut should contain no more than 0.14% free fatty acids (FFA). The findings of this study revealed that the FFA content of ground roasted coconut was consistently below 0.08%, well within the acceptable threshold. Maintaining FFA levels below 0.14% is essential for extending shelf life and preserving the overall quality of the product. FFA levels serve as a key indicator of product stability and susceptibility to deterioration [14]. Elevated FFA concentrations are associated with rancidity, off-flavours, and discolouration in oils such as palm oil [14, 35], and are indicative of poor oil quality. All samples used in this study were processed without delay and were of good initial quality, resulting in consistently low FFA values (< 0.08%) that complied with the requirements of SNI 01-3715-2000.
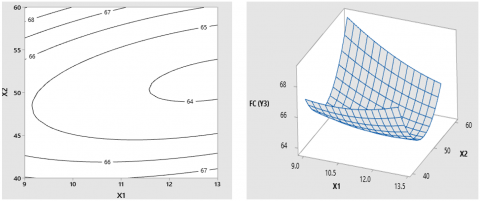
The contour and surface plots (Figure 5) illustrate that the highest fat content (69.74%) and the lowest (61.41%) were achieved through different combinations of X₁ and X₂. The circular or elliptical shape of the contour lines reflects the gradient of response changes, with tighter curvature near the centre indicating lower response values. Overall, the results suggest that coconut maturity and drying temperature do not exert a statistically significant effect on the fat content of ground roasted coconut.
The high fat content in roasted coconut products renders them susceptible to oxidation. Oxidative reactions readily occur during processing, storage, and utilisation of edible oils and fats, leading to undesirable changes such as rancidity, discolouration, off-odours, and altered viscosity [36, 37]. To minimise oxidation in lipid-rich foods, appropriate handling and storage practices are essential. These include maintaining suitable temperatures, protecting products from light exposure, ensuring low moisture content, and avoiding the presence of metal catalysts [37].
Figure 4. Contour plot and surface plot of FFA content of ground roasted coconut (Y2) at various levels of coconut maturity (X1) and drying temperature (X2)
Figure 5. Contour plot and surface plot of the FC of ground roasted coconut (Y3) at various levels of coconut maturity (X1) and drying temperature (X2)
3.2 Optimization of the maturity level of coconut fruit and the drying temperature of ground roasted coconut
Optimization is carried out following the development of a mathematical model for each response variable. In general, the objective of optimisation is to identify the treatment conditions that best align with the desired outcomes. This process aims to minimise operational effort and cost while maximising efficiency and product quality, particularly within industrial applications. The target optimisation criteria are presented in Table 5. As shown, the variables for coconut maturity level and drying temperature remain consistent with the previous experimental treatments, ranging from 9 to 13 months and 40 to 60℃, respectively. Both variables were assigned an importance level of 1, in accordance with the recommendations generated by the response surface methodology (RSM) application.
Table 5. Parameters for the optimization design of ground roasted coconut
|
Response |
Goal |
Lower |
Target |
Upper |
Weight |
Importance |
|
Free fatty acid (Y2) |
Target |
0.026103 |
0.05 |
0.11000 |
1 |
1 |
|
Moisture content (Y1) |
Minimum |
|
0.80 |
3.54488 |
1 |
1 |
Table 6. The formula generated in the optimization
|
Solution |
X1 |
X2 |
Free Fatty Acid (Y2) Fit |
Moisture Content (Y1) Fit |
Composite Desirability |
|
1 |
11.0729 |
58.3457 |
0.050000 |
0.80000 |
1.00000 |
The moisture content (Y1) and free fatty acid content (Y2) were both optimised with a minimisation objective. The upper thresholds were set at < 3.55% for moisture content and < 0.11% for FFA, reflecting their critical role in determining the quality of ground roasted coconut. Both parameters were assigned an importance level of 1, in line with their significance in product stability and compliance with quality standards. The optimisation process, guided by response surface methodology (RSM), produced the recommended formulation outlined in Table 6. The optimal conditions were achieved with coconuts harvested at 11 months and a drying temperature of approximately 58.34℃ (rounded to 60℃). Under these conditions, the resulting moisture content was 0.8%, and the FFA content was 0.05%, both well within the acceptable limits defined by relevant standards [31, 38].
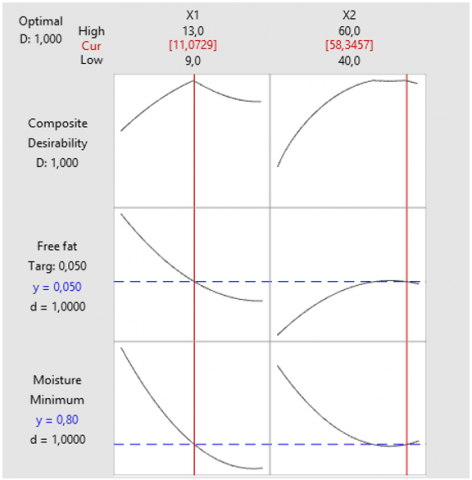
The CCD model predicted optimal processing conditions at a coconut maturity level of 11 months and a drying temperature of 58.34℃ (Figure 6). However, due to equipment limitations, the actual treatment was conducted at 11 months of maturity and a drying temperature of 60℃. Under these conditions, the model predicted a moisture content of 0.8% and a free fatty acid level of 0.05%, with a total desirability score of 1, indicating excellent optimization accuracy, as values closer to one reflect higher predictive reliability [39]. Validation of the treatment confirmed a moisture content of 0.65%, FFA of 0.04%, and fat content of 64.47%, all of which remained within acceptable quality standards and aligned closely with model predictions.
Figure 6. Optimum conditions for ground roasted coconut
3.3 Colour evaluation of ground roasted coconut
Colour is one of the most influential organoleptic attributes affecting consumer acceptance and food selection [40]. It also shapes consumer perception of flavour and quality [21, 41]. Colour analysis of ground roasted coconut samples yielded values for L, a, b, chroma (C*), and hue, as presented in Table 7. The data indicate that the interaction between coconut maturity level and drying temperature significantly influences the colour characteristics of the final product. The L* value represents brightness, ranging from 0 (black) to 100 (white) [7]. The a* value reflects the red-green axis, with positive values indicating red and negative values indicating green. The b* value corresponds to the yellow-blue axis, where positive values indicate yellow and negative values indicate blue. Chroma (C*) describes the intensity or vividness of the colour, how “pure”, “bright”, or “lively” it appears. High chroma values suggest vibrant colours, while low values indicate dull or faded tones. Hue defines the colour category within the spectrum and is one of the three principal attributes of colour, alongside chroma and value (lightness-darkness) [18].
Table 7. Description and visualization of the colour of ground roasted coconut
|
No. |
Variable X |
Colour Description |
||||||
|
X₁ |
X₂ |
L* |
a* |
b* |
Chroma |
Hue |
Visualisation |
|
|
1 |
9 |
50 |
23.71 |
8.93 |
17.18 |
19.36 |
62.50 |
|
|
2 |
11 |
60 |
44.39 |
13.53 |
22.36 |
26.13 |
58.80 |
|
|
3 |
9 |
60 |
14.81 |
7.52 |
14.17 |
16.04 |
62.00 |
|
|
4 |
11 |
40 |
30.07 |
8.86 |
20.44 |
22.27 |
66.50 |
|
|
5 |
11 |
50 |
40.27 |
8.12 |
18.22 |
19.94 |
65.90 |
|
|
6 |
11 |
50 |
42.25 |
9.72 |
17.89 |
20.36 |
61.40 |
|
|
7 |
9 |
40 |
35.09 |
6.93 |
19.21 |
17.42 |
69.60 |
|
|
8 |
11 |
50 |
54.09 |
8.46 |
26.37 |
27.69 |
72.10 |
|
|
9 |
13 |
40 |
41.65 |
10.03 |
23.39 |
25.44 |
66.69 |
|
|
10 |
13 |
50 |
30.88 |
12.45 |
21.48 |
24.82 |
59.90 |
|
|
11 |
11 |
50 |
63.23 |
9.33 |
29.78 |
31.20 |
72.60 |
|
|
12 |
11 |
50 |
29.23 |
9.05 |
18.30 |
20.41 |
63.60 |
|
|
13 |
13 |
60 |
20.89 |
9.36 |
13.55 |
16.45 |
55.30 |
|
Table 7 indicates that the highest L* value, representing the brightest sample (63.23), was observed in the 11th treatment, coconut maturity level of 11 months, and drying temperature of 50℃. In contrast, the lowest L* value (14.81), indicating the darkest sample, was recorded in the 3rd treatment, coconut maturity level of 9 months, and drying temperature of 60℃. The a* values ranged from 6.93 to 13.53, suggesting a colour tendency towards red, while the b* values ranged from 13.55 to 26.37, indicating a tendency towards yellow [17, 42]. Higher a* and b* values reflect a stronger red-yellow impression, which may manifest as orange, tangerine, or brown, depending on the corresponding L* and chroma values.
Chroma values ranged from 16.04 to 31.20, indicating medium to high colour intensity. This suggests that the colours produced were vivid and not overly dull or grey. Hue values ranged from 55.30 to 72.60, placing the samples within the yellow to yellowish-green spectrum. Overall, the 13 treatments produced similar colour profiles, predominantly brown with varying degrees of brightness, consistent with the typical appearance of ground roasted coconut found in the market [30].
The colour change of ground roasted coconut is influenced by reaction substrates such as sugars and proteins, which vary according to the maturity level, as well as by the rate of Maillard reactions and caramelisation, both of which are governed by drying temperature, roasting temperature, and water activity. The interplay of these factors produces a spectrum of colours ranging from bright golden to dark brown. Previous studies have reported that the colour change of coconut during drying and roasting is affected by both caramelisation and the Maillard reaction. Coconuts harvested at 6–8 months contain relatively high levels of simple sugars (glucose, fructose, sucrose), while protein and amino acid contents remain low. Upon roasting, these sugars undergo rapid caramelisation, yielding a brighter golden colour accompanied by a sweet aroma. In contrast, coconuts harvested at 11–13 months exhibit reduced free sugar content but increased protein and amino acids. This enhances the Maillard reaction, resulting in the formation of dark brown melanoidin pigments and a more complex roasted aroma [11, 43, 44].
The findings of this study demonstrate that coconut maturity and drying temperature significantly influence the moisture content of ground roasted coconut, with maturity exerting the most pronounced effect, followed by drying temperature. Conversely, neither factor showed a statistically significant impact on FFA levels or FC. Nonetheless, FFA concentrations across all treatments remained consistently below the threshold set by the Indonesian National Standard, thereby affirming the safety and stability of the final product. Optimisation analysis revealed that the most favourable processing conditions were achieved with coconuts at 11 months of maturity and a drying temperature of 58–60℃. Under these conditions, the ground roasted coconut exhibited low moisture and FFA levels, alongside appropriate fat content and desirable colour attributes. These results underscore the importance of selecting an optimal maturity stage and implementing precise post-harvest handling to ensure the production of high-quality ground roasted coconut. The limitations of this study are primarily associated with the relatively small sample size and the application of a fixed roasting time, which restricts the representativeness of the findings across a broader range of production conditions. Consequently, further research incorporating a comprehensive sensory evaluation is required to assess consumer acceptance.
The authors wish to express their deepest gratitude and appreciation to the Directorate of Research and Community Service, Directorate General of Research and Development, Ministry of Higher Education, Science, and Technology of Indonesia, for their support through the Fundamental Research Programme Implementation Contract - Regular, Fiscal Year 2025 (Contract No. 113/C3/DT.05.00/PL/2025). Sincere thanks are also extended to all individuals and institutions who contributed to the successful completion of this research project.
[1] Yahya, S., Mohd, S.A., Nur Hamizah, A.G., Mohd Zuhair, M.N. (2024). Comparative study of modelling, drying kinetics and specific energy consumption of desiccated coconut during convective and infrared drying. Food Research, 8(5): 184-200. https://doi.org/10.26656/fr.2017.8(5).495
[2] Amoo, I.A. (2004). Effect of roasting on the chemical composition of coconut (Cocos nucifera) seed flour and oil. Journal of Food, Agriculture and Environment, 2(3): 18-20.
[3] Paull, R.E., Ketsa, S. (2015). Coconut: Postharvest quality-maintenance guidelines. Fruit, Nut, and Beverage Crops. College of Tropical Agriculture and Human Resources (CTAHR), University of Hawai’i at Manoa, FN-45, 5. https://www.ctahr.hawaii.edu/oc/freepubs/pdf/F_N-45.pdf.
[4] Duranova, H., Kuzelova, L., Fialkova, V., Simora, V., et al. (2025). Coconut-sourced MCT oil: Its potential health benefits beyond traditional coconut oil. Phytochemistry Reviews, 24(1): 659-700. https://doi.org/10.1007/s11101-024-09969-1
[5] Yahya, S., Shahrir, A.M., Syariffudden, M.A.A.A., Shafie, A., Shukri, J.M., Zaimi, Z.A.A.M., Redzuan, S.A. (2020). A study of drying parameters on drying time and colour quality of grated coconut using tumbling mechanism in convective dryer. Food Research, 4(6): 64-69. https://doi.org/10.26656/fr.2017.4(S6).023
[6] Sahari, Y., Anuar, M.S., Nor, M.Z.M., Hamizah, N., Ghani, A., Tahir, S.M. (2023). Progress, trends and development of drying studies on coconut kernel products: A review. Pertanika Journal of Science and Technology, 31(5): 2621-2644. https://doi.org/10.47836/pjst.31.5.30
[7] Pestaño, L.D.B., Jose, W.I. (2016). Engineering an improved coconut processing system in the Philippines at the farm-level. Journal of Advanced Agricultural Technologies 3(1): 58-62. https://doi.org/10.18178/joaat.3.1.58-62
[8] Aisman, Hamzah, M.F., Hamzah, M.F., Azzahra, Y., Syukri, D. (2025). Transforming Coconut-Coir Waste (Cocos Nucifera. L) into tissue towels: Advancing Sustainable Development Goals towards circular economy practices. International Journal of Environmental Impacts, 8(3): 597-603. https://doi.org/10.18280/ijei.080317
[9] Oko, F.U.N. (2023). Efficient use of coconut and its by products. Eurasian Experiment Journal of Humanities and Social Sciences, 4(1): 14-16. https://www.eejournals.org/public/uploads/1688238191_6ad0fa5ae3c45e00a3a9.pdf.
[10] Hartuti, S., Maharani, Y. (2025). The effect of drying and roasting on the sensory quality of roasted coconut as a cooking spice. IOP Conference Series: Earth and Environmental Science, 1477(1): 012058. https://doi.org/10.1088/1755-1315/1477/1/012058
[11] Jiang, R., Xue, D., Chen, Y., Lv, X., Ni, L., Liu, Z. (2025). Comparative study of the fatty acid and phenolic profiles of tender and mature coconut for coconut milk production. Foods, 14(23): 4023. https://doi.org/10.3390/foods14234023
[12] AOAC International. (2000). Official methods of analysis of AOAC International (Vol. 17, No. 1-2). AOAC International.
[13] Purnaningtyas, S.R.D. (2022). Analysis of free fatty acid contents (As Acid Laurat) pure coconut oil (Virgin Coconut Oil/VCO) which circulates in Kediri City. Strada Journal of Pharmacy, 4(2): 82-84. https://doi.org/10.30994/sjp.v4i2.167
[14] Tan, B.A., Nair, A., Zakaria, M.I.S., Low, J.Y.S., et al. (2023). Free fatty acid formation points in palm oil processing and the impact on oil quality. Agriculture, 13(5): 957. https://doi.org/10.3390/agriculture13050957
[15] Pargiyanti, P. (2019). Optimization of fat extraction time with the Soxhlet method using a micro Soxhlet device. Indonesian Journal of Laboratory, 1(2): 29-35. https://doi.org/10.22146/ijl.v1i2.44745
[16] Cinko, U.O., Becerir, B. (2025). Computing characteristics of color difference formulas for regular coordinate changes in CIELAB color space. Textile Research Journal, 95(11-12): 1387-1408. https://doi.org/10.1177/00405175241278025
[17] Imawati, I.A.P.F., Sudarma, M., Putra, I.K.G.D., Bayupati, I.P.A. (2024). A study of lab color space and its visualization. In Proceedings of the International Conference on Applied Mathematics, Statistics, and Computing, pp. 17-28. https://doi.org/10.2991/978-94-6463-413-6_3
[18] Perdani, A.W., Setiowati, A.D., Purwono, B., Supriyadi, S. (2025). Color enhancement of rambutan peel anthocyanins extracts using co-pigmentation with gallic acid for pH-sensitives dye. Trends in Sciences, 22(4): 9518-9518. https://doi.org/10.48048/tis.2025.9518
[19] Gandhi, N. (2019). Food colours and their chemistry. Journal of Agricultural Engineering and Food Technology, 6(2): 129-132. http://www.krishisanskriti.org/Publication.html.
[20] Ly, B.C.K., Dyer, E.B., Feig, J.L., Chien, A.L., Del Bino, S. (2020). Research techniques made simple: Cutaneous colorimetry: A reliable technique for objective skin color measurement. Journal of Investigative Dermatology, 140(1): 3-12. https://doi.org/10.1016/j.jid.2019.11.003
[21] Hartuti, S., Bintoro, N., Karyadi, J.N.W., Pranotoᶟ, Y. (2020). Analysis of pH and color of fermented cocoa (Theobroma cacao L) beans using response surface methodology. Science & Technology, 28(2): 509-522.
[22] Hartuti, S., Bintoro, N., Karyadi, J.N.W., Pranoto, Y. (2019). Characteristics of dried cocoa beans (Theobroma cacao L.) color using response surface methodology. Planta Tropika, 7(1): 82-92. https://doi.org/10.18196/pt.2019.097.82-92
[23] Juanda, J., Hartuti, S. (2024). Sensory analysis of butterfly pea (Clitoria ternatea L.) flower tea drink using central composite design. International Journal of Design and Nature and Ecodynamics, 19(1): 41-47. https://doi.org/10.18280/ijdne.190105
[24] Kasina, M.M., Koske, J., Mutiso, J. (2020). Application of central composite design to optimize spawns propagation. Open Journal of Optimization, 9(3): 47-70. https://doi.org/10.4236/ojop.2020.93005
[25] Asadzadeh, F., Maleki-Kaklar, M., Soiltanalinejad, N., Shabani, F. (2018). Central composite design optimization of zinc removal from contaminated soil, using citric acid as biodegradable chelant. Scientific Reports, 8(1): 2633. https://doi.org/10.1038/s41598-018-20942-9
[26] Nainggolan, E.A., Banout, J., Urbanova, K. (2023). Application of central composite design and superimposition approach for optimization of drying parameters of pretreated cassava flour. Foods, 12(11): 2101. https://doi.org/10.3390/foods12112101
[27] Amarachinta, P.R., Sharma, G., Samed, N., Chettupalli, A.K., Alle, M., Kim, J.C. (2021). Central composite design for the development of carvedilol-loaded transdermal ethosomal hydrogel for extended and enhanced anti-hypertensive effect. Journal of Nanobiotechnology, 19(1): 100. https://doi.org/10.1186/s12951-021-00833-4
[28] Agustina, R., Hartuti, S. (2022). Optimization of sensory characteristics of bilimbi tea drink (Averrhoa Tea). IOP Conference Series: Earth and Environmental Science, 1116(1): 012066. https://doi.org/10.1088/1755-1315/1116/1/012066
[29] Saittagaroon, S., Kawakishi, S., Namiki, M. (1984). Aroma constituents of roasted coconut. Agricultural and Biological Chemistry, 48(9): 2301-2307. https://doi.org/10.1080/00021369.1984.10866491
[30] Hartuti, S., Juanda, J., Mustaqimah, M. (2025). The effect of drying and roasting times on sensory and physicochemical characteristics of ground roasted coconut. Journal of Agricultural Engineering, 14(5): 1798-1806. https://doi.org/10.23960/jtepl.v14i5.1798-1806
[31] Dried grated coconut. SNI 01-3715-2000. https://pesta.bsn.go.id/produk/detail/4111-sni01-3715-2000.
[32] Kumalasari, I.D., Santosa, I., Sulistiawati, E. (2020). Coconut oil production with various roasting temperatures and dried grated coconut as a by-product. IOP Conference Series: Earth and Environmental Science, 515(1): 012026. https://doi.org/10.1088/1755-1315/515/1/012026
[33] Hamzah, A.H., Akroot, A., Jaber, J.A. (2022). Analytical investigation of biodiesel mixed levels and operation factors’ effects on engine performance by RCM. International Journal of Design and Nature and Ecodynamics, 17(6): 863-873. https://doi.org/10.18280/ijdne.170606
[34] Mostefa, B., Kaddour, R., Mimoun, Y., Embarek, D., Amar, K. (2021). Optimization of the stability and reliability of rotor system by the methodology of design experiments. Mathematical Modelling of Engineering Problems, 8(2): 302-314. https://doi.org/10.18280/mmep.080219
[35] Maimun, T., Arahman, N., Hasibuan, F.A., Rahayu, P. (2017). Inhibition of the increase in free fatty acid level in palm oil fruit by using liquid smoke. Jurnal Teknologi dan Industri Pertanian Indonesia, 9(2): 44-49. https://doi.org/10.17969/jtipi.v9i2.8469
[36] Chaiyasit, W., Elias, R.J., McClements, D.J., Decker, E.A. (2007). Role of physical structures in bulk oils on lipid oxidation. Critical Reviews in Food Science and Nutrition, 47(3): 299-317. https://doi.org/10.1080/10408390600754248
[37] Arpi, N. (2014). Combination of natural antioxidant α-tocopherol with ascorbic acid and synthetic antioxidant BHA with BHT in inhibiting rancidity of roasted coconut (U Neulheu) during storage. Jurnal Teknologi dan Industri Pertanian Indonesia, 6(2): 2064. https://doi.org/10.17969/jtipi.v6i2.2064
[38] Nasional, B.S. (2008). Standar Minyak Kelapa Virgin (VCO): SNI 7381: 2008.
[39] Marinković, V. (2021). Some applications of a novel desirability function in simultaneous optimization of multiple responses. FME Transactions, 49(3): 534-548. https://doi.org/10.5937/fme2103534M
[40] Silva, M.M., Reboredo, F.H., Lidon, F.C. (2022). Food colour additives: A synoptical overview on their chemical properties, applications in food products, and health side effects. Foods, 11(3): 379. https://doi.org/10.3390/foods11030379
[41] Durazzo, A., Carocho, M., Heleno, S., Barros, L., Souto, E.B., Santini, A., Lucarini, M. (2022). Food dyes and health: Literature quantitative research analysis. Measurement: Food, 7: 100050. https://doi.org/10.1016/j.meafoo.2022.100050
[42] Charles, K., Ning, Z., Rafiu, K.R., Ruru, P. (2019). Color measurement of segmented printed fabric patterns in lab color space from RGB digital images. Journal of Textile Science and Technology, 5(1): 1-18. https://doi.org/10.4236/jtst.2019.51001
[43] Yadav, D.N., Thakur, N., Sunooj, K.V. (2012). Effect of partially de-oiled peanut meal flour (DPMF) on the nutritional, textural, organoleptic and physico chemical properties of biscuits. Food and Nutrition Sciences, 3(4): 471-476. https://doi.org/10.4236/fns.2012.34067
[44] Seow, C.C., Gwee, C.N. (1997). Coconut milk: Chemistry and technology. International Journal of Food Science and Technology, 32(3): 189-201. https://doi.org/10.1046/j.1365-2621.1997.00400.x