Eka Kurniasih*![]() | Rahmi
| Rahmi![]() | Muhammad Dani Supardan
| Muhammad Dani Supardan![]() | Darusman
| Darusman![]() | Raida Agustina
| Raida Agustina![]() | Elfiana
| Elfiana![]() | Ridwan
| Ridwan![]() | Cut Aja Rahmawati
| Cut Aja Rahmawati![]()
© 2025 The authors. This article is published by IIETA and is licensed under the CC BY 4.0 license (http://creativecommons.org/licenses/by/4.0/).
OPEN ACCESS
Sucrose esters (SEs) are emulsifiers utilized in food products to enhance flavor, color, and texture. This study focused on the synthesis of SEs from crude palm kernel oil methyl ester (CPKOME) and sucrose using Candida antarctica lipase B (CALB). CPKOME was derived from off-grade crude palm kernel oil as a byproduct of the palm oil industry. The SEs synthesis was conducted at 30℃, a CALB load of 50 mg, with a stirring speed of 250 rpm. The crude SEs were separated through vacuum filtration and dried at 40℃ for 6 hours. This study aimed to determine the optimum substrate conversion based on reaction time and sucrose concentration. The results showed an optimal substrate conversion of 87.80% (SEs weight of 84.42 g), which was achieved at a sucrose concentration of 400 mg.mL-1 and a reaction time of 12 h. The characteristics of the SEs with optimal conversion obtained were as follows: purity of 91.82%, free sucrose of 1.75%, acid value of 2.93, and free methanol of 8.92 mg·kg-1. SEs have a hydrophilic-lipophilic balance (HLB) of 12.35 and are classified as oil-in-water (O/W) emulsifiers. The range of HLB values that are considered appropriate to stabilize oil-in-water emulsions is between 8 and 18. Applying SEs of 0.6% (w/v) in a coconut milk emulsion can maintain emulsion stability for 7 days of storage. In addition, SEs showed antibacterial activity by inhibiting the growth of Staphylococcus aureus. At a concentration of 1 mg·mL-1, SEs showed an inhibition zone of 7.24 mm after 5 days of incubation. In comparison, gentamicin (positive control) at the same concentration showed an inhibition zone of 24.90 mm. Moreover, this study demonstrates a sustainable enzymatic route to convert off-grade crude palm kernel oil into SEs, which have potential as multifunctional food emulsifiers and antibacterial agents.
antibacterial, crude palm kernel oil, emulsifier, enzymatic, methyl ester, off-grade, sucrose
Off-grade crude palm kernel oil (CPKO) is derived from palm oil plants. Oil plants sometimes produce palm oil that does not meet commercial quality standards and is therefore classified as waste. Due to its high acid value, off-grade CPKO has never been utilized as a raw material for food additives. Off-grade CPKO contains 59.83% of lauric acid, which is good for health because it has antibacterial properties. Research indicates that SEs containing alkyls of lauric acid exhibit anti-microbial activity [1], and are easily metabolized by the body [2]. Due to their high lauric acid content, this quality adds value to the synthesized SEs based on off-grade CPKO [3]. SEs are food emulsifiers synthesized from fatty acids, triglycerides, and methyl esters with disaccharides such as sucrose. SEs are widely known for their effectiveness in maintaining the stability of emulsion systems. They are employed in various sectors, including food products [4], pharmaceuticals [5], and personal care [6]. SEs are frequently used as food additives because they act as emulsifiers and stabilizers [5, 7]. SEs were amphiphilic emulsifiers with sucrose as the head and fatty acid chain as the tail in one molecule. The head is a hydrophilic group, and the tail is a lipophilic group [8]. As an emulsifier, SEs could decrease surface tension and disperse the immiscible liquid phase. The mechanism of SEs as an emulsifier begins when the head (polar groups) binds water, and the tail (non-polar groups) binds fat, resulting in the formation of globules that spread the two liquid phases [9]. Different types of fatty acids create SEs with varying properties and applications [10]. The most commonly used fatty acids in SEs synthesis are capric, lauric, myristic, palmitic, stearic, and oleic [5]. However, the rising cost of fatty acids requires urgent identification of alternative raw materials. One highly promising alternative is methyl ester compounds derived from triglycerides, such as off-grade CPKO. Using methyl esters effectively inhibits the formation of H₂O as a by-product, which is usually generated when fatty acids or triglycerides are used as substrates. It prevents evaporation at high temperatures during water removal processes. Furthermore, the use of methyl ester will reduce production costs and maintain the quality of SEs. Ester compounds significantly reduce the reaction time, because alkyl breakdown is much easier in these compounds than in fatty acids due to the absence of hydrogen bonds. The methyl ester molecules produced from off-grade CPKO consist of short to long-chain fatty acids, which results in SEs having a wider range of hydrophilic-lipophilic balance (HLB), making them suitable for various applications.
Although the enzymatic synthesis of SEs has been extensively investigated using various fatty acids, triglycerides, and fatty acid methyl esters, most of the reported studies utilized single substrates with low free fatty acids [11, 12]. Thus, many studies focus on process optimization or evaluation of functional applications, without systematic linkages between feedstock characteristics, enzymatic reactions, product molecular structure, and applications as emulsifiers. In particular, studies addressing crude palm kernel oil methyl ester (CPKOME) from off-grade CPKO, which is characterized by high free fatty acids and complex mixtures of medium-chain fatty acids (MCT), are still very limited. The use of mixed fatty acids and high free fatty acids significantly affects the enzymatic reaction selectivity and the resulting hydrophilic-lipophilic balance; these aspects are rarely addressed in an integrated manner. Conventional SEs produced using triglycerides and fatty acids reacted with sucrose or its derivatives at high temperatures between 120-185℃ in a solvent-based system [13]. Dimethylformamide (DMF), dimethyl sulfoxide (DMSO), and 2-methyl-2-butanol (2M2B) are frequently used in solvent-based systems [12]. Currently, there is a concerted effort to reduce the utilization of toxic solvents. The synthesis of SEs using triglycerides, fatty acids, and methyl esters from oil palm plants as raw materials and Candida antarctica lipase B (CALB) began to be developed [13, 14]. Furthermore, CALB is capable of facilitating the synthesis of SEs using solvent-free methods at moderate temperatures, ranging from 40-70℃.
Importantly, CALB exhibits high regio-selectivity, preferentially catalyzing esterification at the primary hydroxyl groups of C-6 (glucose) and C-6' (fructose) of sucrose over secondary hydroxyl groups. This selectivity is beneficial for the formation of sucrose monesters and diesters with more defined structures, rather than complex mixtures of polyesters generally obtained through chemical synthesis [15, 16]. The use of moderate temperatures lowers energy consumption and production costs [16, 17]. Applying CALB in the synthesis of SEs can produce higher quality SEs, characterized by bright color and preservation of the natural properties of fatty acids, and do not contain toxic residues from solvents. The synthesis of SEs using CALB does not produce toxic waste, thus minimizing and facilitating industrial waste treatment. Although the synthesis is generally longer, its development is deemed feasible when taking into account health and environmental concerns [17], energy process efficiency, worker safety, and waste management [18].
Therefore, this study aims to address this gap by systematically investigating the enzymatic synthesis of SEs from CPKOME, which is synthesized from off-grade CPKO. This study focuses on optimizing the synthesis conditions using CALB, characterizing the physical, chemical, and structural properties of the optimum SEs, and evaluating SEs' functional performance as food emulsifiers and antibacterial agents. The correlation between process conditions, product structure, and application properties is explicitly explored to provide a comprehensive understanding of SEs derived from this underutilized, off-grade value feedstock.
2.1 Materials
Off-grade CPKO was received from the PTPN IV, a palm kernel oil processing plant located in the Pabatu region of North Sumatra Province, Indonesia. It has a bright yellow to orange color, freezes at temperatures below 30℃, and has a high acid value of 5.46 mg KOH·g-1, which is off-grade quality triglycerides. During research, the off-grade CPKO was stored at 25-28℃ to prevent an increase in acid value. It was classified as a medium-chain triglyceride (MCT), with lauric acid (C12) and myristic acid (C14) being the most abundant fatty acids. The chemicals used in the synthesis of CPKOME were 98% H2SO4, NaOH, and 99% CH3OH, and sucrose obtained from the Merck Company. Candida antarctica lipase B (CALB) was used as a biocatalyst obtained from Novozyme Inc.
2.2 Preparation of methyl ester from off-grade crude palm kernel oil
CPKO that converted into CPKOME and sucrose were utilized as substrates. CPKOME was synthesized through a chemical series reaction of esterification and transesterification. These reactions were carried out in a 1 L flat-bottom glass reactor equipped with a magnetic heater and stirrer, a circular water condenser, and a thermocouple to regulate the reaction temperature.
2.2.1 Esterification
A total of ± 200 mL of off-grade CPKO was reacted with 65 mL of methanol (1:10 mole/mole), and heated to a temperature of 65℃. As an acid catalyst, 22.5 mL of H2SO4 was slowly added to the reaction mixture when the reaction temperature was reached. The process lasted for 120 min at a constant temperature of 65℃, which corresponds to the boiling point of methanol. To promote the homogeneity of the mixture, it was stirred at 450 rpm during the reaction. After the reaction time was completed, the mixture separated into two distinct layers: the upper layer contained the fatty acid methyl ester (FAME), while the lower layer held the residual H₂SO₄ catalyst and water, which are by-products of the esterification reaction. The FAME was separated using the decantation method with a separatory funnel. Following that, the FAME was utilized as a raw material in the transesterification reaction.
2.2.2 Transesterification
Approximately 200 mL of FAME was heated to a temperature of 65℃. Following that, 65 mL methoxide solution (65 mL methanol + 0.75 g NaOH) was added to FAME after the temperature was reached. The molar ratio of FAME to methanol was maintained at 1:10. The transesterification reaction lasted for 180 min at a constant temperature of 65℃, and was stirred at 400 rpm during the reaction. After the reaction time was completed, the reaction mixture was separated into two layers. The crude CPKOME was in the upper layer, and crude glycerol (by-product) was in the lower layer. The crude CPKOME was separated from the reaction mixture by decantation. The crude CPKOME is rinsed at least 3 to 4 times with warm distilled water (40℃) to remove the soap that has been mixed with the crude CPKOME. Soap is formed by the uncontrolled saponification reaction of free fatty acids with NaOH. If the CPKOME is devoid of soap, the washing distilled water will be transparent. Subsequently, purified CPKOME was evaporated at 105 °C to remove any residual washing distilled water that could degrade the quality of the ester compounds and interfere with the synthesis of SEs.
2.2.3 Characterization of CPKOME
The CPKOME was analyzed to determine the physical and chemical characteristics. The characteristics consist of ester content (MPOB p3.4) [19], acid value (AOCS Ca 5a-40-1998), saponification value (AOCS Cd 3-25-1998), water content (AOCS Ca-2c-25-1998) [20], impurities (AOCS Ca 3a-46-1998), density (IOPRI, 2004) [21], and unreacted methanol [22].
2.3 Synthesis of sucrose ester
The substrate consisted of 50 mL of CPKOME and 30 g of sucrose (substrate concentration = 600 mg·mL-1), which were homogenized for 24 h at a stirring speed of 400 rpm. Following that, 50 mg of CALB was added to the substrate. The reaction occurred at a temperature of 30℃ with a stirring speed of 250 rpm. At the end of the reaction, excess CPKOME and CALB were separated from the reaction mixture using a filtration method. The crude SEs were rinsed slowly with distilled water to remove any remaining methanol. To evaporate the residual CPKOME and wash water from the product, the SEs were dried in an oven at 40℃ for 6 h. This slow drying was performed at temperatures below the boiling points of water and methanol to prevent browning reactions in the SEs. The next step involved conducting a refractive index analysis to determine the final sucrose concentration using a Brix refractometer. This experiment examined two independent variables affecting the reaction, with three replicates to optimize the yield of SEs. The two factors studied were reaction time and sucrose concentration. To determine the effect of reaction time on substrate conversion, the study was conducted at 2 to 20 h, with sucrose concentration held constant at 600 mg·mL-1. The mass of sucrose used was consistently set at 50 g for all experiments. The reaction time that yielded optimal substrate conversion was then utilized as a fixed variable to determine the effect of sucrose concentration in subsequent studies. Afterward, the experiment was repeated without adding CALB (as a control reaction) to observe the performance of CALB in converting the substrate into product.
This experiment examined two independent variables affecting the reaction, with three replicates (n = 3) for each experimental condition to optimize the yield of SEs. All the experimental data will be presented as the mean ± standard deviation of the three replicates. The statistical significance of differences between treatment means was determined using one-way Analysis of Variance (ANOVA) followed by Fisher's Test at a 95% confidence level (p < 0.05).
2.4 Determination of substrate conversion
2.4.1 Preparation of the sucrose standard curve
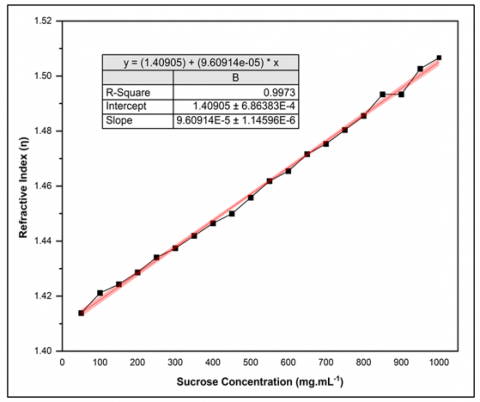
A sucrose standard solution curve was prepared with varying sucrose concentrations from 50 to 1,000 mg·mL-1, as illustrated in Figure 1. Sucrose was dissolved in distilled water, and the percentage of Brix (°Brix) was measured using a Brix refractometer. The measured Brix (%) was then converted to the refractive index. Finally, the refractive index data for each sucrose concentration were plotted.
Figure 1. Standard curve showing the relationship between refractive index (η) and sucrose concentration (mg/mL)
Based on the sucrose standard curve, a linear equation (y = 1.40905 + 9.60914e-05) with R2 = 0.9973 was obtained. This equation was used to calculate the final concentration of sucrose after the reaction. The sucrose standard curve was utilized to determine the relationship between the refractive index and the sample concentration.
2.4.2 Calculation of substrate conversion
A total of 50 mg of SEs was dissolved in distilled water. A Brix refractometer was used to determine the °Brix (%) of SEs. The prism was then covered with a prism cover, and the sample was placed on the daylight plate (blue prism). Once the light-dark area on the lens was visible, the measuring scale was adjusted, and the °Brix (%) was recorded. The °Brix (%) was subsequently converted to the refractive index. The refractive index was then substituted into the linear equation derived from the sucrose standard curve. The final sucrose concentration was calculated using Eq. (1).
Substrate conversion (%) $=\frac{S_0-S_1}{S_0} \times 100$ (1)
where,
So = Initial sucrose concentration, and S1 = Final sucrose concentration.
2.5 Characterization analysis of sucrose ester
SEs' purity, free sucrose, FFAs, methanol content, and HLB were all determined according to the parameters of the Food and Agriculture Organization (FAO-JECFA Monograph 4). SEs purity and free sucrose were determined using a spectrophotometer-UV. The acid value analysis follows the AOCS Ca 5a-40-1998 [20]. The HLB value in this study was calculated using Griffin’s formula, HLB = 20×(1-S/A) [23]. The formula requires two experimentally determined values: the saponification number (S) and the acid number (A), obtained through separate titration procedures. The methanol content was measured by the gas chromatograph method, using a Shimadzu GC-2100 Plus (column: polydimethylsiloxane 30 m × 0.53 mm, FID detector, temperature 110℃, N2 as carrier gas). The functional groups of SEs were then determined using a Shimadzu spectrophotometer-FTIR Prestige 21 with a wavelength range of 400-4000 cm-1. As a control for the change in functional groups from substrate to main product, SEs (commercial), sucrose, and CPKOME were used as a comparison. Moreover, for the determination of antibacterial properties, SEs were tested on Staphylococcus aureus gram-positive bacterium (ATCC 25923), using the diffusion method.
2.6 Application of sucrose ester in coconut milk
Coconut milk is an emulsion of oil in water, commonly found in various processed foods, such as cakes and beverages. SEs can help maintain the stability of coconut milk emulsion, extend its shelf life, and enhance its quality, including flavor, color, and taste. In several formulations, SEs were optimally added to coconut milk. Coconut milk is made without the addition of water, using only coconut juice. To prevent contamination and preserve its color, taste, and aroma, the coconut milk is pasteurized at 70℃ for 30 min. The emulsion system was prepared with a total volume of 100 mL, consisting of 50 mL of coconut milk (aqueous phase) and 50 mL of cooking oil (oil phase), resulting in an oil-to-water (O/W) ratio of 1:1 (v/v). SEs were added at concentrations of 0.2-1.0% (w/v) relative to the total emulsion volume. Primary emulsification at 500 rpm for 30 minutes, and homogenization were carried out simultaneously using a high-speed magnetic stirrer type IKA C-MAG HS 7 at 1.500 rpm for 30 minutes at room temperature (28-30℃). The effects of SEs on pH and cream index were observed over a 7-day storage period.
2.6.1 Creaming index
Coconut milk samples from each treatment were placed in test bottles, sealed, and stored for 7 days at room temperature (30-33℃). The stability of the coconut milk emulsion is determined by measuring the creaming index during storage. After 7 days of storage, the sample was separated into three layers [24]. The creaming index was calculated using Eq. (2).
Creaming index (%) $=\frac{\mathrm{H}_1}{\mathrm{H}_0} \times 100$ (2)
where,
Ho = Total emulsion height, and H1 = Cream layer height (cm).
2.6.2 Measurement of pH change
The pH change of coconut milk was measured using a pH meter Smart Sensor PH 818 to detect the acidity of the sample. To determine the pH value, an electrode was dipped into the sample for 2 min until the pH value was read. The pH value was measured on days 1, 2, 3, 4, 5, 6, and 7 [25].
2.6.3 Distribution of droplets
The droplet distribution appearance of the samples with the highest and lowest creaming index on day 7 was viewed using a Zeiss trinocular Zen 2.5 microscope.
3.1 Methyl ester from CPKO
CPKOME was synthesized by esterification and transesterification reactions [3, 26]. The CPKO used as raw material had a high acid value of 5.46 mg KOH.g-1. The esterification reaction required reacting CPKO with methanol and utilizing H2SO4 as an acid catalyst. The reaction lasted 120 min at a temperature of 65℃. This stage was needed to reduce the acid value of CPKO, so it could minimize the formation of side products in transesterification. In the synthesis of PKOME, a high acid value implies a large level of unbound fatty acid chain as free fatty acids in CPKO, which may trigger a saponification reaction with NaOH as a base catalyst. The acid value analysis was performed after the esterification reaction was completed. The acid value declined by 60.44% (from 5.46 to 2.16 mg KOH·g-1). This implies that CPKO has been converted into FAME. FAME was in the upper layer, while the excess H2SO4 catalyst mixed with water as a by-product of the reaction was in the lower layer, which could be easily separated using a decantation process based on differences in mixture density. Decantation is a highly effective physical separation method to purify two or more compounds based on the difference in density of each compound. After that, FAME was used as a raw material in the transesterification reaction.
Figure 2. Decantation process (a) FAME separation at esterification reaction, (b) CPKOME separation at transesterification reaction
The transesterification reaction started by reacting FAME with methanol at 65℃ for 180 min with the addition of NaOH as a base catalyst. Transesterification aims to maximize the possibility of producing a higher ester content. CPKOME, crude glycerol, and a small quantity of soap were formed during the transesterification stage. In addition, the transesterification reaction can neutralize the H2SO4 catalyst that may remain in the FAME after the first decantation. After the reaction time is completed, CPKOME is separated from the reaction mixture through decantation. The upper layer contained CPKOME, while the lower layer had crude glycerol. To purify the PKOME from soaps and other impurities, the CPKOME is washed with warm distilled water (40℃) to dissolve NaOH and CPKO (in the form of soap), unreacted methanol, and residual glycerol. The decantation process of FAME and CPKOME from the reaction mixture and the impurities can be seen in Figure 2.
3.2 Characteristics of CPKOME
3.2.1 Physical and chemical characteristics of CPKOME
CPKOME was characterized to determine the quality of the methyl esters produced and to ensure that it does not contain toxic compounds, such as unreacted methanol and soaps, which could inhibit the biocatalytic activity of CALB. PKOME exhibits a lower acid value and a higher saponification value compared to CPKO, indicating the purity of the ester compounds produced. The lower acid value suggests that the methyl ester contains minimal unreacted triglycerides, as nearly all CPKO has been converted into methyl ester. Additionally, the water content and impurities are low, ensuring methyl ester does not interfere with the biocatalytic activity of CALB. It is important to note that CALB cannot function effectively at high water content, and excessive impurities can inhibit reactions. The presence of unreacted methanol in the methyl ester is very low, indicating that both the synthesis and purification processes are complete. The CPKOME obtained from this synthesis has suitable physical and chemical characteristics for use as a substrate, as it does not contain any inhibitory compounds that could potentially interfere with the synthesis of SEs. The characteristics of CPKOME synthesized from PKO are summarized in Table 1.
Table 1. Physical and chemical characteristics of CPKOME and off-grade CPKO
|
Parameters |
Unit |
Result of Measurement |
|
|
CPKOME |
CPKO |
||
|
Acids value |
mg KOH·g-1 |
0.18 |
5.46 |
|
Saponification value |
mg KOH·g-1 |
298.12 |
248.78 |
|
Water content |
% |
0.03 |
0.15 |
|
Impurities |
% |
0.02 |
0.04 |
|
Density |
g·cm-3 |
860 |
950 |
|
Methanol content |
mg·kg-1 |
0.01 |
- |
3.2.2 Ester content of PKOME
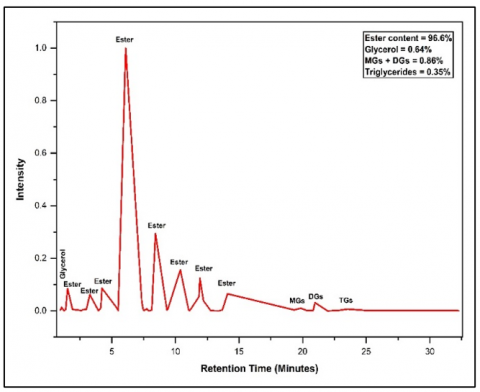
The purified PKOME was analyzed using a Shimadzu 2010 Plus gas chromatograph with a DB-23 Agilent column that has a length of 30 meters. Nitrogen (N2) was employed as the carrier gas, and the detector temperature was set at 350℃ to quantify the ester content. The analysis indicated that the ester content was 96.6%, while the remaining unreacted PKO ≥accounted for 0.51%. These results from the gas chromatography (GC) analysis aligned with the low acid value observed in PKOME. The ester content serves as an indicator of the purity of the ester compound. The higher the purity, the greater the likelihood of forming a bond between sucrose and the ester produced. The GC chromatogram of PKOME is shown in Figure 3.
Figure 3. GC chromatogram of CPKOME derived from off-grade CPKO through esterification and transesterification reaction
3.3 Effect of reaction time on substrate conversion
The majority of reactions using CALB require a longer reaction time. This is primarily due to the ability of CALB to break down or synthesize substrates under specific conditions. Determining the appropriate reaction time is essential to identify the minimum duration needed to achieve optimal substrate conversion. The selection of reaction time is informed by several previous studies. A study was conducted to observe the yield of sucrose caprate formed at a reaction time of 1-3 h. Another study investigated the synthesis of oligofructose esters using oligofructose and short to long fatty acids (C8 to C18) in DMSO solvent using Novozyme 435. The reaction times evaluated were 16 h, 39 h, and 63 h, resulting in substrate conversions of 27%, 24%, and 36%, respectively. The use of reaction times above 16 hours showed a decrease in substrate conversion [27]. While at the reaction time of 39-63 h, there was an increase in substrate conversion due to the addition of Novozyme 435 in the reaction system. This shows that the enzyme ratio and reaction time interact in an enzymatic reaction. Additionally, another research has been conducted [28], highlighting the relationship between CALB and reaction temperature in SEs production, where an increase in reaction temperature ≥ 75℃ results in a decrease in product yield, as CALB begins to undergo protein denaturation.
The results showed that reaction temperature affects the stability of CALB and the solubility of reactants. Immobilized CALB can be used at temperatures between 60-80℃ without significant loss of catalytic activity. These findings were taken into consideration when determining the reaction time for SEs synthesis, which was carried out for 20 h, with 2 h intervals for each treatment. Other parameters were maintained at a fixed temperature of 30℃, sucrose concentration of 600 mg.mL-1, and CALB load of 50 mg. As a control reaction was performed under the same experimental conditions. Substrate conversion was measured by monitoring the decrease in sucrose concentration at the end of the reaction. The decrease in initial sucrose concentration indicates that the O-H bond in sucrose has been broken and bound to the ester group.
The conversion of sucrose to SEs was calculated using a Brix refractometer by analyzing the difference between the initial sucrose concentration (So) and the final sucrose concentration (S1) based on the refractive index (η). This method proved effective for quantitatively determining the percentage of sucrose converted to SEs. Given the specificity of the reaction using CALB, there are no by-products formed other than the main product generated. This study also included a control reaction, in which treatment without CALB was carried out to evaluate the performance of CALB in catalyzing enzymatic reactions. The results of sucrose concentration measurements for the CALB and non-CALB reactions are presented in Tables 2 and 3.
Table 2. Final sucrose concentration in the reaction using CALB at different reaction times
|
Time (h) |
|
°Brix Value (%) |
Refractive Index (η) |
Time (h) |
|
°Brix Value (%) |
Refractive Index (η) |
|
$\overline{\mathrm{S}_0}$ = 600 |
$\overline{\mathrm{Brix}}_{\mathrm{o}}$ = 70 |
$\overline{\eta_0}$ = 1.465 |
$\overline{\mathrm{S}_0}$ = 600 |
$\overline{\mathrm{Brix}}_{\mathrm{o}}$ = 70 |
$\overline{\eta_0}$ = 1.465 |
||
|
$\overline{\mathrm{S}_1}$ |
$\overline{\mathrm{Brix}}_1$ |
$\overline{\eta_1}$ |
$\overline{\mathrm{S}_1}$ |
$\overline{\mathrm{Brix}}_1$ |
$\overline{\eta_1}$ |
||
|
2 |
342.723 |
60.0 |
1.442 |
12 |
81.256 |
48.5 |
1.417 |
|
4 |
330.890 |
60.0 |
1.442 |
14 |
81.256 |
48.5 |
1.417 |
|
6 |
226.178 |
55.0 |
1.431 |
16 |
81.256 |
48.5 |
1.417 |
|
8 |
158.325 |
52.5 |
1.424 |
18 |
119.581 |
50.5 |
1.421 |
|
10 |
97.540 |
49.0 |
1.418 |
20 |
152.774 |
52.0 |
1.423 |
$\overline{\mathrm{S}}=$ mean of sucrose concentration, $\overline{\mathrm{S}_{\mathrm{o}}}=$ mean of initial sucrose concentration, $\overline{\mathrm{S}_1}=$ mean of final sucrose concentration, $\overline{\operatorname{Brlx}}_{\mathrm{o}}=$ mean of initial ${ }^{\circ}$ brix value, $\overline{\operatorname{Brlx}}_1=$ mean of final ${ }^{\circ}$ brix value, $\overline{\eta_{\mathrm{o}}}=$ mean of initial refractive index, $\overline{\eta_1}=$ mean of final refractive index ( $\mathrm{p}=<0.05$ ).
Table 3. Final sucrose concentration in the non-CALB reaction at different reaction times
|
Time (h) |
|
°Brix Value (%) |
Refractive Index (η) |
Time (h) |
|
°Brix Value (%) |
Refractive Index (η) |
|
$\overline{\mathrm{S}_0}$ = 600 |
$\overline{\mathrm{Brix}}_{\mathrm{o}}$ = 70 |
$\overline{\eta_0}$ = 1.465 |
$\overline{\mathrm{S}_0}$ = 600 |
$\overline{\mathrm{Brix}}_{\mathrm{o}}$ = 70 |
$\overline{\eta_0}$ = 1.465 |
||
|
$\overline{\mathrm{S}_1}$ |
$\overline{\mathrm{Brix}}_1$ |
$\overline{\eta_1}$ |
$\overline{\mathrm{S}_1}$ |
$\overline{\mathrm{Brix}}_1$ |
$\overline{\eta_1}$ |
||
|
2 |
451.361 |
65.0 |
0.464 |
12 |
366.492 |
61.0 |
1.444 |
|
4 |
439.057 |
64.0 |
0.439 |
14 |
330.890 |
59.0 |
1.439 |
|
6 |
420.837 |
63.0 |
0.415 |
16 |
301.465 |
58.0 |
1.437 |
|
8 |
408.717 |
62.5 |
0.403 |
18 |
289.790 |
58.5 |
1.438 |
|
10 |
378.555 |
61.5 |
0.379 |
20 |
266.465 |
57.0 |
1.435 |
$\overline{\mathrm{S}}=$ mean of sucrose concentration, $\overline{\mathrm{S}_{\mathrm{o}}}=$ mean of initial sucrose concentration, $\overline{\mathrm{S}_1}=$ mean of final sucrose concentration, $\overline{\operatorname{Brlx}}_{\mathrm{o}}=$ mean of initial ${ }^{\circ}$ brix value, $\overline{\operatorname{Brlx}}_1=$ mean of final ${ }^{\circ}$ brix value, $\overline{\eta_{\mathrm{o}}}=$ mean of initial refractive index, $\overline{\eta_1}=$ mean of final refractive index ( $\mathrm{p}=<0.05$ ).
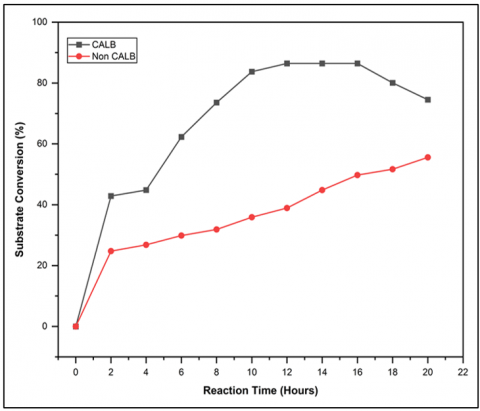
The reaction using CALB showed that the sucrose concentration decreased from 600 mg·mL-1 to 342,723 mg·mL-1 after 2 h of reaction time. This indicates that CALB began its catalytic activities from the beginning of the reaction. In contrast, the reaction without CALB also showed a decrease in sucrose concentration, which increased with reaction time. However, this decrease was slightly smaller than that observed in the reaction using CALB. Based on the research results, it is known that the highest initial rate was in the first 2 hours, indicating vigorous catalytic activity of CALB at the onset. The progression of the reaction showed a characteristic trend: an initial rapid increase in conversion (exponential phase, 6-12 h) followed by a stationary phase at 14-16 h of reaction. This pattern aligns with Michaelis-Menten kinetics, where the rate is dependent on substrate availability. However, the attainment of a stationary phase at 86.5% subtrate conversion, while sucrose substrate remained, suggests factors beyond substrate depletion influenced the reaction. The subsequent decline in conversion after 16 hours strongly indicates the onset of enzyme inhibition, likely due to the accumulation of methanol (a by-product of the transesterification), which is known to act as a competitive inhibitor for CALB at elevated concentrations [29]. Furthermore, prolonged exposure to the reaction medium might contribute to a partial loss of catalytic efficiency. Therefore, the optimal reaction time of 12 hours represents a balance between achieving high conversion and avoiding significant inhibitory effects, thereby maximizing the catalytic productivity of the immobilized CALB. In addition, the sucrose concentration continues to decrease as the reaction time increases, because most of the substrate has been broken down by CALB into products. The results provide similar results to research conducted by researcher [30], which synthesized sugar esters from vinyl laurate. The sugar sources came from fructose, sucrose, and glucose, with a maximum product yield of ± 57-58% for each type of sugar ester produced at a reaction time of 12 h. As a control for the reaction, a study was conducted with the same reaction conditions but without CALB load. The results showed that the substrate conversion increased with the increase in reaction time. The maximum conversion was obtained at a reaction time of 20 h at 55.6%. This shows that the longer the contact time between the two substrates, the greater the chance of the reaction rate towards the product. However, when compared to reactions using CALB, reactions involving CALB as a biocatalyst are considered more efficient. Because a substrate conversion of 55.6% only requires a reaction time of 4-6 h [31]. Although there is an additional cost of the catalyst, the CALB can be regenerated, so it can be used repeatedly [32]. Based on the research, the reaction time of 12 h was used as a fixed level for the subsequent study to determine the effect of sucrose concentration on substrate conversion. Increasing the reaction time above 12 h did not show a significant increase in substrate conversion. This is because the CALB performance has entered the stationary phase, and the increase in reaction time above 16 h has led to the logarithmic phase (death phase). Substrate conversion at a reaction time of 12 h has reached 86.5%, and the SEs purification process can be conducted easily. Subsequently, to produce the optimal SEs yield, a reaction time of 12 h was utilized. The interaction between reaction time and substrate conversion is shown in Figure 4.
From the research results, it is known that the highest initial rate was in the first 2 hours, indicating vigorous catalytic activity of CALB at the onset. The progression of the reaction showed a characteristic trend: an initial rapid increase in conversion (exponential phase, 6-12 h) followed by a stationary phase at 14-16 h of reaction. This pattern aligns with Michaelis-Menten kinetics, where the rate is dependent on substrate availability. However, the attainment of a stationary phase at 86.5% subtrate conversion, while sucrose substrate remained, suggests factors beyond substrate depletion influenced the reaction. The subsequent decline in conversion after 16 hours strongly indicates the onset of enzyme inhibition, likely due to the accumulation of methanol (a by-product of the transesterification), which is known to act as a competitive inhibitor for CALB at elevated concentrations [29]. Furthermore, prolonged exposure to the reaction medium might contribute to a partial loss of catalytic efficiency. Therefore, the optimal reaction time of 12 hours represents a balance between achieving high conversion and avoiding significant inhibitory effects, thereby maximizing the catalytic productivity of the immobilized CALB.
Figure 4. Substrate conversion on the synthesis of sucrose ester from CPKOME and sucrose at different reaction times
The sucrose concentration continues to decrease as the reaction time increases, because most of the substrate has been broken down by CALB into products. The results provide similar results to research conducted by researcher [30], which synthesized sugar esters from vinyl laurate. The sugar sources came from fructose, sucrose, and glucose, with a maximum product yield of ± 57-58% for each type of sugar ester produced at a reaction time of 12 h. As a control for the reaction, a study was conducted with the same reaction conditions but without CALB load. The results showed that the substrate conversion increased with the increase in reaction time. The maximum conversion was obtained at a reaction time of 20 h at 55.6%. This shows that the longer the contact time between the two substrates, the greater the chance of the reaction rate towards the product. However, when compared to reactions using CALB, reactions involving CALB as a biocatalyst are considered more efficient. Because a substrate conversion of 55.6% only requires a reaction time of 4-6 h [31]. Although there is an additional cost of the catalyst, the CALB can be regenerated, so it can be used repeatedly [32]. Based on the research, the reaction time of 12 h was used as a fixed level for the subsequent study to determine the effect of sucrose concentration on substrate conversion. Increasing the reaction time above 12 h did not show a significant increase in substrate conversion. This is because the CALB performance has entered the stationary phase, and the increase in reaction time above 16 h has led to the logarithmic phase (death phase). Substrate conversion at a reaction time of 12 h has reached 86.5%, and the SEs purification process can be conducted easily. Subsequently, to produce the optimal SEs yield, a reaction time of 12 h was utilized.
3.4 Effect of substrate concentration on substrate conversion
In this study, sucrose was reacted with an excess of CPKOME. Hence, sucrose acted as the limiting reactant observed. It was recognized that using an excess concentration of CPKOME could increase the probability of ester bonds forming when interacting with hydroxyl groups from sucrose. This research was carried out at 30℃ with a CALB load of 50 mg. The reaction using CALB lasted for 12 h at a stirring speed of 250 rpm. The initial sucrose concentration was 100 mg·mL-1 to 1,000 mg·mL-1, with an increased sucrose concentration interval of 100 mg·mL‑1. At ten observation data points, the influence of substrate concentration on substrate conversion was seen. The concentration of the substrate is a significant element in reactions using CALB. CALB activity grows linearly, then logarithmically, until it reaches a maximum state where additional increases in substrate concentration do not affect the reaction speed. It is critical to determine the sucrose concentration to identify the upper limit of sucrose concentration that CALB can convert into the main product. The results of the final sucrose concentration measurement after 12 h of reaction are presented in Tables 4 and 5.
The results show that S1 (mg·mL-1). quantitatively represents the concentration of sucrose that was not converted into the primary product (SEs) by CALB activity. Depending on the catalytic activity of CALB, each change in initial concentration So (mg·mL-1) results in a different S1 (mg·mL-1). The effect of varied sucrose concentrations on substrate conversion is shown in Figure 5.
Table 4. Final sucrose concentration in the reaction using CALB at different sucrose concentrations
|
|
°Brix Value (%) |
Refractive Index (η) |
|
°Brix Value (%) |
Refractive Index (η) |
||||||
|
$\overline{\mathrm{S}_0}$ |
$\overline{\mathrm{S}_1}$ |
$\overline{\mathrm{Brix}}_{\mathrm{o}}$ |
$\overline{\mathrm{Brix}}_{\mathrm{1}}$ |
$\overline{\eta_0}$ |
$\overline{\eta_1}$ |
$\overline{\mathrm{S}_0}$ |
$\overline{\mathrm{S}_1}$ |
$\overline{\mathrm{Brix}}_{\mathrm{o}}$ |
$\overline{\mathrm{Brix}}_{\mathrm{1}}$ |
$\overline{\eta_0}$ |
$\overline{\eta_1}$ |
|
100 |
54.110 |
50.5 |
47.25 |
1.421 |
1.118 |
600 |
97.539 |
70.0 |
49,25 |
1.465 |
1.446 |
|
200 |
81.204 |
54.0 |
48.50 |
1.429 |
1.424 |
700 |
114.031 |
74.0 |
50.00 |
1.475 |
1.449 |
|
300 |
75.785 |
58.0 |
48.25 |
1.437 |
1.431 |
800 |
147.225 |
78.0 |
51.50 |
1.485 |
1.451 |
|
400 |
48.691 |
62.0 |
47.00 |
1.447 |
1.439 |
900 |
169.581 |
82.0 |
52.50 |
1.493 |
1.453 |
|
500 |
70.336 |
66.0 |
48.00 |
1.456 |
1.442 |
1,000 |
197.775 |
86.0 |
53.75 |
1.507 |
1.456 |
$\overline{\mathrm{S}}=$ mean of sucrose concentration, $\overline{\mathrm{S}_{\mathrm{o}}}=$ mean of initial sucrose concentration, $\overline{\mathrm{S}_1}=$ mean of final sucrose concentration, $\overline{\operatorname{Brix}}_{\mathrm{o}}=$ mean of initial ${ }^{\circ}$ brix value, $\overline{\mathrm{Br}}_1=$ mean of final ${ }^{\circ}$ brix value, $\overline{\eta_{\mathrm{o}}}=$ mean of initial refractive index, $\overline{\eta_1}=$ mean of final refractive index $(\mathrm{p}=<0.05)$.
Table 5. Final sucrose concentration in the non-CALB (enzyme) reaction at different sucrose concentrations
|
|
°Brix Value (%) |
Refractive Index (η) |
|
°Brix Value (%) |
Refractive Index (η) |
||||||
|
$\overline{\mathrm{S}_0}$ |
$\overline{\mathrm{S}_1}$ |
$\overline{\mathrm{Brix}}_{\mathrm{o}}$ |
$\overline{\mathrm{Brix}}_{\mathrm{1}}$ |
$\overline{\eta_0}$ |
$\overline{\eta_1}$ |
$\overline{\mathrm{S}_0}$ |
$\overline{\mathrm{S}_1}$ |
$\overline{\mathrm{Brix}}_{\mathrm{o}}$ |
$\overline{\mathrm{Brix}}_{\mathrm{1}}$ |
$\overline{\eta_0}$ |
$\overline{\eta_1}$ |
|
100 |
86.663 |
50.5 |
48.75 |
1.421 |
1.417 |
600 |
384.555 |
70.0 |
61.75 |
1.465 |
1.446 |
|
200 |
169.581 |
54.0 |
52.50 |
1.429 |
1.425 |
700 |
408.691 |
74.0 |
62.75 |
1.475 |
1.448 |
|
300 |
237.644 |
58.0 |
55.50 |
1.437 |
1.432 |
800 |
451.361 |
78.0 |
64.50 |
1.485 |
1.452 |
|
400 |
307.330 |
62.0 |
58.50 |
1.447 |
1.439 |
900 |
476.021 |
82.0 |
65.50 |
1.493 |
1.455 |
|
500 |
342.723 |
66.0 |
60.00 |
1.456 |
1.442 |
1,000 |
482.199 |
86.0 |
65.75 |
1.507 |
1.455 |
$\overline{\mathrm{S}}=$ mean of sucrose concentration, $\overline{\mathrm{S}_{\mathrm{o}}}=$ mean of initial sucrose concentration, $\overline{\mathrm{S}_1}=$ mean of final sucrose concentration, $\overline{\operatorname{Brix}}_{\mathrm{o}}=$ mean of initial ${ }^{\circ}$ brix value, $\overline{\operatorname{Brix}}_1=$ mean of final ${ }^{\circ}$ brix value, $\overline{\eta_{\mathrm{o}}}=$ mean of initial refractive index, $\overline{\eta_1}=$ mean of final refractive index ( $\mathrm{p}=<0.05$ ).
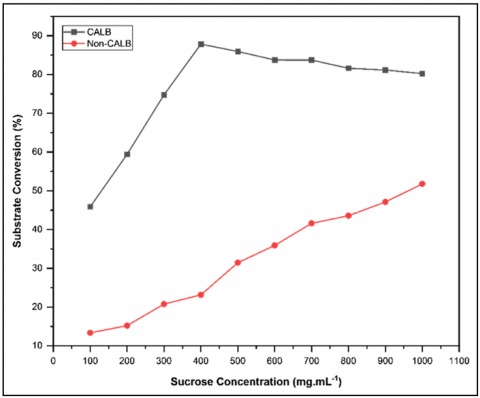
Figure 5. Substrate conversion on sucrose ester synthesis from PKOME at different sucrose concentrations
The results showed that increasing sucrose concentration affected the speed of CALB in breaking down the substrate to form SE compounds. The speed increased as S₀ increased until it reached a maximum at 400 mg·mL-1. Increasing the sucrose concentration above this point caused a consistent decrease in the reaction rate. The decrease in substrate conversion observed at high substrate concentrations (Figure 5) is a clear sign that substrate inhibition has occurred in the enzymatic reaction kinetics [33-35]. In this phenomenon, above the optimal concentration, excess substrate molecules are unproductively bound to the enzyme-substrate complex or secondary sites, forming dead-end complexes that inhibit catalysis. Increasing the sucrose concentration in the reaction using CALB to 400 mg·mL-1 increased substrate conversion to 87.80%. Meanwhile, increasing the sucrose concentration over 400 mg·mL-1 resulted in a decrease in substrate conversion. This occurred when the active site of CALB became saturated with the substrate and was unable to form a CALB-substrate complex. The association of the CALB-substrate complex with excess substrate leads to inhibition, disrupting the reaction.
This prevents the catalytic reaction from occurring and reduces the rate of product formation or stops the catalytic reaction (resulting in zero product formation). CALB has an active site where the substrate interacts to form a CALB-substrate complex, which then forms the end product. The active sites of CALB have the shape of a three-dimensional indentation that can be filled by the substrate. It creates an ideal microenvironment for the catalytic process [33]. The CALB-substrate complex bond is formed due to the weak interaction between the substrate and the CALB. When the active sites are occupied by the substrate and become saturated, the catalytic mechanism is inhibited. This inhibition typically slows or stops the process. This condition is known as substrate inhibition. In this study, excessive substrate consumption decreased the activity of CALB [34]. In the non-CALB reaction, increasing the sucrose concentration to 1,000 mg.mL-1 resulted in a 51.8% increase in SEs conversion. This suggests that increasing the substrate concentration may cause the reaction velocity to accelerate toward the SEs product. However, as compared to the non-CALB reaction, the reaction using CALB yielded optimal substrate conversion, demonstrating that CALB performed with excellent selectivity in catalyzing the esterification reaction. The substrate conversion in reactions using CALB was higher than in non-CALB reactions when the substrate concentration was lower (1,000 mg·mL-1) and the reaction time was the same. The presence of CALB as a catalyst improved the efficiency of the transesterification reaction. So far, the most significant impediments to synthesis development have been the long reaction time and high cost of CALB. However, the long reaction time in the reaction using CALB at low temperatures can save energy, and the high CALB price can be overcome by using immobilized CALB. The CALB can be regenerated 4 to 6 times as a catalyst, thus lowering the cost of raw materials. The kinetic analysis of the effect of sucrose concentration demonstrates that the system follows a typical Michaelis-Menten profile with competitive catalytic activity at lower concentrations, transitioning into a distinct substrate inhibition regime above 400 mg·mL⁻¹. Therefore, the optimal sucrose concentration of 400 mg·mL⁻¹ represents the best compromise to maximize both the reaction rate and the final conversion yield, while avoiding the inefficient regime where the substrate itself acts as an inhibitor.
3.5 Characterization of sucrose ester
Product characteristics are properties that are distinctive and only owned by one product, so they can be used to strengthen the identification of a product. In this study, 6 characteristics of SEs were analyzed and referred to the FAO-JECFA Monograph 4 standards [22].
3.5.1 Sucrose ester purity
The purity of a material is a parameter that is commonly used to describe the quantity of an element or compound in a material or mixture of materials. Based on spectrophotometer-UV analysis, the SEs (synthesized) have a yield of 91.82% and have met FAO-JECFA Monograph 4 standards (≥ 80% of ester compound in SEs).
3.5.2 Free sucrose
According to FAO-JECFA Monograph 4 standards, the permissible free sucrose content is a maximum of 5.0%. The synthesis SE's product has a free sucrose yield of 1.75% from an unreacted substrate. The high sucrose content indicates that the product has low purity, as there is still free sucrose that does not bind to the ester. SEs with high free sucrose content do not function optimally as emulsifiers.
3.5.3 Acid value
Products that have a high acid value can be categorized as products of low quality because the high acid value will be linear with the amount of damaged fatty acid components (free fatty acids). The SE's product has a low acid value of 2.93%, which indicates that the SE's product has good quality. SEs are a triglyceride or fatty acid derivative product, so the low acid value indicates that almost all fatty acid components have been converted into the main product. The SEs (synthesized) have met the FAO-JECFA Monograph 4 standard, which sets the product acid value parameter at a maximum of 6%.
3.5.4 Methanol content
In chemical synthesis, methanol is sometimes used as a reactant or solvent. Therefore, there is a possibility of methanol being present in the final product. According to FAO-JECFA Monograph 4, SEs should allow 10 mg·kg-1 methanol. Based on the analysis, it is known that SEs (synthesis) have a lower methanol content than commercial SEs used as a comparison, which is 8.92 mg·kg-1. This proves that SEs (synthesis) have exceeded FAO-JECFA Monograph 4 standards and are safer for consumption than SEs (commercial), which are synthesized using base catalysts in systems with or without solvents.
3.5.5 Hydrophilic-lipophilic balance (HLB)
The functional properties of the sucrose ester can be used as a reference to determine the application of the SEs. The functional properties of an emulsifier are determined through the value of HLB and the quality of emulsion stability. Characterization of functional properties was carried out on 1 product, which had SEs purity of 91.82%. HLB is a value used on a scale to measure the balance of the hydrophilic and lipophilic groups of an emulsifier molecule. The results of HLB analysis showed that the SEs had an HLB value of 12.35 and were classified as an oil-in-water (o/w) emulsifier. The type of o/w emulsifier is needed in the food industry because many foodstuffs consist of a mixture of oil, fat, and water.
3.5.6 Functional group of sucrose esters
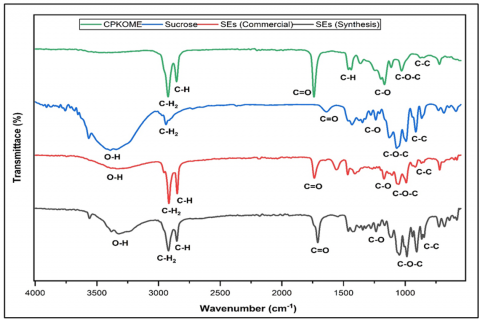
The analysis of the chemical and physical characteristics of SEs was strengthened by identifying the functional groups of experimentally produced SEs and comparing them with commercial SEs and raw materials (sucrose and CPKOME). The spectrophotometer-FTIR analysis definitively showed that the functional groups of SEs (synthesis) were similar to those of SEs (commercial). Some of the main functional groups of SEs are also present in sucrose and PKOME, which proves that SEs are a derivative product of these two compounds converted through reactions. Based on the analysis result, the main functional groups in SEs are C=O and C-O. These two groups are classified as carbonyl groups that must be possessed by CPKOME-derived compounds. The C=O wavenumber revealed a strong intensity at 1,708.65 cm-1. The C-O wavenumber also had a very wide and strong absorption in the range of 1,278 cm-1 to 1,042 cm-1, which indicated a high degree of esterification. The appearance of the C=O group in the product indicates that an ester bond has been formed between sucrose and CPKOME. The characteristics of SEs were reinforced by the presence of carbon and hydrogen atom bonds in the form of straight chains and rings connected through glycosidic bonds. These were detected as aliphatic C-H2 and C-H groups, indicating that SEs are sucrose and CPKOME derivatives [36]. While the O-H hydroxyl group showed a short indentation, which is also characteristic of sucrose. A narrow area of indentation might indicate that the product had a low level of H2O. This condition was the justification for using CPKOME as a raw material, which can minimize the presence of H2O as a side product. Meanwhile, C-O-C and C-C functional groups are typical characteristics of a compound in the fingerprint area. These functional groups are derived from sucrose and CPKOME, proving that the SEs produced have characteristics according to the substrate used. Methyl ester has main functional groups C=O and C-O with strong intensity at 1,739.38 cm-1 and 1,197.29 cm-1. While sucrose has the main functional groups of O-H and C-C. The comparison of wavenumber between SEs and substrates is demonstrated in Figure 6.
Figure 6. Comparison of FTIR spectra of sucrose ester (enzymatic synthesis), sucrose ester (commercial), sucrose, and crude palm kernel oil methyl ester (CPKOME)
The functional groups of SEs are similar to those of the substrate, indicating that SEs are derivatives of CPKOME and sucrose. However, there are some differences, particularly in the C=O and C=C groups. SEs have these groups, while the substrate does not. These two groups are important groups that indicate the presence of ester and carboxylic acid bonds in SEs. The predominance of monoester formation, as supported by the strong C=O peak and the moderate O–H signal in FTIR, is consistent with the known regioselectivity of CALB, which favors esterification at the primary hydroxyl positions of sucrose [33, 34]. This selectivity likely contributed to the high emulsifying performance and consistent antibacterial activity observed, as monoesters generally exhibit more predictable hydrophilic–lipophilic balance (HLB) and interfacial behavior compared to polyester mixtures [35]. The following is a table of SE wave frequencies (synthetic and commercial), as well as substrates (CPKOME), in Table 6.
Table 6. Wave number of sucrose ester, sucrose, and palm kernel oil methyl ester
|
Functional Group |
Wavenumber (cm-1) |
CPKOME |
||
|
Sucrose Ester (synthesis) |
Sucrose Ester (commercial) |
Sucrose |
||
|
O – H |
3,323.47 |
3.329,16 |
3,391.19 |
3,425.10 |
|
C – H2 |
2,919.26 |
2.915,97 |
2,955.24 |
1,460.25 |
|
C – H |
2,851.93 |
2,848,94 |
1,373.07 |
2,922.70 |
|
C = O |
1,708.65 |
1.736,89 |
- |
1,739.38 |
|
C – O |
1,278 |
1.267 |
1,171.82 |
1,197.29 |
|
C – O – C |
1,047.82 |
1.053 |
1,088.12 |
1,029.49 |
|
C – C |
847.56 |
867.92 |
865.93 |
876.86 |
3.5.7 Anti-bacterial activity of Sucrose esters against Staphylococcus aureus
SEs synthesized from off-grade CPKO contain high lauric acid and are known to have anti-bacterial properties. The antibacterial properties were examined to identify whether the SEs have the original properties of lauric acid after the reaction using CALB [35]. The selection of bacteria is based on pathogenic properties and the medium of infection. Gram-positive bacteria cause many diseases that can be transmitted to humans through food products. Optimal SEs were examined on the gram-positive pathogenic bacterium Staphylococcus aureus. The analysis of anti-bacterial activity for 5 days of observation is shown in Table 7.
Table 7. Anti-bacterial activity analysis using different SE concentrations
|
Concentration of SEs |
Inhibition Zone (mm)-Days |
Significance |
|||||
|
1 |
2 |
3 |
4 |
5 |
Mean±SD |
||
|
Control (-) |
0 |
0 |
0 |
0 |
0 |
0.00±0.00 |
e |
|
Control (+) |
24.85 |
24.95 |
24.80 |
24.95 |
24.95 |
24.90±0.07 |
a |
|
1 mg.mL-1 |
8.15 |
8.25 |
6.35 |
6.70 |
6.75 |
7.24±0.82 |
d |
|
2 mg.mL-1 |
10.25 |
9.20 |
10.20 |
9.20 |
9.15 |
9.60±0.53 |
b |
|
3 mg.mL-1 |
8.25 |
7.15 |
7.80 |
6.25 |
8.25 |
7.59±0.87 |
cd |
|
4 mg.mL-1 |
9.95 |
8.80 |
6.70 |
8.50 |
8.90 |
8.57±1.23 |
bc |
|
5 mg.mL-1 |
9.80 |
9.55 |
9.15
|
6.40
|
8.75
|
8.73±1.39
|
bc
|
The statistical analysis showed significant differences (p < 0.005) in antibacterial effectiveness among the various concentrations of SEs tested against Staphylococcus aureus. All SE treatments showed significant antibacterial activity compared to the negative control (Aquadest), confirming the natural antimicrobial properties of the synthesised esters. The concentration of SEs significantly affected its inhibitory effect. Among the tested concentrations, 2 mg·mL-1 showed the highest antibacterial activity, with an average inhibition zone of 9.60 mm. While concentrations of 4 and 5 mg·mL-1 showed comparable effectiveness (8.57 mm and 8.73 mm, respectively), they did not exceed the effectiveness of the 2 mg·mL-1 formulation. At lower SE concentrations (1 and 3 mg·mL-1), moderate but still significant zones of inhibition of 7.24 mm and 7.59 mm, respectively. The antibacterial activity remained relatively stable over the 5-day incubation period, indicating a sustained inhibitory effect of sucrose esters against Staphylococcus aureus. These results overall indicate that the enzymatically synthesised sucrose esters possess potent, dose-dependent, and stable antibacterial properties, with the optimal inhibitory concentration identified at 2 mg·mL-1. The antibacterial activity of SEs can be seen in Figure 7.

Figure 7. Appearance of the inhibition zone in Staphylococcus aureus
3.6 Application of SEs in coconut milk emulsion
Coconut milk is a natural food that is added to many dishes, cakes, and beverages. Commercial coconut milk is packaged in the liquid phase to facilitate its application. To maintain the quality of coconut milk so that it is not easily damaged, such as in emulsion destabilization, emulsifying compounds such as SEs are added.
3.6.1 Creaming index measurement
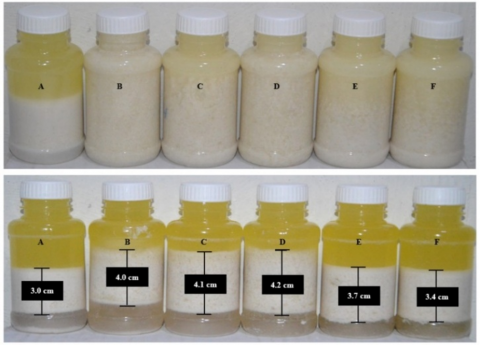
The emulsion system comprises coconut milk, cooking oil, and SEs as emulsifier agents. SEs are used to avoid emulsion destabilization, which leads to phase separation (creaming). Meanwhile, adding cooking oil enhances the dispersed phase and reduces the possibility of emulsion destabilization. Creaming is a physically observable deterioration in the appearance of an emulsion. The lower the creaming index value, the more stable the emulsion [37]. In this study, SEs variation was carried out from 0.2-1.0% (w/v) by the total volume of coconut milk and cooking oil. Visualization of coconut milk emulsion at various concentrations of SEs and without SEs (control) for 7 days of observation can be seen in Figure 8.
Figure 8. The appearance of coconut milk emulsion on application of optimal sucrose ester as an emulsifier (a) 5 minutes addition of sucrose ester, (b) after 7 days storage
The creaming index represents the amount of phase separation that occurs as a result of the concentration of SEs implemented in the emulsion system. The appropriate amount of SEs that can synergize with the emulsion system should be employed to avoid emulsion destabilization. Based on research results, Formulation D (SEs = 0.6% (w/v), coconut milk = 50 mL, cooking oil = 50 mL) had the lowest creaming index of 54.3%. The creaming index (Formulation D) increased from 51.1% on day 1 to 54.3% on day 7, representing an absolute increase of 3.2 percentage points, or approximately 6.26% relative to the initial value. Formulation F (SEs = 1.0% (w/v), coconut milk = 50 mL, cooking oil = 50 mL) had the highest creaming index at 63.0%. SEs in large quantities cannot be completely absorbed into the oil droplets or globules to form micelles that cause destabilization of the emulsion. Sensory attributes such as the aroma and color of coconut milk added with SEs for each variation did not change significantly despite 7 days of storage. In Formulation A, no SEs were added to the emulsion system and used as a control observation. In Formulation A, the separation between the oil and water phases occurred immediately after 5-10 min of observation. While in the coconut milk emulsion system, added with SEs, separation began to occur on days 3-4 of storage.
Previous studies reported that the application of Tween 20, 40, and 80 with a concentration of 0.6% (w/v) can maintain the stability of coconut milk emulsion for 7 days of storage at room temperature [38]. Further results were reported in research [39], which studied using SEs and Tween 60 in coconut milk emulsions with 5% fatty acid content. The results showed that the utilization of 0.25% (w/v) SEs for 2 h at 30℃ can maintain the stability of coconut milk emulsion better than Tween 80. In conclusion, SEs from CPKOME and sucrose, which are synthesized using CALB, have the same ability as Tween 20, 60, 80, and SEs (chemical synthesis) in their application to maintain coconut milk emulsion stability. The results of measuring the creaming index for 7 days of observation are shown in Table 8.
Table 8. Creaming index of coconut milk for 7 days of observation
|
Formulations (w/v) |
Creaming Index (%) |
||||||
|
1 |
2 |
3 |
4 |
5 |
6 |
7 |
|
|
A (0.0% SEs) |
65.2 |
65.2 |
66.3 |
66.3 |
66.3 |
67.4 |
67.4 |
|
B (0.2% SEs) |
54.3 |
54.3 |
54.3 |
54.3 |
55.4 |
55.4 |
56.5 |
|
C (0.4% SEs) |
54.3 |
54.3 |
54.3 |
54.3 |
54.3 |
55.4 |
55.4 |
|
D (0.6% SEs) |
51.1 |
52.2 |
52.2 |
53.3 |
53.3 |
54.3 |
54.3 |
|
E (0.8% SEs) |
56.5 |
56.5 |
57.6 |
57.6 |
58.7 |
58.7 |
59.8 |
|
F (1.0% SEs) |
60.9 |
62.0 |
62.0 |
62.0 |
62.0 |
62.0 |
63.0 |
3.6.2 pH measurement
During storage, the emulsion of coconut milk with the addition of SEs and control decreased. The control coconut milk emulsion experienced a significant decrease of 14.33%. While coconut milk emulsion with the addition of SEs experienced a decrease in pH, which was not much different for each formulation. The decrease in pH in Formulations A to F ranged from 12.09 to 13.07%. This condition shows that applying SEs to coconut milk emulsions in concentrations of 0.2-1.0% (w/v) affects pH. A significant decrease in pH in control coconut milk occurs due to protein breakdown during storage, forming alcohol and CO2, which causes the emulsion environment to become more acidic than before.
Based on the results of the study, the pH changes that occurred in all formulations were acceptable because they were still far from the isoelectric point of coconut milk protein at pH 4.5-3.5. In this condition, the protein in coconut milk is denatured. Furthermore, the coconut milk emulsion undergoes demulsification, which is characterized by the formation of flocs. Due to the interaction of attraction, the flocs gather to form agglomerates that look like solid lumps. The same study reported [38] that the use of SEs in coconut milk emulsions is effective in preventing demulsification. The SEs applied coconut milk emulsion did not experience a significant decrease in pH compared to the control emulsion. Changes in pH of coconut milk emulsion during 7 days of storage are shown in Table 9.
Table 9. pH change of coconut milk for 7-day observation
|
Formulations |
pH |
||||||
|
1 |
2 |
3 |
4 |
5 |
6 |
7 |
|
|
A (0.0% SEs) |
6.56(a) |
6.34(a) |
6.21(a) |
6.12(a) |
5.95(a) |
5.85(a) |
5.62(a) |
|
B (0.2% SEs) |
6.73(a) |
6.68(a) |
6.42(a) |
6.15(a) |
6.02(a) |
5.92(a) |
5.85(a) |
|
C (0.4% SEs) |
6.75(a) |
6.60(a) |
6.36(a) |
6.25(a) |
6.16(a) |
5.97(a) |
5.87(a) |
|
D (0.6% SEs) |
6.78(a) |
6.63(a) |
6.47(a) |
6.29(a) |
6.07(a) |
5.90(a) |
5.96(a) |
|
E (0.8% SEs) |
6.81(a) |
6.75(a) |
6.62(a) |
6.48(a) |
6.13(a) |
6.05(a) |
5.92(a) |
|
F (1.0% SEs) |
6.86(a) |
6.79(a) |
6.67(a) |
6.52(a) |
6.23(a) |
6.11(a) |
5.86(a) |
Note: Numbers followed by different letters in each column indicate a significant effect between the interaction of treatments at 5% Fisher Test, pooled standard deviation = 0.35.
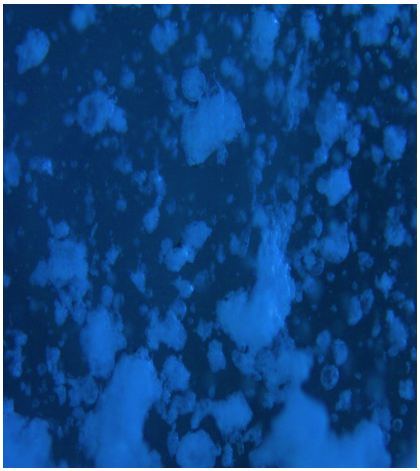
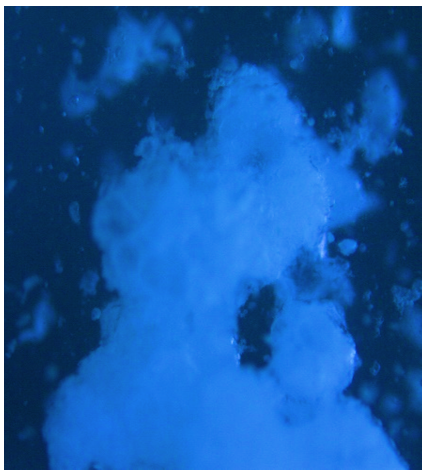
3.6.3 Distribution of droplets
The optimal concentration of stabilizer, water, and fat in the emulsion can be seen based on the surface of the droplets being completely coated by SEs, where the emulsifier concentration is not too low and not too high. The emulsifier molecules must quickly absorb and reduce the surface tension between coconut milk and cooking oil before phase separation occurs. When the concentration of emulsifying SEs in the emulsion system is too low, the surface of the droplets cannot be completely coated by the emulsifier [40]. The droplet dispersion appearance for coconut milk emulsion, analyzed using a trinocular Zen 2.5 microscope, is shown in Figure 9. The effectiveness of SEs as emulsifiers applied to coconut milk can be determined by microscopic observation through the appearance of droplet distribution. The smaller the droplet particle size, the more effective SEs are in stabilizing the emulsion system. This is related to the ability of SEs to produce small droplet sizes during the homogenization process and prevent droplet agglomeration. A smaller droplet size indicates that the attractive force between droplets is smaller, so the possibility of the emulsion system aggregating is also less. If the concentration of droplets is too much, a stiff and stacked layer of coconut milk may form, making it impenetrable to light. Observations were made for Formulations A, D, and F after 7 days of storage to determine any differences in droplet distribution in the samples with the highest and lowest creaming index. Formulation A was used as a control for the effectiveness of SEs as an emulsifying compound. Observations were made for Formulations A, D, and F after 7 days of storage to determine any differences in droplet distribution in the samples with the highest and lowest creaming index. Formulation A was used as a control for the effectiveness of SEs as an emulsifying compound. Based on the observation, a non-uniform distribution of droplets was obtained for the three samples. In Formulation A, the emulsion system did not even distribute droplets. Instead, a bunch of droplets were stiff and piled up to form a large agglomeration of fat globules. In Formulation D, smaller and evenly dispersed droplets were seen in the emulsion system. This droplet agglomeration forms smaller globules than Formulation A. The SE molecules bind to the oil phase and coat the droplets, forming a thin film that stabilizes the coconut milk emulsion. Formulation F showed smaller droplets than Formulation A, but covered the entire emulsion system. This indicates the saturation of the emulsion system. Even SEs added in large quantities no longer bind fat and lower the surface tension in the emulsion system. These SE compounds that do not bind fat are called free SE molecules that do not coat the surface of the globules, forming micelles that cause destabilization of the emulsion.
(a)
(b)
(c)
Figure 9. Micrograph of droplet dispersion on day 7 observation (500 µm) (a) Formulation A (SEs = 0.0%), (b) Formulation D (SEs = 0.6%), (c) Formulation F (SEs = 1.0%)
The synthesis, optimization, characterization, and functional assessment of the integrated findings result in the principal conclusions of this work.
[1] Smith, A., Nobmann, P., Henehan, G., Bourke, P., Dunne, J. (2008). Synthesis and antimicrobial evaluation of carbohydrate and polyhydroxylated non-carbohydrate fatty acid ester and ether derivatives. Carbohydrate Research, 343(15): 2557-2566. https://doi.org/10.1016/j.carres.2008.07.012
[2] Chen, J.Q., Hai, Y.W., Qing, C., Liang, M.Y., Banwell, M.G., Lan, P. (2023). The synthesis of certain fatty acid ester derivatives of trehalose and an investigation of their emulsifying properties and bioactivities. LWT, 187: 115369. https://doi.org/10.1016/j.lwt.2023.115369
[3] Kurniasih, E., Rahmi, R., Darusman, D., Supardan, M.D. (2023). Synthesis of sucrose ester through enzymatic esterification and stability analysis as food emulsifier. E3S Web Conference, 373: 04014. https://doi.org/10.1051/e3sconf/202337304014
[4] Zeng, D., Cai, Y., Liu, T., Huang, L., Liu, P., Zhao, M., Zhao, Q. (2020). Effect of sucrose ester S370 on interfacial layers and fat crystals network of whipped cream. Food Hydrocolloid, 113: 106541. https://doi.org/10.1016/j.foodhyd.2020.106541
[5] Szuts, A., Szabó-révész, P. (2012). Sucrose ester as natural surfactants in drug delivery system-A mini review. International Journal of Pharmacy, 433(1-2): 1-9. https://doi.org/10.1016/j.ijpharm.2012.04.076
[6] Choi, J., Nidetzky, B. (2022). Ionic liquid as dual-function catalyst and solvent for efficient synthesis of sucrose fatty acid esters. Molecular Catalysis, 526: 112371. https://doi.org/10.1016/j.mcat.2022.112371
[7] El-Naggar, M.E., Soliman, R.A., Morsy, O.M., Abdel-Aziz, M.S. (2020). Nanoemulsion of Capsicum fruit extract as an eco-friendly antimicrobial agent for production of medical bandages. Biocatalysis Agricultural Biotechnology, 23: 101516. https://doi.org/10.1016/j.bcab.2020.101516
[8] Zheng, Y., Zheng, M., Ma, Z., Xin, B., Guo, R., Xu, X. (2015). Sugar fatty acid esters. In Polar Lipids: Biology, Chemistry, and Technology, pp. 215-243. https://doi.org/10.1016/B978-1-63067-044-3.50012-1
[9] Vargas, J.A.M., Ortega, J.O., Metzker, G., Larrahondo, J.E., Boscolo, M. (2020). Natural sucrose esters: Perspectives on the chemical and physiological use of an under investigated chemical class of compounds. Phytochemistry, 177: 112433. https://doi.org/10.1016/j.phytochem.2020.112433
[10] Teng, Y., Stewart, S.G., Hai, Y.W., Li, X., Banwell, M.G., Lan, P. (2021). Sucrose fatty acid esters: Synthesis, emulsifying capacities, biological activities and structure-property profiles. Critical Reviews in Food Science and Nutrition, 61(19): 3297-3317.
[11] Ren, K., Lamsal, B.P. (2017). Synthesis of some glucose-fatty acid esters by lipase from Candida antarctica and their emulsion functions. Food Chemistry,214:556-563. http://dx.doi.org/10.1016/j.foodchem.2016.07.031
[12] Vargas, J.A.M., Ortega, J.O., dos Santos, M.B.C., Metzker, G., Gomes, E., Boscolo, M. (2020). A new synthetic methodology for pyridinic sucrose esters and their antibacterial effects against Gram-positive and Gram-negative strains. Carbohydrate Research, 489: 107957. https://doi.org/10.1016/j.carres.2020.107957
[13] Neta, N.S., Peres, A.M., Teixeira, J.A., Rodrigues, L.R. (2011). Maximization of fructose esters synthesis by response surface methodology. New Biotechnology, 28(4): 349-355. https://doi.org/10.1016/j.nbt.2011.02.007
[14] Enayati, M., Gong, Y., Goddard, J.M., Abbaspourrad, A. (2018). Synthesis and characterization of lactose fatty acid ester biosurfactants using free and immobilized lipases in organic solvents. Food Chemistry, 266: 508-513. https://doi.org/10.1016/j.foodchem.2018.06.051
[15] Ferrer, M., Cruces, M.A., Plou, F.J., Pastor, E., Fuentes, G., Bernabe, M., Parra, J.L., Ballesteros, A. (2000). Chemical versus enzymatic catalysis for the regioselective synthesis of sucrose esters of fatty acids. Studies in Surface Science Catalysis, 130: 509-514.
[16] Šabeder, S., Habulin, M., Knez, Ž. (2006). Lipase-catalyzed synthesis of fatty acid fructose esters. Journal of Food Engineering, 77(4): 880-886. https://doi.org/10.1016/j.jfoodeng.2005.08.016
[17] Ja’afaru, M.I, Abbas, T., Ajunwa, O.M., Olaifa, K. (2022). Characterization and statistical optimization of biosurfactant production using Bacillus subtilis isolated from automotive oil-contaminated soil in Yola, Nigeria. Scientific African, 17: e01357. https://doi.org/10.1016/j.sciaf.2022.e01357
[18] Adebajo, S.O., Bankole, P.O., Ojo, A.E., Ajibola, A.T., Ojesola, C.O., Akintokun, A.K. (2023). Synthesis of biosurfactants by bacterial cells: Heavy-metals tolerance and siderophores. Scientific African, 22: e01984. https://doi.org/10.1016/j.sciaf.2023.e01984
[19] MPOB. (2025). A compendium of test on palm oil product palm kernel product, fatty acid, food related, product and other. Malaysian Palm Oil Board.
[20] American Oil Chemist Society. (1998). Official Methodes and Recommended Practices of the AOCS. 6th ed. AOCS.
[21] IOPRI. (2004). Oil chemical physics testing work instruction. Indonesian Oil Palm Research Institute.
[22] Joint FAO/WHO Expert Committee on Food Additives. (2010). Compendium of Food Additive Scecifications. Food and Agriculture Organization of the United Nations, Rome.
[23] Tadros, T.F. (2009). Emulsion Science and Technology. Weinheim: Wiley-VCH Velag GmbH & Co.KgaA.
[24] Zhang, T., Ding, M., Wang, X., Zhong, J. (2020). Droplet and creaming stability of fish oil-loaded gelatin/surfactant-stabilized emulsions depends on both the adsorption ways of emulsifiers and the adjusted pH. Food Science and Human Wellness, 9(3): 280-288. https://doi.org/10.1016/j.fshw.2020.04.002
[25] Inprakhon, P., Wongthongdee, N., Amornsakchai, T., Pongtharankul, T., Sunintaboon, P., Wiemann, L.O., Durand, A., Sieber, V. (2017). Lipase-catalyzed synthesis of sucrose monoester: Increased productivity by combining enzyme pretreatment and non-aqueous biphasic medium. Journal of Biotechnology, 259: 182-190. https://doi.org/10.1016/j.jbiotec.2017.07.021
[26] Kurniasih, E., Pardi, P. (2019). Application of response surface methodology for biodiesel synthesis optimization through transesterification reaction using H-zeolite/KI heterogeneous catalyst. IOP Conference Series Material Science Engineering, 536(1): 012033. https://doi.org/10.1088/1757-899X/536/1/012033
[27] van Kempen, S.E., Boeriu, C.G., Schols, H.A., de Waard, P., van der Linden, E., Sagis, L.M. (2013). Novel surface-active oligofructose fatty acid mono-esters by enzymatic esterification. Food Chemistry, 138(2-3): 1884-1891. https://doi.org/10.1016/j.foodchem.2012.09.133
[28] Gumel, A.M., Annuar, M.S.M., Heidelberg, T., Chisti, Y. (2011). Lipase mediated synthesis of sugar fatty acid esters. Process Biochemistry, 46(11): 2079-2090. https://doi.org/10.1016/j.procbio.2011.07.021
[29] Lotti, M., Pleiss, J., Valero, F., Ferrer, P. (2015). Effects of methanol on lipases: Molecular, kinetic and process issues in the production of biodiesel. Biotechnology Journal, 10(1): 22-30. https://doi.org/10.1002/biot.201400158
[30] Shin, D.W., Mai, N.L., Bae, S.W., Koo, Y.M. (2019). Enhanced lipase-catalyzed synthesis of sugar fatty acid esters using supersaturated sugar solution in ionic liquids. Enzyme Microbial Technology, 126: 18-23. https://doi.org/10.1016/j.enzmictec.2019.03.004
[31] Sindhu, R., Shiburaj, S., Sabu, A., Fernandes, P., et al. (2021). Enzyme technology in food processing: recent developments and future prospects. Innovative Food Processing Technologies, 3: 191-215. https://doi.org/10.1016/B978-0-12-815781-7.00016-0
[32] Marathe, S.J., Shah, N.N., Singhal, R.S. (2020). Enzymatic synthesis of fatty acid esters of trehalose: Process optimization, characterization of the esters and evaluation of their bioactivities. Bioorganic Chemistry, 94: 103460. https://doi.org/10.1016/j.bioorg.2019.103460
[33] Ortiz, C., Ferreira, M.L., Barbosa, O., dos Santos, J.C.S., Rodrigues, R.C, Berenguer-Murcia Á., Briand, L.E., Fernandez-Lafuente, R. (2019). Novozyme 435: The “perfect” lipase immobilized biocatalyst? Catalysis Science and Technology, 9(10): 2380-2420. https://doi.org/10.1039/C9CY00415G
[34] Mehta, A., Guleria, S., Sharma, R., Gupta, R. (2021). The lipases and their applications with emphasis on food industry. In Microbial Biotechnology in Food and Health, pp. 143-164. https://doi.org/10.1016/B978-0-12-819813-1.00006-2
[35] Kurniasih, E., Rahmi., Darusman., Supardan, M.D. (2015). Optimization of medium-chain glycerides enzymatic synthesis from crude palm kernel oil and their anti-bacterial potential. International Journal of Design and Nature and Ecodynamic, 20(1): 123-135. https://doi.org/10.18280/ijdne.200114
[36] Ezekoye, V., Adinde, R., Ezekoye, D., Ofomatah, A. (2019). Syntheses and characterization of biodiesel from citrus sinensis seed oil. Scientific African, 6(e00217): 1-8. https://doi.org/10.1016/j.sciaf.2019.e00217
[37] Varka, E.M., Tsatsaroni, E., Xristoforidou, N., Darda, A.M. (2012). Stability study of O/W cosmteic emulsion using Rosmarinus officinalis amd Calendula officinalis extracts. Open Journal of Applied Sciences, 2(3): 139-145.
[38] Thirukumaran, R., Nimbkar, S., Mahalakshmi, L., Leena, M.M., Moses, J.A., Anandharamakrishnan, C. (2023). Impact of different emulsification techniques on the stability of coconut milk. Journal of Agriculture and Food Research, 12(5): 100608. https://doi.org/10.1016/j.jafr.2023.100608
[39] Ariyaprakai, S., Limpachoti, T., Pradipasena, P. (2013). Interfacial and emulsifying properties of sucrose ester in coconut milk emulsions in comparison with Tween. Food Hydrocolloid, 30(1): 358-367. https://doi.org/10.1016/j.foodhyd.2012.06.003
[40] Tipvarakamkoon, T. (2009). Material science properties of coconut milk, cheese and emulsion. Dissertation. Faculty III-Process Science, Technical University of Berlin.