Hanadi H. Zwain![]() | Alaa H. AbdUlameer*
| Alaa H. AbdUlameer*![]() | Fatima Muslim Hadi
| Fatima Muslim Hadi![]() | Tamar Maitham Al-Asedi
| Tamar Maitham Al-Asedi![]() | Haneen Fadhil
| Haneen Fadhil![]() | Raghda A. Naser
| Raghda A. Naser![]()
© 2025 The authors. This article is published by IIETA and is licensed under the CC BY 4.0 license (http://creativecommons.org/licenses/by/4.0/).
OPEN ACCESS
Three crucial stations, Kufa, Al-Abbasiya, and Al-Manathera, were used to monitor the water quality of the Euphrates River in Al-Najaf Governorate in 2023 and 2024. The following 14 critical components were assessed pH, dissolved oxygen (DO), nitrate (NO₃⁻), calcium (Ca²⁺), magnesium (Mg²⁺), total hardness (TH), potassium (K⁺), sodium (Na⁺), sulfate (SO₄²⁻), chloride (Cl⁻), total dissolved solids (TDS), electrical conductivity (EC), alkalinity (Alk), and turbidity (turbidity). The mean, standard deviation, maximum, and minimum values for each element were computed for each year. According to the statistics, in 2023, it was discovered that Al-Abbasiya had the greatest values for pH and dissolved oxygen, while Al-Manathera had the highest values for most elements. Kufa station has the lowest dissolved oxygen readings in 2024. Values for the water quality index (WQI) climbed from 81.4-101.6 in 2023 to 150.8-190.2 in 2024 across all stations when the weighted arithmetic index technique was used. This caused the water quality index at the Kufa and Abbasiya stations to drop from "good" to "poor," but Al-Manathera station continued to be categorized as poor by international standards. In order to preserve the river system and guarantee the sustainability of water resources, these findings highlight the urgent necessity for management actions.
The Euphrates River, Kufa, Al-Abbasiya, Al-Manathera, water quality index
Water is a critical resource that is essential for the maintenance of environmental equilibrium, economic development, and life. One of Iraq's major supplies of surface water, which is essential for industrial, agricultural, and residential use, is the Euphrates River. Nonetheless, escalating urban development, agricultural runoff, industrial effluents, and climate-induced pressures have progressively compromised the river's water quality, prompting apprehensions regarding its appropriateness for diverse applications. Water resource administration and environmental preservation depend on the use of physical and chemical indicators to monitor and evaluate water quality. Turbidity, alkalinity, electrical conductivity (EC), total dissolved solids (TDS), sodium, potassium, chloride, sulfate, total hardness, magnesium, calcium, nitrate, dissolved oxygen (DO), and acidity (pH) are some of these factors. Evaluating water quality has emerged as a critical focus in hydrological and environmental studies, particularly in semi-arid areas like Iraq, where rivers face escalating threats from anthropogenic activity. Several studies have evaluated the regional and temporal variability of water quality in the Euphrates River and other rivers in the region, using physicochemical indicators. River water quality is a critical issue that has garnered significant attention in environmental and engineering research, particularly in strategically important rivers such as the Euphrates. The water quality of the Euphrates River and other rivers has been investigated in several studies employing water quality indicators (WQIs) as well as chemical and biological analysis methods. Study [1] investigated the physical, chemical, and microbiological pollution of the Euphrates River waters between Hit and Fallujah, emphasizing the impact of human activities on water quality, particularly organic pollutants and heavy metals. Study [2] analyzed wastewater and its effects on the Euphrates River's water quality, describing the types of chemical and biological contaminants and how they contribute to the river's environmental deterioration. Study [3] utilized Geographic Information Systems (GIS) methodologies and water quality indicators to assess the water quality of the Al-Abbasiya River, highlighting the instruments' capacity to monitor and assess the state of the water with pinpoint accuracy in relation to its location. To make sure the water at Basra city's drinking stations meets all the necessary health criteria, research [4] tested it using chemical and physical factors. To determine the level of pollution and its effect on the aquatic environment, researchers [5, 6] in Iraq used the CCME water quality index and water quality indicators to do a thorough investigation of how phosphorus affected the Euphrates River's water quality. According to the research, phosphorus is a major contaminant that harms river ecosystems. As a bioindicator of environmental change along the Euphrates River in the Ramadi area, algal biodiversity was studied in relation to water quality [7]. In order to enhance the precision of ongoing water monitoring and assessment, a mathematical model was suggested by study [8] to examine the Euphrates River's water quality using field data collected from Diwaniyah. Internationally, a number of recent studies have shown how well the water quality index (WQI) evaluates river systems across various conditions and regions. As an example, research [9] used Geographic Information Systems (GIS) and WQI to compare the evaluation of temporal and spatial variations in surface water quality. They emphasized the significance of combining geospatial technologies with water indicators to track seasonal and local changes. In the same way, research [10] used the integrated water quality index (IWQI) in conjunction with GIS and multivariate statistical analysis (MSA) to identify pollution sources and geographical patterns of deteriorating water quality in Morocco's Oued El Oued basin. Researcher [11] evaluated the Nam River in Korea using the WQI in conjunction with many statistical techniques, demonstrating the index's capacity to streamline enormous datasets and identify important variables affecting water quality. These international studies demonstrate the WQI's significance on the globe and its adaptability to various hydrological regimes. Nevertheless, there is still a dearth of thorough research on the Euphrates River, especially that which incorporates chemical multiplicity and spatial and temporal comparisons with WQI classification, despite the large number of worldwide studies. This shortcoming draws attention to the necessity and originality of the current study, which offers a thorough evaluation of the water quality at three important locations in Al-Najaf Governorate (Kufa, Al-Abbasiya, and Al-Manathera) throughout a two-year period (2023–2024). Chemical and physical parameters allow for a more thorough and accurate evaluation of water quality than prior local studies that frequently relied on a limited range of parameters or shorter monitoring periods. Furthermore, new evidence of the slow decline in central Iraq's water quality is provided by the comparison of WQI values across stations and years, which is crucial for sustainable water resource planning and environmental management.
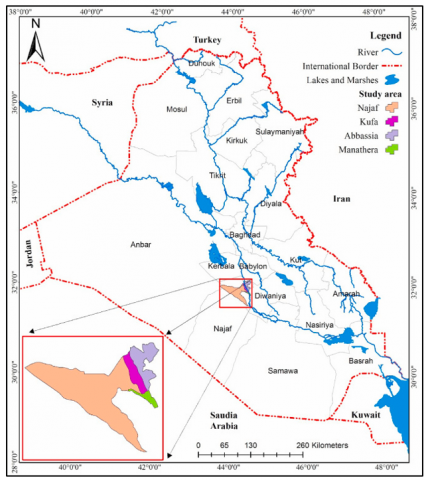
Al-Abbasiya, Al-Kufa, and Al-Manathera are the three stations along the Euphrates River in the central Iraqi Al-Najaf Governorate that are the subject of this study. The strategic hydrological significance of these sites and the different land use practices that impact water quality led to their selection. Al-Abbasiya, which is located in Najaf's northeast, is known for its thriving agricultural sector. The Station Modernizations (32°4'38.352''N, 44°27'5.687''E). In this area, river branches are essential for irrigation and may be impacted by household garbage and agricultural runoff. A major contributor to the provision of water for residential and municipal purposes is Al-Kufa, a heavily populated metropolitan region situated directly on the banks of the Euphrates River. However, there have been issues about the water quality at this station due to urbanization and wastewater discharge. This station is located on the Euphrates River - Shatt Al-Kufa near the Kufa Water Project at coordinates (32°2'21.875''N, 44°24'27.00"E). Southeast of Najaf is Al-Manathera, which blends rural and agricultural features. The station is located on the Euphrates River in the Al-Muncher district, 15 km south of the Najaf Governorate, near the Al-Muncher water project, with coordinates (31°54'24.948''N, 44°29'26.519''E). This location is crucial for assessing how mixed land use affects water chemistry because the Euphrates tributaries are utilized for irrigation, raising cattle, and a few other domestic tasks. A more thorough evaluation of the Euphrates River ecosystem in Najaf is made possible by the study's ability to measure spatial changes in water quality under various environmental stressors due to its geographical dispersion, as shown in Figure 1.
Figure 1. The location of the study area [12]
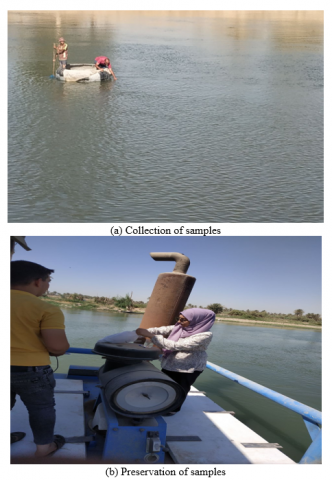
Over a two-year period (2023-2024), the water quality of the Euphrates River was quantitatively measured at three locations: Kufa, Al-Abbasiya, and Al-Manathera. In order to evaluate 14 critical physical and chemical parameters, including pH, turbidity, alkalinity, electrical conductivity (EC), total dissolved solids (TDS), chloride (Cl), sulphate (SO4), sodium (Na), potassium (K), total hardness (TH), magnesium (Mg), calcium (Ca), nitrate (NO3), and dissolved oxygen (DO), Over the course of two years (2023–2024), field monitoring was carried out twice a month (about every two weeks), yielding a total of 24 samples per station annually. Grab sampling was used to collect surface water samples at a depth of 20–30 cm in order to ensure the representativeness of the main stream water properties. Samples were taken at the center of the river, away from banks and places with slow flow or dense growth, in order to reduce spatial variance. Samples were put in sterile 1-liter plastic bottles as soon as they were collected. During transportation to the lab, samples for chemical analysis were kept in refrigerated cartons at 4℃. In order to prevent any changes in chemical composition before analysis, a few drops of nitric acid (HNO₃) were added to the samples for ion analysis (such as NO₃⁻ and SO₄²⁻) to stabilize them and bring their pH down to less than 2. To guarantee accuracy, all assays were completed within 48 hours after sample collection. Using Hanna Instruments equipment, the samples were analyzed using the following standard procedures in compliance with APHA's 2017 Standard Methods for the Examination of Water and Wastewater, which measure electrical conductivity (EC), pH, and total dissolved solids (TDS) using an EC/TDS/pH/T meter (Hanna Instruments). Turbidity is measured with a Hanna Instruments turbidimeter. Oxygen dissolved (DO) was measured using a Hanna Instruments DO meter. Using the spectroscopic methods and common chemical calibrations described in APHA, other elements such as nitrates (NO₃⁻), sulfates (SO₄²⁻), and chlorides (Cl⁻) were investigated. To ensure the accuracy of the results, several measurements were made, and the instruments were calibrated using the manufacturer's standard solutions before use.
The methodology for sampling from the watercourse is depicted in Figure 2. Before being compiled and organized in Microsoft Excel, this data underwent a series of procedures. The subsequent statistical methodologies were implemented: • The mean, standard deviation, minimum, and maximum values of each parameter for each station were included in the descriptive statistics. • Temporal analysis: Monthly and seasonal patterns were analyzed to discover changes over a two-year period. • Spatial comparison of stations.
Figure 2. Sampling from the river
3.1 Evaluation in relation to standards
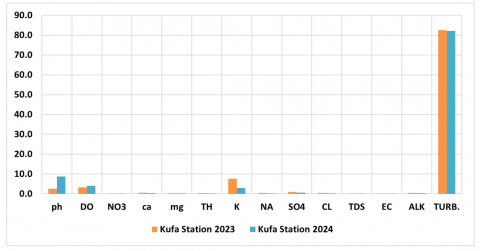
To evaluate the water quality for drinking and household use, each measured parameter was compared to the World Health Organization (WHO) [13]. Considerable temporal fluctuations were found when water quality data for 2023 and 2024 were analyzed at the Kufa station. From 7.12 in 2023 to 7.72 in 2024, pH readings rose, suggesting a move toward more alkaline circumstances. Dissolved oxygen (DO) decreased somewhat, which could be a result of variations in the water's organic content or temperature. A relative increase in water quality or a decrease in the pollutant load is shown by the lower average values of the majority of main ions and indicators of salinity and hardness, including calcium, magnesium, sodium, chloride, sulfate, total dissolved solids (TDS), and electrical conductivity (EC), in 2024. On the other hand, turbidity dramatically rose, which might be explained by more suspended particles or seasonal runoff. As demonstrated in Table 1, the minimum and maximum values over the course of the two years exhibit a great deal of variability, particularly in parameters like sodium, TDS, and turbidity, indicating the dynamic character of the station's water quality.
Table 1. The data of Kufa Station
|
Kufa Station |
|||||||
|
Elem. |
Mean (2023) |
St. Devi (2023) |
Mean (2024) |
St. Devi (2024) |
Min. (2023-2024) |
Max. (2023-2024) |
WHO |
|
pH |
7.12 |
0.21 |
7.72 |
0.32 |
6.62 |
8.55 |
6.5-8.5 |
|
DO |
13.64 |
1.78 |
12.34 |
1.90 |
9.1 |
16 |
5 mg/L |
|
NO3 |
5.99 |
1.69 |
5.30 |
1.14 |
3.295 |
9.63 |
50 mg/L |
|
Ca |
131.50 |
11.05 |
116.55 |
17.72 |
90 |
149.6 |
200 mg/L |
|
Mg |
34.20 |
8.23 |
30.03 |
2.78 |
21.715 |
47.09 |
100 mg/L |
|
TH |
469.33 |
42.28 |
416.00 |
44.97 |
343 |
553 |
500 mg/L |
|
K |
6.70 |
1.08 |
4.12 |
0.73 |
3.1 |
8.45 |
12 mg/L |
|
Na |
117.86 |
33.95 |
80.04 |
21.41 |
50.3 |
178.85 |
200 mg/L |
|
SO4 |
375.00 |
20.86 |
347.45 |
47.75 |
286 |
457.5 |
250 mg/L |
|
Cl |
186.17 |
24.68 |
151.73 |
17.27 |
123.5 |
245 |
250 mg/L |
|
TDS |
1073.9 |
75.89 |
892.18 |
77.94 |
786 |
1218 |
1000 mg/L |
|
EC |
1651.7 |
116.80 |
1381.0 |
111.43 |
1209 |
1873.5 |
1500 Ms/cm |
|
Alk. |
113.33 |
13.16 |
117.00 |
9.23 |
99 |
140 |
200 mg/L |
|
Turb |
12.50 |
4.61 |
21.14 |
11.82 |
4.99 |
40.7 |
5 NTU |
Table 2. The data of Al-Abbasiya Station
|
Al-Abbasiya Station |
|||||||
|
Elem. |
Mean (2023) |
St. Devi (2023) |
Mean (2024) |
St. Devi (2024) |
Min. (2023-2024) |
Max. (2023-2024) |
WHO |
|
pH |
7.30 |
0.23 |
7.80 |
0.29 |
6.72 |
8.40 |
6.5-8.5 |
|
DO |
14.71 |
2.10 |
13.15 |
2.05 |
9.90 |
17.80 |
5 mg/L |
|
NO3 |
5.88 |
2.08 |
5.16 |
1.12 |
2.90 |
10.36 |
50 mg/L |
|
Ca |
121.50 |
20.04 |
115.00 |
16.84 |
62.38 |
141.20 |
200 mg/L |
|
Mg |
32.21 |
8.59 |
30.74 |
3.71 |
21.04 |
45.86 |
100 mg/L |
|
TH |
432.04 |
74.95 |
413.42 |
45.27 |
204.52 |
508.00 |
500 mg/L |
|
K |
6.33 |
0.99 |
3.72 |
0.88 |
2.55 |
8.40 |
12 mg/L |
|
Na |
120.10 |
32.39 |
78.30 |
23.21 |
49.25 |
186.70 |
200 mg/L |
|
SO4 |
358.67 |
22.72 |
334.21 |
42.70 |
270.00 |
428.50 |
250 mg/L |
|
Cl |
185.38 |
23.14 |
150.71 |
16.97 |
123.50 |
235.00 |
250 mg/L |
|
TDS |
1029.42 |
51.74 |
871.33 |
73.48 |
760.00 |
1151.50 |
1000 mg/L |
|
EC |
1583.25 |
79.58 |
1340.08 |
113.09 |
1168.50 |
1771.00 |
1500 Ms/cm |
|
Alk. |
111.92 |
9.04 |
118.58 |
7.88 |
100.00 |
131.00 |
200 mg/L |
|
Turb |
10.58 |
6.03 |
26.99 |
20.94 |
3.50 |
83.40 |
5 NTU |
Table 3. The data of Al-Manathera Station
|
Al-Manathira Station |
|||||||
|
Elem. |
Mean (2023) |
St. Devi (2023) |
Mean (2024) |
St. Devi (2024) |
Min. (2023-2024) |
Max. (2023-2024) |
WHO |
|
pH |
7.10 |
0.22 |
7.75 |
0.24 |
6.65 |
8.25 |
6.5-8.5 |
|
DO |
12.78 |
2.18 |
12.15 |
2.07 |
7.85 |
15.70 |
5 mg/L |
|
NO3 |
6.83 |
2.55 |
6.43 |
1.02 |
2.97 |
11.94 |
50 mg/L |
|
Ca |
139.73 |
11.70 |
123.79 |
17.65 |
99.00 |
152.80 |
200 mg/L |
|
Mg |
35.17 |
7.49 |
32.65 |
5.00 |
23.40 |
47.09 |
100 mg/L |
|
TH |
493.50 |
31.19 |
442.75 |
52.97 |
348.00 |
547.00 |
500 mg/L |
|
K |
7.73 |
1.09 |
4.57 |
0.83 |
3.35 |
9.35 |
12 mg/L |
|
Na |
150.23 |
80.21 |
83.85 |
25.52 |
53.15 |
394.50 |
200 mg/L |
|
SO4 |
397.67 |
16.23 |
355.75 |
36.73 |
306.00 |
453.00 |
250 mg/L |
|
Cl |
200.00 |
28.47 |
158.38 |
21.10 |
117.00 |
254.00 |
250 mg/L |
|
TDS |
1120.1 |
70.46 |
926.38 |
85.45 |
773.00 |
1238.50 |
1000 mg/L |
|
EC |
1722.9 |
108.35 |
1425.1 |
131.42 |
1189.00 |
1905.00 |
1500 Ms/cm |
|
Alk. |
119.92 |
11.74 |
124.08 |
10.28 |
102.00 |
148.00 |
200 mg/L |
|
Turb |
13.37 |
6.95 |
24.58 |
18.49 |
4.22 |
70.95 |
5 NTU |
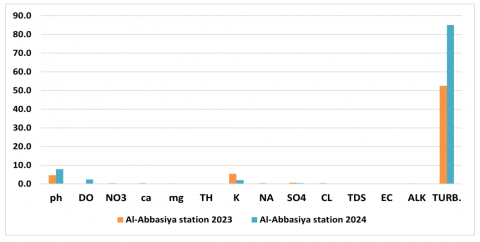
Similar patterns to Kufa were shown by the 2023 and 2024 water quality analyses at Al-Abbasiya station. A propensity toward alkalinity was indicated by the small increase in pH that was noted. A little decrease in dissolved oxygen levels may have been brought about by warmer temperatures or more biological activity. In comparison to 2023, parameters including EC, TDS, calcium, and salt displayed lower averages in 2024, which may indicate a dilution effect or less pollution. As shown in Table 2, turbidity rose in the meantime, indicating a higher concentration of suspended particles in the latter part of the year. Significant variability was found in the range between the lowest and greatest readings in both years, especially in turbidity, salt, and sulfate, indicating cyclical variations in the station's water quality.
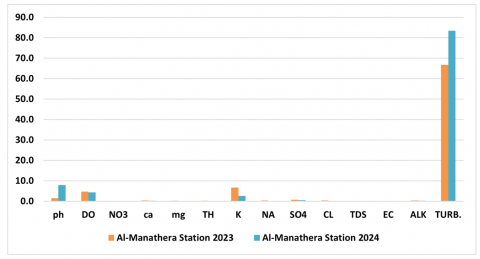
Consistent patterns with the other two stations were found in the investigation of Al-Manathera station. Between 2023 and 2024, the dissolved oxygen levels decreased, and the pH values gradually rose. Calcium, sodium, chloride, and EC were among the ions with decreased average concentrations in 2024, which may indicate less seasonal volatility or anthropogenic impact. Nevertheless, there was an increase in turbidity levels, which may suggest an increase in surface discharge or an agricultural effect. Table 3 illustrates the significance of consistent evaluations to document changes in water quality over time, as a number of indicators exhibited variability over the two-year period. The standard deviation quantifies variations in values in relation to the arithmetic mean. This metric shows how stable or unstable the water quality has been throughout the years. The results show that in 2023, the components tested at the Kufa station had standard deviations ranging from 0.21 for pH (relative stability in acidity) to 116.80 for electrical conductivity (EC). Seasonal changes and human-caused variables, such as farming and industry, cause dissolved salt and mineral concentrations to fluctuate significantly, as this indicates. Both of those stations are covered by this as well.
3.2 Water quality index (WQI) calculation
A popular technique for evaluating the quality of water is to compute the water quality index (WQI), which aggregates several physical and chemical components into a single numerical value that reflects the general state of the water. This is accomplished by multiplying each element's relative value (Qi) by the relative weight (Wi) of each factor. Standard (such as WHO or Iraqi requirements) and the relationship described below are used to determine the weights. Several earlier studies have employed this methodology, including a study [14], which demonstrated that turbidity and dissolved oxygen were the primary determinants of the WQI value and hence important markers of declining water quality.
All of the stations had their water quality index (WQI) calculated using a weighted calculation method according to the WHO-recommended standard values. Water is categorized as acceptable for human consumption or unsuitable based on its purity, which is summarized in this index. Table 4 shows how we used a classification scheme developed by study [2] to better understand the water quality at the sites that were studied.
Table 4. Water quality classification based on WQI
|
WQI |
Water Class |
|
Less than 50 |
Excellent |
|
50.1-100 |
Good |
|
100.1-200 |
Poor |
|
200.1-300 |
Very poor |
|
More than 300.1 |
Unfit |
The Weighted Arithmetic Index Method was used to determine the water quality index (WQI) using the formula below, Eq. (1):
$W Q I=\frac{\sum_{i=1}^n W_i Q_i}{\sum_{i=1}^n W_i}$ (1)
pH, DO, NO3, Ca, Mg, TH, Na, SO4, Cl, TDS, EC, Alk., and Turbidity were among the chosen parameters. Wi (weights) were determined as shown in Eq. (2). Using WHO (2022) guidelines, the relative significance of each parameter to public health and water consumption was determined. The following equation was used:
$W_i=\frac{K}{s_i}$ (2)
where,
Si = standard acceptable limits.
K = a constant that ensures the weights add up to 1.
Since a parameter has a stronger influence on health and water quality, its weight increases with a lower standard limit (for example, nitrate, turbidity, or dissolved oxygen).
Qi was determined by applying the relationship in Eq. (3):
$Q_i=\frac{\left(V_i-V_{\text {ideal }}\right)}{\left(S_i-V_{\text {ideal }}\right)}$ (3)
Si is the standard limit (WHO or Iraqi standards), Vi is the measured value, and Videal is the ideal value (7 for pH, 0 for other parameters). The standard value for dissolved oxygen in water is 5, and the ideal value is 14.6 [15, 16]. Because it is the most often used model in both regional and international research, the Weighted Arithmetic Index was utilized.
in order to identify the factors that had the greatest influence on the water quality index value, the following formulas, Eqs. (4) and (5) were used to calculate the contribution percentage of each element:
$contribution_i=Q_i \times W_i$ (4)
$percentage_i=\frac{\text { contribution }_i}{\sum Q_i \times W_i} \times 100$ (5)
In this case, Wᵢ is the element's relative weight, and Qᵢ is its quality value. The components that most contribute to the deterioration of water quality can be found using this method.
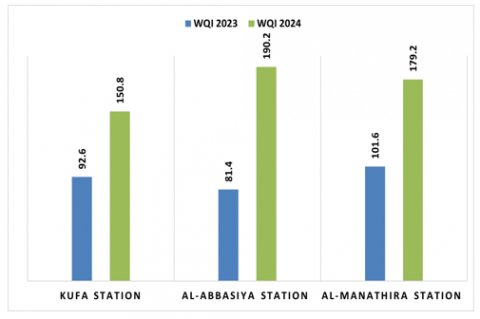
Kufa, Al-Abbasiya, were all evaluated as "good" in 2023 and " poor" in 2024, according to the results of these ratings. Al-Manathera, on the other hand, had higher values but was still categorized as “poor”, as depicted in Figure 3. This drop, which shows a significant deterioration in water quality, might be caused by human influence on riverbanks, reduced river flow, or increasing pollutant loads, as shown in Table 5. These results show that the area needs better water use and pollution control.
Figure 3. The WQI of the stations
Table 5. The results of the WQI for the stations
|
Station |
WQI 2023 |
Class |
WQI 2024 |
Class |
|
Kufa |
92.6 |
good |
150.8 |
poor |
|
Al-Abbasiyah |
81.4 |
good |
190.2 |
poor |
|
Al-Manathera |
101.6 |
poor |
179.2 |
poor |
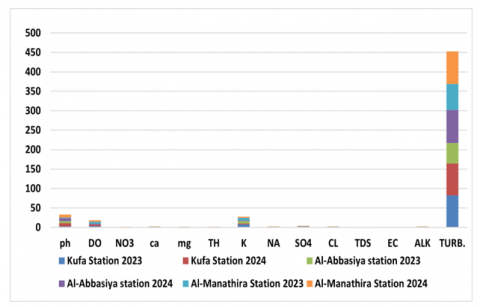
The results of the contribution study indicated that, when compared to the other factors, turbidity had the greatest impact on the water quality index (WQI) value across all stations.
Increased silt and suspended matter in the river are reflected in high turbidity. Untreated household and industrial waste, dirt-laden surface runoff, or ineffective sedimentation at treatment facilities could all be the cause. Similar research on the Tigris and Euphrates rivers has shown that turbidity is frequently the main cause of declining WQI, which is in line with this finding [17].
Figure 4. Rate of contribution of water quality parameters to the WQI
According to Figure 4, DO and turbidity have the largest effective weights (about 30% each), followed by pH (19%) and K (13%). The remaining components have a very small (<1%) impact.
Figures A1-A3 in the Appendix show how the primary components affect each station's water quality index (WQI). The Kufa station is depicted in Figure A1, Al-Abbasiya station in Figure A2, and Al-Manathera station in Figure A3. Turbidity had the greatest effect on WQI values at all sites, followed by pH and potassium (K), with dissolved oxygen (DO) having the least effect.
4.1 Spatial comparison of stations
Substantial disparities were observed among the three stations in a spatial analysis of the maximum and minimum values of the water quality parameter in 2023 and 2024. Al-Abbasiya displayed the highest levels of pH and dissolved oxygen, suggesting that human activity has had less of an effect on the nearby river segment than the other two stations. Conversely, the lowest values for a variety of parameters, including NO₃⁻, Ca²⁺, Mg²⁺, TH, K⁺, SO₄²⁻, Cl⁻, TDS, EC, alkalinity, and turbidity, were recorded in 2023. However, with the exception of dissolved oxygen, pH, and turbidity in 2024, according to a spatial comparison, Al-Manathera station had the highest WQI values over the course of the two study years. Its position downstream, where it receives pollution accumulation from the upstream stations (Kufa and Abbasiya), explains this. The Euphrates in Diwaniyah has a persistent decline in the WQI index, according to study [18], with salinity (EC, TDS) and sulfate ions SO₄ being the main pollutants. This is consistent with the findings around Al-Manathera and Al-Abbasiya.
In the meantime, the Kufa station recorded the lowest values for pH, Mg²⁺, alkalinity, and turbidity in 2024, as well as the lowest value for Na⁺ in 2023. These variations demonstrated how local environmental factors, human activity, and possible pollution sources have varying effects on each station and as shown in Table 6.
Table 6. Comparison between stations
|
Elem. |
High. Station (2023) |
Low. Station (2023) |
High. Station (2024) |
Low. Station (2024) |
|
pH |
Al-Abbasiya (7.30) |
Al-Manathira (7.10) |
Al-Abbasiya (7.80) |
kufa (7.72) |
|
DO |
Al-Abbasiya (14.71) |
Al-Manathira (12.78) |
Al-Abbasiya (13.15) |
Al-Manathira (12.15) |
|
NO3 |
Al-Manathira (6.83) |
Al-Abbasiya (5.88) |
Al-Manathira (6.43) |
Al-Abbasiya (5.16) |
|
Ca |
Al-Manathira (139.73) |
Al-Abbasiya (121.50) |
Al-Manathira (123.79) |
Al-Abbasiya (115.00) |
|
Mg |
Al-Manathira (35.17) |
Al-Abbasiya (32.21) |
Al-Manathira (32.65) |
kufa(30.03) |
|
TH |
Al-Manathira (493.50) |
Al-Abbasiya (432.04) |
Al-Manathira (442.75) |
Al-Abbasiya (413.42) |
|
K |
Al-Manathira (7.73) |
Al-Abbasiya (6.33) |
Al-Manathira (4.57) |
Al-Abbasiya (3.72) |
|
Na |
Al-Manathira (150.23) |
kufa (117.86) |
Al-Manathira (83.85) |
Al-Abbasiya (78.30) |
|
SO4 |
Al-Manathira (397.67) |
Al-Abbasiya (358.67) |
Al-Manathira (355.75) |
Al-Abbasiya (334.21) |
|
CL |
Al-Manathira (200.00) |
Al-Abbasiya (185.38) |
Al-Manathira (158.38) |
Al-Abbasiya (150.71) |
|
TDS |
Al-Manathira (1120.13) |
Al-Abbasiya (1029.42) |
Al-Manathira (926.38) |
Al-Abbasiya (871.33) |
|
EC |
Al-Manathira (1722.92) |
Al-Abbasiya (1583.25) |
Al-Manathira (1425.17) |
Al-Abbasiya (1340.08) |
|
Alk. |
Al-Manathira (119.92) |
Al-Abbasiya (111.92) |
Al-Manathira (124.08) |
kufa (117.00) |
|
Turb |
Al-Manathira (13.37) |
Al-Abbasiya (10.58) |
Al-Abbasiya (26.99) |
Kufa (21.14) |
Increased pollutants from household and agricultural discharges, along with lower dissolved oxygen (DO) levels brought on by microbial activity and the consumption of organic matter, are the main causes of these high values. For instance, in addition to greater summer temperatures, which lower oxygen solubility in water, the observed decline in DO at the Kufa station in 2024 can be ascribed to an increase in organic waste from metropolitan areas.
The results of the research are in agreement with those of researcher [18], who found that the rise in dissolved salts and inorganic pollutants caused the Euphrates River's water quality index to deteriorate during a brief period of time. Regional research, such as study [11], which found a drop in DO as an indicator of organic pollution, and study [10], which showed that dissolved salts and sulfates are the most important determinants in water quality deterioration, also supports this. These comparisons support the validity of our findings and demonstrate that the Euphrates River's condition in Najaf is not an anomaly but rather a component of a larger pattern of river deterioration brought on by human activity.
As a result of receiving wastewater from the upstream Kufa and Al-Abbasiya stations, the results indicated that the downstream Al-Manathera station recorded the highest values for the majority of constituents. This can be explained by the pollutant accumulation effect (PAE). The total pollution load rises as it moves downstream due to the accumulation of domestic discharges (sewage) and agricultural discharges (return water containing fertilizers and pesticides). This aligns with existing knowledge regarding the characteristics of rivers in regions with high levels of human activity. This phenomenon (PAE), which occurs when pollutants are continuously added to the water and are not effectively managed, causes them to accumulate over time in the aquatic environment, explains the ongoing decline in water quality between 2023 and 2024. According to study [19], the accumulation is not restricted to the water column alone; it also includes sediments and suspended particles, which serve as holding tanks for contaminants before releasing them back into the water over time. The conclusions of study [20] regarding the cumulative effect of contaminants in aquatic systems are supported by the results presented above. The declining water quality index (WQI) readings at the stations under study so clearly demonstrate this cumulative impact of contaminants, necessitating the creation of comprehensive long-term pollution control plans.
WQI values increased at all locations between 2023 and 2024, indicating an overall decline in water quality. There are a number of reasons behind this. The human factor, as increased agricultural activity and the increased use of chemical fertilizers resulted in higher concentrations of nitrates and phosphates; the climatic factor, as low rainfall in 2024 decreased the river's natural dilution capacity, increasing the concentration of dissolved elements; and the urban factor, which directly led to the decline in water quality due to urbanization and the rise in untreated household wastewater. This supports the need for efficient management strategies to lower pollution and enhance integrated water management by suggesting that the decline in water quality was not random but rather the consequence of an overlap of human (agriculture and sanitation) and natural (climate) factors.
Field investigations revealed significant turbidity and sulfate (SO₄²⁻) levels at all locations in both years, exceeding the WHO. Meanwhile, total dissolved solids (TDS) and electrical conductivity (EC) surpassed allowed limits in 2023 before reverting to normal levels in 2024. All three locations reported high dissolved oxygen (DO) concentrations of over 5 mg/L, with only minor variations between the two years.
According to the research, the Euphrates River's water quality at the Kufa, Al-Abbasiya, and Al-Manathera stations substantially declined between 2023 and 2024, with the water quality index (WQI) increasing.
Nevertheless, this study has a number of important shortcomings, chief among them being:
1. Absence of integration of climate and hydrological data (temperature, precipitation, and runoff rates), which may directly affect changes in reported values.
2. Both organic and heavy pollutants—such as pesticides and petroleum compounds—that were crucial in assessing the quality of the water—such as lead, cadmium, and mercury—were not measured.
3. It is challenging to track long-term changes because of the very short time frame (only two years).
The results indicate the necessity of regularly monitoring turbidity and sulphate levels and addressing their potential sources, such as surface runoff, agricultural, and industrial activities, since these are significant contributors to the deterioration of the water quality index. Further study is recommended to identify the sources of contamination and develop treatment strategies to improve water quality ratings at all stations.
|
St. Devi |
Standard deviation |
|
Min. |
Minimum |
|
Max. |
Maximum |
|
Wi |
Weight of the element |
|
Si |
Standard acceptable limits |
|
K |
A constant that ensures the weights add up to 1 |
|
Vi |
Measured value |
|
Videal |
Ideal value (7 for pH, 0 for other parameters) |
|
PAE |
pollutant accumulation effect |
[1] Saod, W.M., Awad, S.S., Mokadem, K. (2021). Assessment of some physico-chemical and microbial pollutants in the water of the Euphrates River between the cities of Hit and Fallujah in Iraq. Desalination and Water Treatment, 211: 331-337. https://doi.org/10.5004/dwt.2021.26526
[2] Hussein, A.J., Al-Darraji, M.N., Rasheed, M., Sarhan, M.A. (2023). A study of the characteristics of wastewater on the Euphrates River in Iraq. IOP Conference Series: Earth and Environmental Science, 1262(2): 022005. https://doi.org/10.1088/1755-1315/1262/2/022005
[3] Al Yousif, M.A., Chabuk, A. (2023). Assessment of the Al-Abbasiyah River (Iraq) water quality for drinking purposes using the water quality index and GIS Software. Journal of Ecological Engineering, 24(8): 157-174. https://doi.org/10.12911/22998993/166396
[4] Al-Imarah, F.J.M., Al-Anbar, L.J.M., Essa, A.M., Mohammad, I.K., Aymen, Gahzi, F. (2017). Assessment of water quality for drinking water supplies plants at Basrah, Iraq. In The Fifth Scientific Conference of the College of Science University of Kerbala, pp. 187-198. https://www.researchgate.net/publication/325216992.
[5] Abbood, D.W., Gubash, K.R., Abbood, H.H. (2014). Evaluation of water quality index in the Main Drain River in Iraq by application of CCME water quality. Evaluation, 6(8): 19-23.
[6] Al-Heety, E.A.M., Turki, A.M., Al-Othman, E.M.A. (2011). Assessment of the water quality index of Euphrates River between Heet and Ramadi cities, Iraq. International Journal of Basic & Applied Sciences IJBAS-IJENS, 11(6): 38.
[7] Sharqi, M.M., Al-Tamimi, A.N.A., Hassan, O.M. (2024). Evaluation of Euphrates River water quality on phytoplankton biodiversity in Ramadi, Iraq. Borneo Journal of Resource Science and Technology, 14(2): 19-30. https://doi.org/10.33736/bjrst.6858.2024
[8] Ali, S.M., Shamkhi, M.S., Al-Ridah, Z.A. (2025). Anthropogenic and climate change impacts on Diwaniya River water quality. International Journal of Computational and Experimental Science and Engineering, 11(2): 2423-2435. https://doi.org/10.22399/ijcesen.1537
[9] Rai, S.P., Sharma, N., Lohani, A.K. (2019). Novel approach for issues identification in transboundary water management using fuzzy c-means clustering. Applied Water Science, 9(1): 11. https://doi.org/10.1007/s13201-018-0889-1
[10] Azhari, H.E., Cherif, E.K., Sarti, O., Azzirgue, E.M., Dakak, H., Yachou, H., da Silva, J.C.G.E., Salmoun, F. (2022). Assessment of surface water quality using the water quality index (IWQ), multivariate statistical analysis (MSA) and geographic information system (GIS) in Oued Laou Mediterranean Watershed, Morocco. Water, 15(1): 130. https://doi.org/10.3390/w15010130
[11] Kwon, H.G., Jo, C.D. (2023). Water quality assessment of the Nam River, Korea, using multivariate statistical analysis and WQI. International Journal of Environmental Science and Technology, 20(3): 2487-2502. https://doi.org/10.1007/s13762-023-04756-5
[12] Kareem, S.L., Jaber, W.S., Al-Maliki, L.A., Al-husseiny, R.A., Al-Mamoori, S.K., Alansari, N. (2021). Water quality assessment and phosphorus effect using water quality indices: Euphrates River-Iraq as a case study. Groundwater for Sustainable Development, 14: 100630. https://doi.org/10.1016/j.gsd.2021.100630
[13] Kassir, M.G., Dawood, L.M., Fuad, F. (2015). Quality assurance for Iraqi bottled water specifications. Journal of Engineering, 21(10): 114-132. https://doi.org/10.31026/j.eng.2015.10.08
[14] Al Chalabi, A.S., Naeem, S.M., Alkhafaji, R.J. (2023). Water Quality Index (WQI) for main water treatment plants in Basra City, Iraq. International Journal of Design & Nature and Ecodynamics, 18(6): 1407-1416. https://doi.org/10.18280/ijdne.180614
[15] Ramakrishnaiah, C.R., Sadashivaiah, C., Ranganna, G. (2009). Assessment of water quality index for the groundwater in Tumkur Taluk, Karnataka State, India. Journal of Chemistry, 6(2): 523-530. https://doi.org/10.1155/2009/757424
[16] Siriwardhana, K.D., Jayaneththi, D.I., Herath, R.D., Makumbura, R.K., Jayasinghe, H., Gunathilake, M.B., Azamathulla, H.M., Tota-Maharaj, K., Rathnayake, U. (2023). A simplified equation for calculating the water quality index (WQI), Kalu River, Sri Lanka. Sustainability, 15(15): 12012. https://doi.org/10.3390/su151512012
[17] Al Sharifi, S.R., Zwain, H.H., Hasan, Z.K. (2024). Evaluating surface water quality of Euphrates River in Al-Najaf Al-Ashraf, Iraq with water quality index (WQI). Engineering, Technology & Applied Science Research, 14(4): 15022-15026. https://doi.org/10.48084/etasr.7681
[18] Al-Khuzaie, M.M., Abdul Maulud, K.N., Wan Mohtar, W.H.M., Yaseen, Z.M. (2025). Modelling Euphrates River water quality index based on field measured data in Al-Diwaniyah City, Iraq. Scientific Reports, 15(1): 51. https://doi.org/10.1038/s41598-024-84072-1
[19] Iordache, A.M., Nechita, C., Zgavarogea, R., Voica, C., Varlam, M., Ionete, R.E. (2022). Accumulation and ecotoxicological risk assessment of heavy metals in surface sediments of the Olt River, Romania. Scientific Reports, 12(1): 880. https://doi.org/10.1038/s41598-022-04865-0
[20] Zhang, Z., Li, J., Li, Y., Wang, D., Zhang, J., Zhao, L. (2021). Assessment on the cumulative effect of pollutants and the evolution of micro-ecosystems in bioretention systems with different media. Ecotoxicology and Environmental Safety, 228: 112957. https://doi.org/10.1016/j.ecoenv.2021.112957