Mustaqimah Mustaqimah*![]() | Sri Hartuti
| Sri Hartuti![]() | Safrizal Safrizal
| Safrizal Safrizal![]() | Agus Arip Munawar
| Agus Arip Munawar![]() | Aris Munandar
| Aris Munandar![]()
© 2025 The authors. This article is published by IIETA and is licensed under the CC BY 4.0 license (http://creativecommons.org/licenses/by/4.0/).
OPEN ACCESS
Palm oil mill effluent (POME) contains elevated levels of total suspended solids and organic matter. However, improper disposal of POME, which contains oil, grease, and sludge, can cause ecological damage and pose risks to human health due to its toxic, carcinogenic, and polluting properties. This study aimed to develop a predictive model for pollutant load levels in POME, river water, and irrigation water using near-infrared spectroscopy (NIRS) combined with partial least squares (PLS) analysis. NIR spectral data were collected from 90 samples within the wavelength range of 1000–2500 nm using the FT-NIR Thermo Nicolet AntarisTM II instrument. Pretreatments applied included mean normalization (MN), standard normal variate (SNV), de-trending (DT), and peak normalization (PN). The multivariate analysis was performed using Unscrambler X 10.3 software. Model reliability was assessed using residual predictive deviation (RPD) and range error ratio (RER) as statistical measures for the analysis of chemical oxygen demand (COD), biochemical oxygen demand (BOD), and total suspended solids (TSS). The results showed that the PLS-DT model provided the best results for predicting COD, BOD, and TSS levels in POME, river water, and irrigation water. Predictions of COD, BOD, and TSS levels achieved RPD and RER values of 2.80 and 5.27, 2.89 and 6.05, and 2.05 and 5.39, respectively. Based on the RPD values, the prediction performance for COD and BOD falls into the excellent prediction accuracy category, whereas TSS falls into the coarse quantitative prediction category. RER shows that the prediction model has low to moderate practical utility. These results indicate that NIRS combined with chemometrics can be employed to rapidly and simultaneously predict pollution parameters such as COD, BOD, and TSS. This study improves our knowledge of the pollution load related to the palm oil sector and shows how NIRS and PLS may be used together to monitor the environment effectively and economically. These results encourage initiatives for sustainable environmental management and conservation and advance agriculture and environmental engineering methods.
POME, pollutants, NIRS, PLS, pretreatment spectrum
Oil palm (Elaeis guineensis Jacq.) is a highly valuable crop that grows in tropical areas. As a source of crude oil, it can be utilized for human consumption and as a raw material for biodiesel production [1]. As a significant product for emerging nations in Southeast Asia, particularly Indonesia and Malaysia, palm oil represents 86% of global production. To meet global demand, producers are increasing their overall production [2]. In addition to producing oil, the palm oil processing generates a significant amount of waste. There exist two categories of waste generated by palm oil mills, specifically solid and liquid waste. POME constitutes the most significant waste among all kinds produced by palm oil mills. The generation of one ton of crude palm oil generally necessitates approximately 5-7.5 tons of water, with over half of it ending up as waste [1]. This causes a large volume of waste to be dumped into water bodies [3].
POME is brown in color and contains a large amount of dissolved organic matter, which can damage the environment. The color of the waste can inhibit photosynthesis and have adverse effects [3]. Based on the literature review, it was reported that POME contains biochemical oxygen demand (BOD) and chemical oxygen demand (COD) levels of 17,000–26,700 mg/L and 42,900–88,250 mg/L [4]. POME is highly polluting and acidic due to its high pollutant load. POME is considered one of the major pollutants impacting waterways. Uncontrolled waste entering waters can have many negative effects [5], especially in sea and river water sources, which then cause environmental problems for the community [6]. POME has a significant potential to pollute the river and irrigation water systems.
Before POME is released into the environment, analysis of pollutant load levels must be carried out to ensure that it meets the required quality standards. It is in line with strict regulations on waste disposal standards and the emphasis on sustainable development [7]. In Indonesia, POME quality standards refer to the Regulation of the Minister of Environment of the Republic of Indonesia Number 5 of 2014 [8]. Meanwhile, water quality standards refer to the Regulation of the Indonesian Government Number 22 of 2021 [9].
So far, POME analysis has been carried out using gas chromatography-mass spectrometry (GC-MS). The use of GC-MS requires a lot of money and takes a long time. Therefore, it is necessary to explore alternative methods that are more cost-effective and provide faster analysis. In recent years, many new methods have been developed to analyze the quality of the environment, agriculture, and food materials [10, 11]. The method is near infrared reflectance spectroscopy (NIRS), which has several advantages such as low analysis costs, fast analysis time, no chemicals, easy sample preparation, no product damage, and the ability to analyze several ingredients in the material simultaneously [12, 13]. NIRS represents a category of vibrational spectroscopy conducted within the wavelength spectrum ranging from 750 to 2,500 nm (13,333 to 4,000 cm-1) [14].
Some related studies that have been conducted include: prediction of N, P, and K levels in soil [15, 16]; development and performance evaluation of in-situ total soil nitrogen [17]; detection of microplastics in soil [18]; prediction of cadmium in soil [19]; protein and fiber prediction in dry land [20]; assessment of soil properties in the Caucasus Mountains [21]; and estimation of soil organic matter [22].
Although NIRS has been frequently used to predict various contaminants from the natural product processing industry, few studies have focused on measuring liquid waste levels from the palm oil industry in rivers and surrounding rice fields. Understanding this issue is crucial to ensuring the sustainable use of natural resources, water bodies, and rice fields [23].
Based on the review of previous studies, research on using NIRS to estimate pollutant load levels in POME, river water, and irrigation water remains underdeveloped and holds significant potential for advancement. Therefore, in this study, the NIRS method combined with the partial least squares (PLS) calibration method was used to create a prediction model for the level of pollutant load in POME, river water, and irrigation water.
2.1 Sample preparation
The research samples were collected from Nagan Raya Regency, Aceh Province, Indonesia. A total of 90 samples were collected during the dry season, with approximately 500 mL of water per sample. The samples consisted of 30 POME samples, 30 river water samples collected near palm oil mills, and 30 irrigation water samples collected near palm oil mills. POME samples were collected at one of the palm oil mills from 5 wastewater ponds. These samples were subsequently diluted with distilled water to create 30 samples with varying concentrations. Meanwhile, river water samples were collected from three rivers, namely Krueng Trang, Krueng Tadu, and Krueng Seumayam. These rivers serve as POME discharge outlets and have been reported to experience pollution incidents on several occasions. Meanwhile, irrigation water was taken from Kuala, Tadu Raya, and Darul Makmur Districts. These three paddy fields are located near palm oil plantations and mills, making them susceptible to potential pollution. River water and irrigation water samples were collected approximately 100 meters from the respective pollution sources.
2.2 Laboratory analysis
Laboratory analysis was conducted on COD, BOD, and TSS parameters. COD, BOD, and TSS analyses were conducted at the Chemical Laboratory, Department of Chemistry, FMIPA, Syiah Kuala University, Banda Aceh. The results of this laboratory analysis were used as training data or reference data.
2.3 Spectrum data acquisition
The FT-NIR Thermo Nicolet Antaris TM II infrared spectroscopy instrument was utilized to secure range information, combined with Integrated Thermo Operation® software. The instrument was set with 32 scans to collect the diffuse reflectance spectrum of the sample. Then save the scan results in .SPA and .CSV file formats [24, 25]. Sampling is prepared by placing the sample (10-20 mL) in a bottle that has been manually homogenized, and then closing the sensor for the scanning process [11].
2.4 Spectrum pretreatment method
The estimation model becomes less accurate because NIRS reflectance spectrum data often contains noise and background. The scattering and absorption properties of a material affect this. Appropriate range pretreatment techniques can help minimize or even completely remove interference during processing. The purpose of spectrum pretreatment is to enhance spectrum quality and reduce or eliminate adverse effects on spectrum data. Without altering the spectroscopic data needed for estimation, this is accomplished. Spectrum pretreatment is used prior to calibration and validation [26]. The spectrum pretreatment methods used are mean normalization (MN), standard normal variate (SNV), de-trending (DT), and peak normalization (PN).
MN is a method that aims to scale the sample in order to obtain all data at approximately the same scale based on area, mean, median, maximum, peak, and unit vector [27]. SNV is a transformation used to eliminate scattering effects by centering and scaling each spectrum [14, 28]. In order to correct results due to baseline curvature, DT is performed using a second-order polynomial in a regression analysis, where spectral values are painted as structured variables while the unbiased ones are provided by the wavelengths [11, 29]. PN is a method that can bring the average or peak amplitude to a target level. Due to the resemblance of the utilized gain across the specified ranges, the signal-to-noise ratio and dynamics remain unaffected. Normalization is distinct from dynamic range compression, which implements a change in gain to modify the lowest and highest range levels [30].
2.5 Calibration method
The concentrations of pollutant load in POME, river water, and irrigation water are assessed using the NIRS spectrum created during the model calibration process. The model applied for prediction is PLS. The prediction model is established by regression between the NIRS spectrum (variable X) and the levels of pollutant load (variable Y) obtained from sample preparation. Calibration refers to the method of formulating a mathematical equation model that can be utilized to predict a substance's levels without needing direct assessments that might damage the substance [11]. Cross-validation is the approach used to test the model's validity. The Unscrambler 10.3 program is used to assist in the construction of the calibration and validation models.
2.6 Model assessment
The correlation coefficient (r), determination coefficient (R2), and RPD index were employed to evaluate the prediction model’s performance based on the calibration results. The root mean squared error of calibration (RMSEC) value is divided by the standard deviation (SD) of the reference data to formulate the RPD index. A successful and optimal model should exhibit a lower RMSEC and LV, accompanied by a greater RPD index, r, and R2. Additionally, a performance evaluation of the prediction model for the pollution load level was carried out using these statistical measures [12, 13].
$R P D=\frac{S D}{R M S E C}$ (1)
Furthermore, the model's performance is assessed using the range to error ratio (RER). The range of reference technique values for which there is no prediction set for RMSEC is known as RER. By dividing the range by the mean square error of cross-validation (RMSECV), one may determine the RER value [31].
$R E R=\frac{\text { Range }}{\text { RMSEC }}$ (2)
3.1 Spectrum features
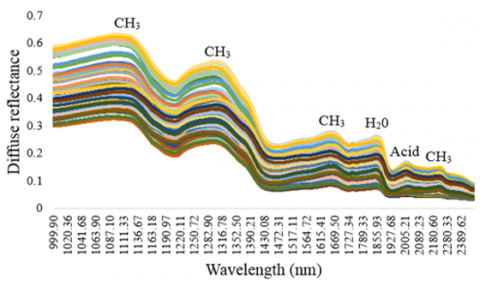
An interaction happens between a biological object and light when the object is exposed to light from a light source. As a result, the object will respond with reflection, absorption, and channels. Typical NIRS diffuse reflection spectra for each sample of POME, river water, and irrigation water are shown in Figure 1. These visible spectra have similar characteristics, with each peak and valley indicating the presence of a particular substance. Bending and stretching vibrations occur in these substances at the NIRS wavelength range.
Figure 1. Spectrum of POME, river water, and irrigation water
Based on Figure 1, it can be seen that in all sample spectra, there are six peaks. The first, second, third, and sixth peaks indicate the presence of molecules CH3 with a wavelength of 1100-1120, 1132-1286, 1640-1678, and 2210-2240 nm. At the fourth peak, the molecule was found to be H2O with a wavelength of 1842-1873 nm. The fifth peak shows the presence of acid molecules with a wavelength of 2000-2030 nm.
3.2 COD level calibration model
Table 1 displays the results of the calibration and validation process for estimating COD levels using NIR spectra. With the exception of raw data, all PLS regressions generally provide models that are stronger and more accurate. This is due to the fact that raw data still has a lot of interference from direct measurements, such as light scattering and baseline fluctuations, which results in low spectrum information on chemical composition.
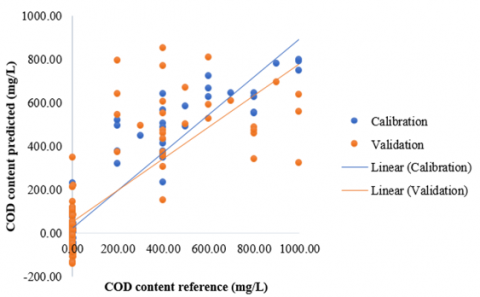
Table 1 shows that the calibration model's spectrum pretreatments all produced RPD indices between 2.5 and 3.0. All of these models fit the description of good prediction model accuracy interpretation according to the literature. When viewed from the results of the model validation, both the Raw Data model and using spectrum pretreatment obtained RER values in the range of 3-10. Based on the literature, all of these models fall into the category of interpretations that have low to moderate practical utility. Based on the calibration RPD index, the PLS-DT model is considered the best model with an RPD index of 2.80 and an RER value of 5.27. The calibration and validation plots of the PLS-DT model for the COD prediction model can be seen in Figure 2.
Figure 2. Scatter plot of reference against anticipated COD content (mg/L) using the PLS-DT model for calibration and validation
Table 1. Statistics of calibration results for COD content prediction
|
Pretreatment Method |
Calibration |
Validation |
|||||||
|
LV |
r |
R2 |
RMSEC |
RPD |
r |
R2 |
RMSECV |
RER |
|
|
Raw Data |
11 |
0.88 |
0.78 |
135.02 |
2.15 |
0.78 |
0.60 |
184.92 |
5.40 |
|
MN |
15 |
0.92 |
0.85 |
110.72 |
2.63 |
0.70 |
0.48 |
218.05 |
4.58 |
|
SNV |
15 |
0.92 |
0.87 |
104.88 |
2.77 |
0.72 |
0.52 |
213.41 |
4.68 |
|
DT |
15 |
0.93 |
0.87 |
103.98 |
2.80 |
0.77 |
0.60 |
189.62 |
5.27 |
|
PN |
15 |
0.93 |
0.86 |
108.89 |
2.67 |
0.72 |
0.51 |
212.28 |
4.71 |
3.3 BOD level calibration model
Table 2 displays the results of the calibration and validation process for estimating BOD levels using NIR spectra. With the exception of raw data, all PLS regressions generally provide models that are stronger and more accurate. This is due to the fact that raw data still has a lot of interference from direct measurements, such as light scattering and baseline fluctuations, which results in a low spectrum of chemical composition information.
Table 2. Statistics for calibration results in the prediction of BOD concentrations
|
Pretreatment Method |
Calibration |
Validation |
|||||||
|
LV |
r |
R2 |
RMSEC |
RPD |
r |
R2 |
RMSECV |
RER |
|
|
Raw Data |
11 |
0.89 |
0.79 |
41.32 |
2.22 |
0.79 |
0.62 |
56.85 |
6.15 |
|
MN |
15 |
0.92 |
0.86 |
33.89 |
2.70 |
0.72 |
0.51 |
66.82 |
5.24 |
|
SNV |
15 |
0.94 |
0.88 |
31.83 |
2.88 |
0.74 |
0.55 |
64.62 |
5.41 |
|
DT |
15 |
0.94 |
0.88 |
31.74 |
2.89 |
0.79 |
0.62 |
57.81 |
6.05 |
|
PN |
15 |
0.93 |
0.87 |
32.80 |
2.79 |
0.73 |
0.54 |
64.83 |
5.40 |
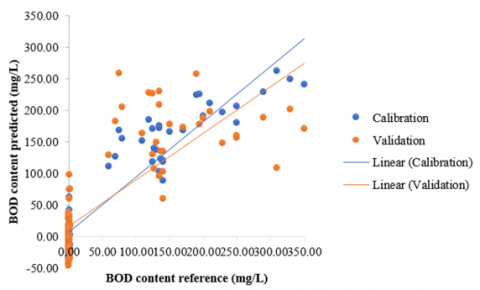
Figure 3. Scatter plot of reference against anticipated BOD content (mg/L) using the PLS-DT model for calibration and validation
Referring to Table 2, it is evident that all spectrum pretreatments for the calibration model achieved an RPD index falling between 2.5 and 3.0. According to the literature, each of these models is classified under the category of accurate interpretation of good prediction model performance. When viewed from the model validation results, the Raw Data model obtained an RPD index in the range of 2.0-2.5, so that it falls into the category of rough quantitative prediction interpretation, while all spectrum pretreatments for the calibration model obtained an RPD index in the range of 2.5-3.0, so that it falls into the category of good prediction model accuracy interpretation. When viewed from the model validation results, both the Raw Data model and using spectrum pretreatment obtained RER values in the range of 3-10. Based on the literature, all of these models fall into the category of interpretations that have low to moderate practical utility. Based on the calibration RPD index, the PLS-DT model is considered the best model with an RPD index of 2.89 and an RER value of 6.05. The calibration and validation plots of the PLS-DT model for the BOD prediction are displayed in Figure 3.
3.4 TSS level calibration model
The results for calibration and validation of TSS level predictions utilizing NIR spectra are displayed in Table 3. Aside from the raw data, all PLS regressions typically yield models that are more robust and precise. This is because unprocessed data still contains numerous disturbances from direct measurements, such as light scattering and baseline fluctuations, which result in low spectrum information on chemical composition.
Table 3. Statistics for the calibration results in the TSS content prediction
|
Pretreatment Method |
Calibration |
Validation |
|||||||
|
LV |
r |
R2 |
RMSEC |
RPD |
r |
R2 |
RMSECV |
RER |
|
|
Raw Data |
11 |
0.69 |
0.47 |
144.46 |
1.38 |
0.46 |
0.21 |
184.31 |
6.17 |
|
MN |
15 |
0.82 |
0.68 |
112.91 |
1.77 |
0.29 |
0.09 |
218.52 |
5.21 |
|
SNV |
15 |
0.84 |
0.71 |
106.50 |
1.88 |
0.33 |
0.12 |
218.18 |
5.22 |
|
DT |
15 |
0.87 |
0.76 |
97.66 |
2.05 |
0.39 |
0.15 |
211.07 |
5.39 |
|
PN |
15 |
0.82 |
0.67 |
114.71 |
1.74 |
0.32 |
0.10 |
218.34 |
5.21 |
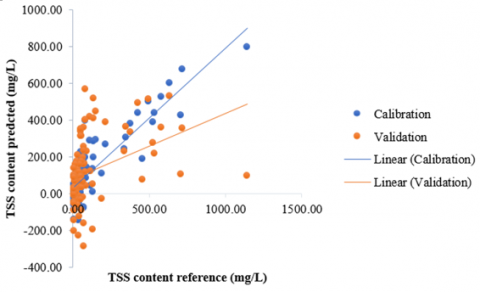
Based on Table 3, it is observable that the DT spectrum pretreatment can enhance the calibration model. The Raw Data model and MN, SNV, and DT spectrum pretreatment for the calibration model obtained an RPD index in the range of 1.5-2.0, so that it is included in the category of model interpretation capable of distinguishing low from high response variable values. While the PLS-DT model obtained an RPD index in the range of 2.0-2.5 that which is included in the category of coarse quantitative prediction interpretation. When viewed from the results of the model validation, the Raw Data model obtained an RPD index in the range of 2.0-2.5 so that it is included in the category of coarse quantitative prediction interpretation, while all spectrum pretreatments for the calibration model obtained an RPD index in the range of 2.5-3.0 so that it is included in the category of good prediction model accuracy interpretation. When viewed from the results of the model validation, both the Raw Data model and using spectrum pretreatment obtained RER values in the range of 3-10. Based on the existing literature, all of these models fall within the classification of interpretation, possessing low to moderate practical usefulness. Based on the calibration RPD index, the PLS-DT model is considered the best model with an RPD index of 2.05 and an RER value of 5.39. The calibration and validation plots of the PLS-DT model for the TSS prediction model can be seen in Figure 4.
Figure 4. PLS-DT model calibration and validation scatter plot of reference against expected TSS content (mg/L)
The results showed that the PLS-DT model provided the best results for predicting COD, BOD, and TSS levels in POME, river water, and irrigation water. DT was carried out utilizing a second-order polynomial in a regression analysis, where spectral values serve as dependent variables while the independent variables are specified by the wavelengths, rectifying influences due to baseline curvature [29]. DT is used to remove the effects of accumulating data sets so that only the absolute changes are shown, and derivatives are used to enhance spectral resolution and eliminate unimportant baseline signals from the samples [32]. The DT pretreatment technique typically eliminates nonlinear patterns in spectroscopic data and also diminishes amplification resulting from light scattering and offsets due to additive chemical influences. Spectra correction and enhancement obviously will improve spectra presentation and eliminate certain noises caused by light scattering and interference effects [33].
Prediction of COD, BOD, and TSS levels produced accuracy with RPD and RER indices of 2.80 and 5.27; 2.89 and 6.05; and 2.05 and 5.39. Based on the RPD value, the COD and BOD prediction performance is in the excellent prediction accuracy category. while TSS is in the coarse quantitative prediction. RER shows that the prediction model has low to moderate practical utility. RPD and RER indices are better than research conducted by previous researchers on the same topic [34, 35].
According to the study's findings, the NIRS approach combined with PLS has a lot of potential to increase the precision of COD, BOD, and TSS level predictions in POME, river water, and irrigation water. This study demonstrates that this approach is cost-effective, non-destructive to the sample, and capable of accurately and consistently predicting COD, BOD, and TSS levels on a wide scale without requiring a lengthy sampling process. Applying this method yields good results in estimating the amounts of TSS, BOD, and COD in irrigation water, river water, and POME. The intricate nonlinear connections between the COD, BOD, and TSS concentrations in POME, river water, and irrigation water, and the NIRS spectrum are well captured by this technique. The findings demonstrated that the PLS-DT model produced the best predictions for the amounts of COD, BOD, and TSS in irrigation water, river water, and POME. The RPD and RER indices for the COD, BOD, and TSS level predictions were 2.80 and 5.27, 2.89 and 6.05, and 2.05 and 5.39, respectively. The results of this study have significant ramifications for guaranteeing the sustainability of the environment and nature, regulating POME quality standards, monitoring the quality of irrigation and river water, and promoting environmental sustainability. It is acknowledged, although, that there are challenges and chances for additional study, such as validating this prediction model across a larger range and with different sample sizes. This research enhances our understanding of the pollutant load associated with the palm oil industry and demonstrates the capability of NIRS in conjunction with PLS as a budget-friendly and effective approach for environmental monitoring. These findings contribute to advancing agricultural and environmental engineering practices and support efforts toward sustainable environmental management and conservation.
[1] Munandar, A., Muhammad, S., Mulyati, S. (2016). Penyisihan COD dari limbah cair pabrik minyak kelapa sawit menggunakan nano karbon aktif. Jurnal Rekayasa Kimia & Lingkungan, 11(1): 24-31. https://doi.org/10.23955/rkl.v11i1.4231
[2] Garritano, A.N., de Oliveira Faber, M., De Sá, L.R., Ferreira-Leitão, V.S. (2018). Palm oil mill effluent (POME) as raw material for biohydrogen and methane production via dark fermentation. Renewable and Sustainable Energy Reviews, 92: 676-684. https://doi.org/10.1016/j.rser.2018.04.031
[3] Kutty, S.R.M., Almahbashi, N.M.Y., Nazrin, A.A.M., Malek, M.A., Noor, A., Baloo, L., Ghaleb, A.A.S. (2019). Adsorption kinetics of colour removal from palm oil mill effluent using wastewater sludge carbon in column studies. Heliyon, 5(10): e02439. https://doi.org/10.1016/j.heliyon.2019.e02439
[4] Awere, E., Bonoli, A., Obeng, P.A. (2020). Solids-liquid separation and solar drying of palm oil mill wastewater sludge: Potential for sludge reuse. Case Studies in Chemical and Environmental Engineering, 2: 100057. https://doi.org/10.1016/j.cscee.2020.100057
[5] Ilyasu, N.S., Adams, N.H., Umar, R., Ishaya, S., Nweke, O.D., Usman, S., Yakasai, H.M. (2024). Palm oil mill effluent degradation by a novel strain of Bacillus sp. isolated from contaminated environment. Case Studies in Chemical and Environmental Engineering, 9: 100637. https://doi.org/10.1016/j.cscee.2024.100637
[6] Lee, Z.S., Chin, S.Y., Lim, J.W., Witoon, T., Cheng, C.K. (2019). Treatment technologies of palm oil mill effluent (POME) and olive mill wastewater (OMW): A brief review. Environmental Technology & Innovation, 15: 100377. https://doi.org/10.1016/j.eti.2019.100377
[7] Lok, X., Chan, Y.J., Foo, D.C. (2020). Simulation and optimisation of full-scale palm oil mill effluent (POME) treatment plant with biogas production. Journal of Water Process Engineering, 38: 101558. https://doi.org/10.1016/j.jwpe.2020.101558
[8] Miller, R. (2000). Review essay: The third way. Political Science, 52(2): 174-180. https://doi.org/10.1177/003231870005200207
[9] BPK Regulation Database. (2021). Government Regulation Number 22 of 2021-Implementation of Environmental Protection and Management. Indonesia, Central Government. https://peraturan.bpk.go.id/Details/161852/pp-no-22-tahun-2021.
[10] Munandar, A., Mulyati, S. (2022). Application of chemometric combination NIRS technology for analysis of mixed coconut oil levels in Aceh Patchouli Oil. IOP Conference Series: Earth and Environmental Science, 1116: 012023. https://doi.org/10.1088/1755-1315/1116/1/012023
[11] Munandar, A., Mulyati, S., Hasanuddin, Zulfahrizal. (2023). Estimating Gurjun oil adulteration in Aceh patchouli oil using NIRS and multivariate analysis. International Journal of Design & Nature and Ecodynamics, 18(5): 1121-1127. https://doi.org/10.18280/ijdne.180513
[12] Zulfahrizal, Z., Munawar, A.A. (2021). Near-infrared technology in agriculture: Non-destructive determination of inner quality parameters in intact cocoa beans. Trends in Sciences, 18(20): 31-31. https://doi.org/10.48048/tis.2021.31
[13] Hayati, R., Zulfahrizal, Z., Munawar, A.A. (2021). Robust prediction performance of inner quality attributes in intact cocoa beans using near infrared spectroscopy and multivariate analysis. Heliyon, 7(2): e06286. https://doi.org/10.1016/j.heliyon.2021.e06286
[14] Pasquini, C. (2018). Near infrared spectroscopy: A mature analytical technique with new perspectives–A review. Analytica Chimica Acta, 1026: 8-36. https://doi.org/10.1016/j.aca.2018.04.004
[15] Devianti, D., Sufardi, S., Zulfahrizal, Z., Munawar, A.A. (2019). Near infrared reflectance spectroscopy: prediksi cepat dan simultan kadar unsur hara makro pada tanah pertanian. Agritech, 39(1): 12-19. https://doi.org/10.22146/agritech.42430
[16] Munawar, A.A., Sufardi, S. (2024). Capability of short Vis-NIR band tandem with machine learning to rapidly predict NPK content in tropical farmland: A case study of Aceh Province agricultural soil dry land, Indonesia. Case Studies in Chemical and Environmental Engineering, 9: 100711. https://doi.org/10.1016/j.cscee.2024.100711
[17] Zhou, P., Zhang, Y., Yang, W., Li, M., Liu, Z., Liu, X. (2019). Development and performance test of an in-situ soil total nitrogen-soil moisture detector based on near-infrared spectroscopy. Computers and Electronics in Agriculture, 160: 51-58. https://doi.org/10.1016/j.compag.2019.03.016
[18] Paul, A., Wander, L., Becker, R., Goedecke, C., Braun, U. (2019). High-throughput NIR spectroscopic (NIRS) detection of microplastics in soil. Environmental Science and Pollution Research, 26: 7364-7374. https://doi.org/10.1007/s11356-018-2180-2
[19] Stafford, A.D., Kusumo, B.H., Jeyakumar, P., Hedley, M.J., Anderson, C.W. (2018). Cadmium in soils under pasture predicted by soil spectral reflectance on two dairy farms in New Zealand. Geoderma Regional, 13: 26-34. https://doi.org/10.1016/j.geodrs.2018.03.001
[20] Serrano, J., Shahidian, S., Carapau, Â., Rato, A.E. (2021). Near-infrared spectroscopy (NIRS) and optical sensors for estimating protein and fiber in dryland Mediterranean pastures. AgriEngineering, 3(1): 73-91. https://doi.org/10.3390/agriengineering3010005
[21] Mammadov, E., Denk, M., Riedel, F., Lewinska, K., Kaźmierowski, C., Glaesser, C. (2020). Visible and near-infrared reflectance spectroscopy for assessment of soil properties in the Caucasus Mountains, Azerbaijan. Communications in Soil Science and Plant Analysis, 51(16): 2111-2136. https://doi.org/10.1080/00103624.2020.1820027
[22] Liu, Y., Liu, Y., Chen, Y., Zhang, Y., Shi, T., Wang, J., Zhang, Y. (2019). The influence of spectral pretreatment on the selection of representative calibration samples for soil organic matter estimation using Vis-NIR reflectance spectroscopy. Remote Sensing, 11(4): 450. https://doi.org/10.3390/rs11040450
[23] Shi, T., Chen, Y., Liu, Y., Wu, G. (2014). Visible and near-infrared reflectance spectroscopy—An alternative for monitoring soil contamination by heavy metals. Journal of Hazardous Materials, 265: 166-176. https://doi.org/10.1016/j.jhazmat.2013.11.059
[24] Zulfahrizal, Muhammad, S., Munawar, A.A. (2021). Rapid determination of patchouli oil quality as a tropical plant using infrared technology. IOP Conference Series: Earth and Environmental Science, 922: 012027. https://doi.org/10.1088/1755-1315/922/1/012027
[25] Muhammad, S., Munawar, A.A. (2021). Rapid detection of patchouli oil mixed by coconut oil using NIRS technology and chemometrics method. IOP Conference Series: Earth and Environmental Science, 644: 012005. https://doi.org/10.1088/1755-1315/644/1/012005
[26] Windawati, V., Purwanto, Y.A., Budiastra, I.W., Widodo, S., Kuroki, S. (2019). Prediction of chemical content in patchouli oil (Pogostemon cablin Benth) by portable NIR spectroscopy. IOP Conference Series: Materials Science and Engineering, 557: 012087. https://doi.org/10.1088/1757-899X/557/1/012087
[27] Sari, S., Munawar, A.A., Devianti, D. (2020). Application of near infrared spectroscopy (NIRS) to determine phosphorus nutrient content in household wastewater treatment plants. Jurnal Ilmiah Mahasiswa Pertanian, 5(1): 521-530. https://doi.org/10.17969/jimfp.v5i1.13687
[28] Barnes, R.J., Dhanoa, M.S., Lister, S.J. (1989). Standard normal variate transformation and de-trending of near-infrared diffuse reflectance spectra. Applied Spectroscopy, 43(5): 772-777. https://doi.org/10.1366/0003702894202201
[29] Ortiz, A., León, L., Contador, R., Tejerina, D. (2021). Near-Infrared Spectroscopy (NIRS) as a tool for classification of pre-sliced Iberian salchichón, modified atmosphere packaged (map) according to the official commercial categories of raw meat. Foods, 10(8): 1865. https://doi.org/10.3390/foods10081865
[30] Kobori, H., Gorretta, N., Rabatel, G., Bellon-Maurel, V., Chaix, G., Roger, J.M., Tsuchikawa, S. (2013). Applicability of Vis-NIR hyperspectral imaging for monitoring wood moisture content (MC). Holzforschung, 67(3): 307-314. https://doi.org/10.1515/hf-2012-0054
[31] Furtado, E.J.G., Bridi, A.M., Barbin, D.F., Barata, C.C.P., Peres, L.M., Barbon, A.P.A.D.C., Batista, J.P. (2018). Prediction of pH and color in pork meat using VIS-NIR near-infrared spectroscopy (NIRS). Food Science and Technology, 39: 88-92. https://doi.org/10.1590/fst.27417
[32] Bittante, G., Patel, N., Cecchinato, A., Berzaghi, P. (2022). Invited review: A comprehensive review of visible and near-infrared spectroscopy for predicting the chemical composition of cheese. Journal of Dairy Science, 105(3): 1817-1836. https://doi.org/10.3168/jds.2021-20640
[33] Yunus, Y., Satriyo, P., Munawar, A.A. (2019). Rapid prediction of soil quality indices using near infrared spectroscopy. IOP Conference Series: Earth and Environmental Science, 365: 012043. https://doi.org/10.1088/1755-1315/365/1/012043
[34] Syahrul, S., Satriyo, P., Munawar, A.A. (2019). Applying infrared reflectance spectroscopy to predict water quality in Aceh River. International Journal of Scientific & Technology Research, 8(10): 969-972.
[35] Han, X., Xie, D., Song, H., Ma, J., Zhou, Y., Chen, J., Huang, F. (2022). Estimation of chemical oxygen demand in different water systems by near-infrared spectroscopy. Ecotoxicology and Environmental Safety, 243: 113964. https://doi.org/10.1016/j.ecoenv.2022.113964