Amirah Saidin | Kamilia Sharir![]() | Dwa Desa Warnana
| Dwa Desa Warnana![]() | Wien Lestari
| Wien Lestari![]() | Rodeano Roslee*
| Rodeano Roslee*![]()
© 2025 The authors. This article is published by IIETA and is licensed under the CC BY 4.0 license (http://creativecommons.org/licenses/by/4.0/).
OPEN ACCESS
Erosion and flooding are closely linked processes that influence each other through sediment transport and hydrological changes. Erosion reduces the capacity of river channels by depositing sediment, while flooding accelerates soil detachment and transport. In Kota Belud, Sabah, this interplay is intensified by deforestation, agricultural activities, and unsustainable land development. This study employs the Revised Universal Soil Loss Equation (RUSLE) within a GIS environment to assess erosion-prone areas and their contribution to flooding. A 5 m × 5 m resolution Digital Elevation Model (DEM) was used to derive the LS factor, while rainfall data, soil series, and land cover were used to compute the R, K, and C factors, respectively. The model was validated using flood-prone area data through an Area Under the Curve (AUC) analysis, resulting in an accuracy of 81.22%, indicating good predictive capability. The erosion susceptibility map revealed that 83.6% of the area has very low susceptibility, while 0.5% falls under high to very high categories. These critical zones likely contribute to sedimentation in rivers, exacerbating downstream flooding. The findings provide essential insights for regional flood management, emphasizing the need for targeted soil conservation and sustainable land-use planning in Kota Belud.
Revised Universal Soil Loss Equation (RUSLE), erosion causative factors, prediction accuracy, AUC
Floods pose significant natural risks, especially after heavy rainfall, and can result in both direct and indirect damage to lives, property, and infrastructure. The causes of floods are multifaceted, involving both natural and anthropogenic factors. These include climate change, antecedent soil moisture, deforestation, urbanization, and alterations to river channels and floodplains [1]. Human activities, such as rapid unplanned development, land-use changes, and encroachment into sensitive areas, have further escalated flood frequency and intensity.
Erosion and flooding are intricately linked processes. Erosion can worsen flooding by reducing the capacity of river channels through sedimentation, while flooding accelerates erosion by transporting soil particles, thereby increasing landscape instability. Deforestation, agricultural expansion, and poorly managed infrastructure development amplify these effects. For instance, the removal of vegetative cover exposes soil surfaces, making them vulnerable to rainfall impact, which can increase erosion rates by up to 100-fold.
In Sabah, Kota Belud is particularly prone to recurring flood events that cause major socio-economic and environmental disruptions. Rapid land development, combined with the geomorphological impact of the 2015 Ranau Earthquake, has exacerbated both erosion and flood hazards. The earthquake caused extensive geomorphological changes, including riverbank failure and sediment accumulation in the Panataran River, which reduced channel capacity and increased flood susceptibility [2-4]. However, few studies have quantified this post-earthquake relationship between erosion and flooding in Southeast Asia, particularly in localized Malaysian contexts.
To better understand this phenomenon, empirical erosion models like the Universal Soil Loss Equation (USLE) and its enhanced form, the Revised Universal Soil Loss Equation (RUSLE), are commonly used. These models estimate average annual soil loss based on factors such as rainfall intensity (R), soil erodibility (K), slope length and steepness (LS), cover management (C), and conservation practices (P). The RUSLE model is especially advantageous due to its adaptability to GIS platforms and capacity to represent both agricultural and non-agricultural landscapes.
Despite the extensive use of RUSLE globally, there remains a research gap in applying such models to assess erosion-flood interactions in post-earthquake Southeast Asian landscapes. This study addresses that gap by applying a GIS-based RUSLE approach to quantify erosion susceptibility and its contribution to flooding in Kota Belud, with the aim of supporting data-driven land use and flood management policies.
1.1 Study area
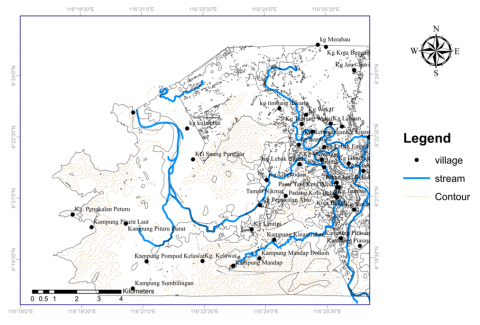
The study area is located in the Kota Belud district of Sabah, as shown in Figure 1. This district is situated 70 km from Sabah’s capital, Kota Kinabalu, on the West Coast of the state. The total area of the district is 1,385.60 square kilometers [5]. Kota Belud encompasses four major river basins: Kedamaian, Wariu, Tempasuk, and Kawang-Kawang [5]. The study area consists of the Crocker Formation, Wariu Formation, and Quaternary alluvium deposits, which include coastal and river alluvium. The Crocker Formation dates back to the Late Eocene to Early Miocene, while the Wariu Formation is from the Middle Miocene. The majority of the study area, approximately 61% (118 km²), consists of Quaternary deposits, followed by the Crocker Formation at 32% (63 km²) and the Wariu Formation at 7% (14 km²). In the study area, observations show that the Crocker Formation consists of massive sandstones, interbedded sandstone and shale, as well as red shale. Most of the slopes in the area are within the Crocker Formation, characterized by high levels of weathering and thick soil profiles. The Wariu Formation, located in the western part of the study area, is characterized by various-sized boulders and rock fragments. Due to its loose structure and unconsolidated nature, the Wariu Formation is prone to failure. The Quaternary alluvium deposits in the area consist of both new and old alluvial deposits.
Figure 1. The location of the study area
1.2 Erosion causative factors
This study does not examine individual factors that cause erosion but instead focuses on establishing the relationship between erosion and its impact on flooding. When selecting factors related to erosion and flooding for a specific area, there are no strict guidelines [6, 7]; the choice typically depends on the area's natural environment and the availability of data. In this study, we selected five causative factors to assess the extent of erosion and its influence on flooding in the study area. These factors include topography and slope, soil type and erodibility, vegetation cover, precipitation patterns, and land use.
Topography is one of the primary factors influencing soil and water erosion. The effect of topography on erosion is accounted for by the length–steepness (LS) factor, which is a combination of two sub-factors: slope length (L) and slope steepness (S). Generally, as slope length increases, total soil erosion and soil erosion per unit area increase due to the progressive accumulation of runoff in the downslope direction. As slope steepness increases, the velocity and erosivity of runoff also increase. The LS factor determines the steepness of the landscape and reflects the effect of topography on soil erosion [8, 9]. High LS factor values lead to increased flow velocity and surface runoff, significantly affecting soil erosion rates, especially in complex terrain areas [10, 11]. The LS factor also considers the influence of upstream flow accumulation on downstream cells [12]. It includes both slope length, which enlarges the area affected by runoff, and slope steepness, which accelerates runoff velocity—making steepness a critical parameter in topographic analysis [13]. The impact of slope steepness on soil loss is greater than that of slope length, with the most severe erosion occurring on slopes between 10% and 25%.
The soil erodibility factor characterizes the susceptibility of soil to erosion [14], taking into account the mobility of silt and runoff quantity for each rainfall event in a standardized manner [11]. This factor reflects the varying rate at which soil erodes in different regions and is defined as the rate of soil loss per unit of rainfall erosivity for a specific soil, capturing the integrated effect of all soil properties and profile characteristics [9, 10]. Soil characteristics such as texture and cohesion are key to determining resistance to erosion. For instance, clay-rich soils tend to be more cohesive and absorb water efficiently, but when saturated, they may lead to landslides, increasing the sediment load in rivers. In contrast, sandy soils erode more easily, directly contributing to sediment transport into waterways, which can cause downstream blockages and floods.
The precipitation factor is related to the erosive forces of rainfall, which disturb the soil surface and result in runoff [5, 10, 13]. The amount of rainfall and its peak intensity over time are crucial factors for breaking up the surface into particles small enough to be transported [15-17]. Precipitation has a significant impact on soil erosion, with sediment deposits often observed after intense storms, making detailed, continuous precipitation data vital for accurate calculations [18, 19]. Intense or prolonged rainfall events are key triggers for both erosion and flooding. Heavy rain loosens the soil, especially in areas with poor vegetation cover, leading to higher erosion rates. At the same time, the excess water contributes to river swelling and potential overflow, particularly when sediment deposition has reduced the river’s capacity.
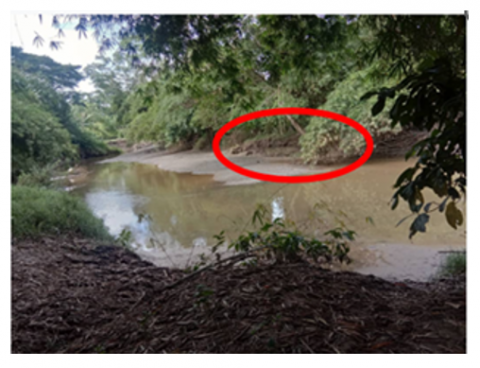
Human activities, such as agriculture, urbanization, mining, and construction, accelerate erosion and disrupt natural water flow. Improper land use practices, such as overgrazing or unsustainable farming, strip land of its protective vegetation, increasing erosion rates. Urbanization increases impervious surfaces (e.g., roads, pavements), reducing infiltration and increasing runoff—further intensifying the relationship between erosion and flooding. Techniques to mitigate this include contouring, strip cropping, concave slopes, terraces, grass hedges, silt fences, straw bales, and subsurface drainage [14, 18, 20]. Vegetation plays a critical role in stabilizing soils and reducing erosion. Plant roots bind soil particles, while the canopy reduces the impact of raindrops on the soil surface. In areas where deforestation or land clearance has occurred, erosion rates rise dramatically, leading to higher sediment deposition in rivers. Figure 2 depicts instances of riverbank failure in the study area, which in turn heighten flooding risks. The loss of vegetation also reduces the land's natural water retention capacity, contributing to increased surface runoff.
Figure 2. Some failure of the riverbank in the study area
2.1 Material source
The materials used for erosion analysis and RUSLE modeling in this study are summarized in Table 1.
Table 1. Summary of groups, input layers, and data sources used in the study
|
Group |
Input Layer(s) |
Data Source(s) |
|
Slopes |
Slope angle |
IFSAR-derived DEM (5 m × 5 m resolution) |
|
Slope height |
IFSAR-derived DEM |
|
|
Slope aspect |
IFSAR-derived DEM |
|
|
Geology |
Lithology |
Geological Survey of Malaysia, fieldwork |
|
Soil material |
Land Resources Division, fieldwork, laboratory analysis |
|
|
Structural features |
IFSAR-derived DEM, high-resolution satellite imagery |
|
|
Land Use |
Land use classification |
Department of Town and Country Planning |
|
Infrastructure data |
World Street Map, high-resolution satellite imagery |
|
|
Hydrology |
Drainage network |
Topographic map (1:50,000 scale) |
|
Rainfall data |
Sabah Meteorological Department (monthly/annual rainfall records) |
2.2 Application of RUSLE modeling
The Revised Universal Soil Loss Equation (RUSLE) estimates average annual soil loss (A) using five key factors:
$R U S L E=R * K * L S * C * P$ (1)
where,
$R$= Rainfall erosivity factor
$K$= Soil erodibility factor
$L S$= Slope length and steepness factor
$C$= Cover management factor
$P$= Conservation support practice factor
For the study area, the precipitation data is often collected on a monthly and annual basis. The R factor was calculated using empirical formulas adapted for tropical climates [21-25]. Monthly and annual precipitation data were obtained from the Sabah Meteorological Department and applied to the Morgan (1974) and Roose (1975) models:
$R_{\text {morgan }}=(9.28 P-8838.15) \times 0.075$ (2)
$R_{\text {roose }}=(0.5 P \times 17.3)$ (3)
$R_{\text {best estimation }}=\frac{\text { morgan }+ \text { roose }}{2}$ (4)
The determination of the K factor can be achieved through experimental methodologies that involve the integration of various soil parameters. Soil maps published by Malaysia’s Department of Agriculture were used to obtain details on different soil classifications and their associated textural characteristics. The K-factor was computed using USDA-recommended equations based on soil textural data obtained from the Department of Agriculture:
$K=\left[\frac{1.0 \times 10^{-4}(12-O M) M^{1.14}+4.5(s-3)+8.0(p-2)}{100}\right]$ (5)
where, OM = organic matter (%), M = (silt % + very fine sand %) × (100 – clay %), S = structure code, and P = permeability code.
Generating an erosion susceptibility map based on RUSLE modeling. The main data sources are the IFSAR-derived Digital Elevation Model (DEM), periodical satellite images within the study area. A high resolution of DEM, i.e., the resolution used in this study, is 5 m × 5 m. The LS factor was calculated using the equation:
$L S=(\lambda / \Psi)^m \times\left(0.065+0.046 s+0.0065 s^2\right)$ (6)
where,
$\lambda$= the slope length (m),
$\psi$= the slope unit,
$S$= the slope angle in degrees, and
$m$= a variable exponent.
The high-resolution 5 m × 5 m DEM used in this study helps minimize underestimation of slope variation, thus improving LS factor accuracy in rugged terrains such as Kota Belud.
Meanwhile, the values of C and P are determined based on the type of land use in the study area. The land use map was digitized in accordance with the study area. After digitization, data entry and spatial format conversion from vector to raster (grid) were performed. The C values were then matched with the land use map using the reclassification method, as suggested in the Guideline for Erosion and Sediment Control in Malaysia [15].
To evaluate the RUSLE model’s predictive performance, a Receiver Operating Characteristic (ROC) curve was generated, comparing model-derived erosion susceptibility with known flood-affected areas. The Area Under the Curve (AUC) value of 81.22% indicates good model performance and a strong spatial correlation between predicted high erosion zones and actual flood occurrence zones.
3.1 Erosion susceptibility map
Figures 3 to 7 present the calculated values of each RUSLE factor, derived from multiple sources and station measurements across the study area.
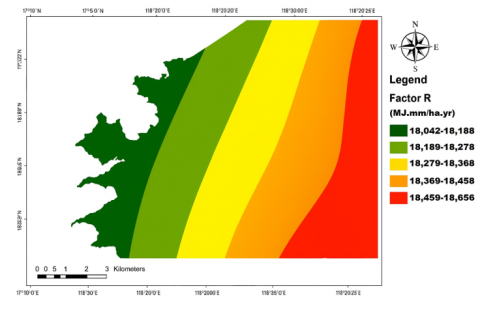
Figure 3. The rainfall erosivity (R) map
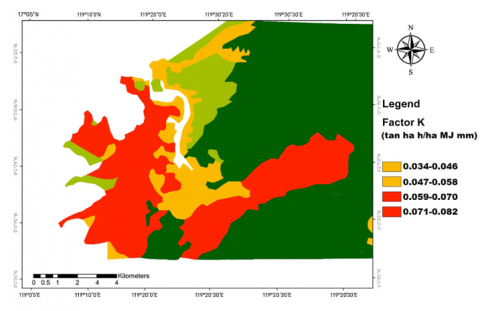
Figure 4. The soil erodibility (K) map
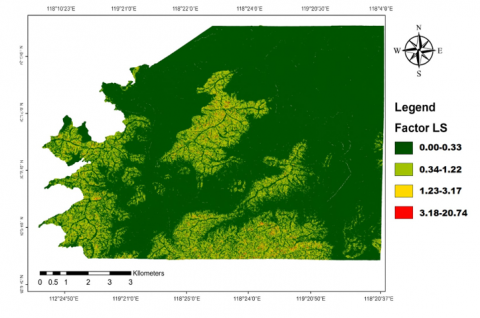
Figure 5. The slope length and slope steepness (LS) map
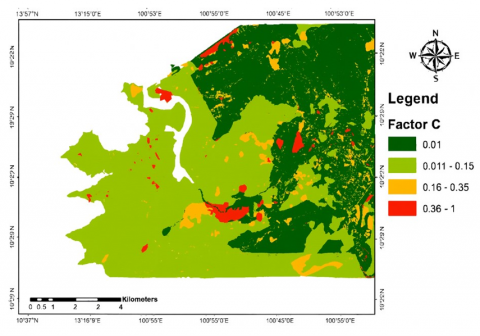
Figure 6. The cover management (C) map
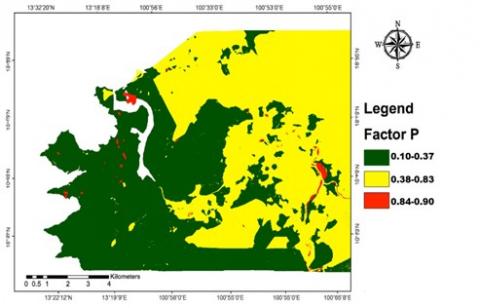
Figure 7. The conservation practice factor (P) map
The soil erosion rate in the Kota Belud area was determined by integrating the erosion factors of the RUSLE model in GIS software. Eq. (4) was used to estimate the R factor based on the annual precipitation data from the Jabatan Air dan Saliran station, which is the closest to the Kota Belud area. The study shows R values ranging from 18,042.2 to 18,564.9 MJ·mm/ha·yr, with the southwestern part of the study area experiencing the highest rainfall erosivity. This suggests that rainfall erosivity, particularly in the southwest, is a major contributor to erosion. The energy from raindrops detaches soil particles, making them more easily transported by surface runoff, especially in steep or deforested areas.
The soil erodibility factor (K) in the Kota Belud area ranges from 0.03 to 0.08. A composite K-factor map was created to show spatial variation across seven major soil types [26]. The highest erodibility value (0.082) was found in the Lokan soil type (silty clay loam) with low organic content (1.07%). Soils with less than 3.5% organic matter and more than 40% silt are particularly prone to erosion. In contrast, the Crocker Formation, with a higher sand content and better infiltration capacity, showed lower K values [27-29]. Similarly, Kinabatangan soils produced moderate erodibility due to clay-rich parent materials [30].
Areas with steep slopes showed the highest LS (length–steepness) factor values. The LS factor reflects how slope morphology influences erosion. In hilly and mountainous regions, increased slope angle and length raise runoff velocity and soil detachment [31-33]. Flat terrains, such as floodplains, have lower LS values and erosion rates, but often accumulate sediments eroded from higher elevations [34, 35]. This pattern confirms that sediment is transported downslope, affecting both highland and lowland areas.
Proper land management in steep areas is critical to reduce sediment export, while lowland zones require sediment control to prevent siltation and flooding. These findings align with those of several authors [11, 17, 31-33], demonstrating an exponential increase in erosion with slope steepness [34]. Additionally, even though the kinetic energy of rainfall remains constant, the flow energy of water increases on steeper slopes, causing accelerated downslope erosion [35].
Land use also influences soil erosion [21-23]. Forests and grasslands tend to have low C and P factors due to protective vegetation. Conversely, urban areas, overgrazed land, and poorly managed farms contribute to high erosion risk. Forested zones in Kota Belud play a protective role, while exposed agricultural land is more vulnerable.
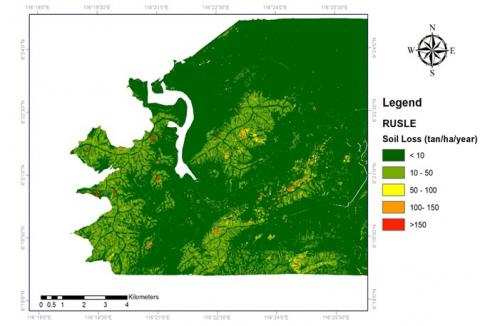
Figure 8. The erosion susceptibility map of the study area
Figure 8 shows the RUSLE-based erosion susceptibility map. Based on soil loss estimates:
The majority of the region experiences very low erosion risk, especially in flat areas with dense vegetation. However, high and very high erosion risk zones are concentrated in steep, sparsely vegetated hillslopes.
High-risk zones, particularly those with steep slopes and minimal vegetation, require immediate intervention using contour farming, terracing, reforestation, and sediment control measures aligned with Sabah’s agricultural soil conservation guidelines.
While the RUSLE model effectively identifies surface erosion risk based on climatic, topographic, soil, and land use parameters, it has limitations. Specifically, RUSLE does not account for subsurface erosion processes such as piping, gully formation, or sediment transport in saturated soils, which can also contribute to flood-related sedimentation. Additionally, the model assumes sheet and rill erosion as the dominant mechanisms, which may underrepresent erosion severity in areas experiencing concentrated or channelized flow. These limitations should be considered when interpreting the erosion–flood relationship, particularly in complex geomorphological settings like Kota Belud.
These findings align with studies conducted in monsoonal regions of Southeast Asia, such as Indonesia and the Philippines, where steep slopes and deforestation are key drivers of sediment-related flooding.
3.2 Relationship between erosion and flooding in Kota Belud based on RUSLE modeling
Although the RUSLE model outputs suggest generally low erosion and sediment yield in much of the study area, these values do not necessarily imply a negligible contribution of erosion to flooding in Kota Belud. Several factors influence this relationship, particularly spatial scale. When erosion analysis is confined to a localised zone, such as a sub-basin or village-level catchment, the perceived sediment contribution may appear minor [35]. However, erosion from adjacent upland or agricultural zones not included in the study can significantly increase sediment flux into downstream rivers.
In the tropical climatic context of Kota Belud—characterised by high-intensity rainfall, especially during monsoon seasons—even small amounts of sediment detachment can be rapidly mobilised and deposited downstream. Heavy rainfall events not only increase runoff but also mobilise existing sediment, particularly from disturbed or steep terrain. During peak events, the combined effects of accelerated runoff and sediment transport can overwhelm river channels and urban drainage systems.
Despite relatively low average erosion rates, the study shows that localized erosion hotspots significantly influence downstream flooding through sedimentation, though subsurface erosion processes are not considered in the RUSLE model.
Other land-surface conditions may exacerbate flooding even where erosion rates appear low. For example, soil compaction from agricultural activities or construction reduces infiltration, increases overland flow, and reduces the land’s capacity to retain water. Similarly, land-use conversion—from forests to agriculture or urban areas—diminishes canopy interception and soil organic content, increasing runoff and reducing the landscape’s hydrological resilience.
Moreover, accumulated sediment from upstream erosion may block or reduce the capacity of natural drainage channels. When rivers become shallower due to sedimentation, even normal flow volumes can lead to overtopping during storms. These geomorphic changes can trigger flash floods, particularly in low-lying or poorly drained areas.
Urban expansion in Kota Belud has also introduced impervious surfaces such as roads and buildings, which prevent natural infiltration and increase direct surface runoff. When intense rainfall occurs, these systems quickly channel water into rivers and drains, which—if undersized or already sediment-choked—fail to convey water effectively, thus leading to flooding.
In addition, water infrastructure such as irrigation systems or dams may amplify flooding downstream if poorly managed. For instance, sudden releases of water from upstream retention structures during heavy rainfall events can coincide with peak runoff volumes, further stressing downstream hydraulic systems.
3.3 Map validation
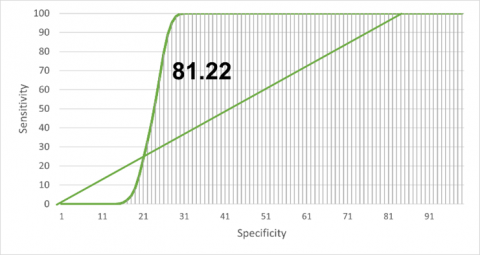
Validation is a crucial process to assess the efficiency and accuracy of the obtained results [36]. Area under the curve (AUC) analysis is used to test the accuracy of the classification made in a model by plotting sensitivity values in a graph [37].
The erosion susceptibility maps generated from the RUSLE model were validated by comparing the maps with flood distribution data. Rainfall data is used to generate forecast rate curves. The cumulative percentage of erosion events was calculated, and the prediction rate curves were plotted for both models then to calculate the average value of the ratio of the area under the curve (AUC). The basis for using this approach is that flood distribution maps generated will be divided into classes and grades of the same extent (from the lowest to the highest value) [38, 39]. These maps can be determined using a success curve or a prediction curve graph. These curves are plotted by calculating the cumulative percentage of potentially flooded areas (from maximum to minimum probability) on the x-axis and the cumulative percentage of flood occurrence on the y-axis. If the slope of the curve is steeper, it indicates a higher number of floods falling into categories highly vulnerable to erosion.
As illustrated in Figure 9, the interaction between the two variables follows a directly proportional pattern, where the cumulative susceptibility index increases alongside the cumulative flood occurrence rate until both axes reach their respective upper limits. Initially, the trend line rises gradually, but then it accelerates sharply, hitting the maximum value on the y-axis. After this surge, the line flattens and maintains a steady trend until it reaches the maximum value on the x-axis.
The area ratio is 0.8122, and the prediction accuracy is 81.22%. Based on the classification by Hrissanthou [40], the prediction accuracy of this model is fairly satisfactory.
Figure 9. Graph showing the relationship between the cumulative percentage of flood occurrences (y-axis) and the cumulative area percentage of erosion susceptibility index (x-axis)
The RUSLE-based erosion susceptibility map indicates that a majority of the Kota Belud study area (83.6%, or 11,479.13 hectares) falls under the very low soil loss category, largely due to gentle terrain and dense vegetation cover. The low-risk category (10–50 tons/ha/year) accounts for 15.0% of the area, while moderate risk zones (50–100 tons/ha/year) constitute 0.9%. In contrast, high (0.2%) and very high (0.3%) erosion zones are concentrated in steep, sparsely vegetated areas, posing a significant risk of soil degradation and downstream sedimentation.
Although the overall soil loss rates are relatively low, this study demonstrates that localized erosion hotspots can contribute to sediment accumulation in rivers, reducing flow capacity and increasing the risk of flooding, especially during heavy rainfall. These findings emphasize the need to consider both erosion and land use as contributing factors to flood hazard in tropical monsoon regions like Kota Belud.
To mitigate erosion-induced flood risks, immediate interventions are recommended for high-risk zones. These include terracing, contour farming, reforestation, and sediment control strategies aligned with Sabah’s agricultural soil conservation guidelines. In addition, the integration of erosion mapping with flood management planning is crucial for prioritizing conservation actions and enhancing disaster resilience at the catchment scale.
The study also highlights the limitations of the RUSLE model, which does not account for subsurface or gully erosion processes. Future research should explore coupling RUSLE with hydrological or sediment transport models to better quantify the erosion–flood relationship in complex terrain.
The authors would like to express their sincere appreciation to Universiti Malaysia Sabah (UMS) for the opportunity to carry out this study through laboratory analysis and fieldwork support. Financial support from UMS research grants SDK0130-2020, GUG0587-1/2023, GUG0586-1/2023, GUG0534-2/2020, and GUG06701-2/2024 is gratefully acknowledged.
[1] Roslee, R., Sharir, K. (2019). Integration of GIS-Based RUSLE model for land planning and environmental management in Ranau Area, Sabah, Malaysia. ASM Science Journal, 12(3): 60-69.
[2] Sharir, K., Lai, G.T., Simon, N., Ern, L.K., Madran, E., Roslee, R. (2022). Debris flow susceptibility analysis using a bivariate statistical analysis in the Panataran River, Kg Melangkap, Sabah, Malaysia. IOP Conference Series: Earth and Environmental Science, 1103(1): 012038. https://doi.org/10.1088/1755-1315/1103/1/012038
[3] Yusof, N.F., Lihan, T., Idris, W.M.R., Rahman, Z.A., Mustapha, M.A., Yusof, M.A.W. (2019). Prediction of soil erosion in Pansoon Sub-basin, Malaysia using RUSLE integrated in Geographical Information System. Sains Malaysiana, 48(11): 2565-2574. https://doi.org/10.17576/jsm-2019-4811-26
[4] Roslee, R., Bidin, K., Musta, B., Tahir, S. (2017). Intergration of GIS in estimation of soil erosion rate at Kota Kinabalu area, Sabah, Malaysia. Advanced Science Letters, 23(2): 1352-1356. https://doi.org/10.1166/asl.2017.8400
[5] Sharir, K., Roslee, R. (2025). Integrasi model Pentaksiran Risiko Banjir pasca gempa bumi untuk Kota Belud, Sabah. Bulletin of the Geological Society of Malaysia, 79: 23-33. https://doi.org/10.7186/bgsm79202504
[6] Zhang, K.L., Shu, A.P., Xu, X.L., Yang, Q.K., Yu, B. (2008). Soil erodibility and its estimation for agricultural soils in China. Journal of Arid Environments, 72(6): 1002-1011. https://doi.org/10.1016/j.jaridenv.2007.11.018
[7] Das, B., Bordoloi, R., Thungon, L.T., Paul, A., Pandey, P.K., Mishra, M., Tripathi, O.P. (2020). An integrated approach of GIS, RUSLE and AHP to model soil erosion in West Kameng watershed, Arunachal Pradesh. Journal of Earth System Science, 129(1): 94. https://doi.org/10.1007/s12040-020-1356-6
[8] Balabathina, V., Raju, R.P., Mulualem, W. (2019). Integrated remote sensing and GIS-based Universal Soil Loss Equation for soil erosion estimation in the Megech River Catchment, Tana Lake Sub-basin, Northwestern Ethiopia. American Journal of Geographic Information System, 8(4): 141-157.
[9] Roslee, R., Sharir, K. (2019). Soil erosion analysis using RUSLE model at the Minitod area, Penampang, Sabah, Malaysia. Journal of Physics: Conference Series, 1358(1): 012066. https://doi.org/10.1088/1742-6596/1358/1/012066
[10] Oliveira, P.T.S., Wendland, E., Nearing, M.A. (2013). Rainfall erosivity in Brazil: A review. Catena, 100: 139-147. https://doi.org/10.1016/j.catena.2012.08.006
[11] Waghmare, B., Suryawanshi, M. (2012). Mapping soil erosion risk: Using remote sensing and GIS. IOSR Journal of Applied Geology and Geophysics, 5(3): 1-5. https://doi.org/10.9790/0990-0503020105
[12] Renard, K.G., Foster, G.R., Weesies, G.A., McCool, D.K., Yoder, D.C. (1997). Predicting soil erosion by water: A guide to conservation planning with the Revised Universal Soil Loss Equation (RUSLE). US Government Printing Office. https://www.tucson.ars.ag.gov/unit/publications/PDFfiles/717.pdf.
[13] Djoukbala, O., Hasbaia, M., Benselama, O., Mazour, M. (2019). Comparison of the erosion prediction models from USLE, MUSLE and RUSLE in a Mediterranean watershed, case of Wadi Gazouana (NW of Algeria). Modeling Earth Systems and Environment, 5(2): 725-743. https://doi.org/10.1007/s40808-018-0562-6
[14] Ganasri, B.P., Ramesh, H. (2016). Assessment of soil erosion by RUSLE model using remote sensing and GIS-A case study of Nethravathi Basin. Geoscience Frontiers, 7(6): 953-961. https://doi.org/10.1016/j.gsf.2015.10.007
[15] Sharir, K., Saidin, A., Roslee, R. (2024). Soil erosion analysis for flood disaster assessment using GIS-based RUSLE model in Kota Belud, Sabah, Malaysia. Science, Engineering and Health Studies, 18: 24020005. https://doi.org/10.69598/sehs.18.24020005
[16] Arekhi, S., Shabani, A., Rostamizad, G. (2012). Application of the modified universal soil loss equation (MUSLE) in prediction of sediment yield (Case study: Kengir Watershed, Iran). Arabian Journal of Geosciences, 5(6): 1259-1267. https://doi.org/10.1007/s12517-010-0271-6
[17] Mir, S.I., Gasim, M.B., Rahim, S.A., Toriman, M.E. (2010). Soil loss assessment in the Tasik Chini catchment, Pahang, Malaysia. Bulletin of the Geological Society of Malaysia, 56: 1-7.
[18] Sharir, K., Lai, G.T., Simon, N., Ern, L.K., Talip, M.A., Roslee, R. (2022). Assessment of flood susceptibility analysis using analytical hierarchy process (AHP) in Kota Belud area, Sabah, Malaysia. IOP Conference Series: Earth and Environmental Science, 1103(1): 012005. https://doi.org/10.1088/1755-1315/1103/1/012005
[19] Rendana, M., Rahim, S.A., Idris, W.M.R., Lihan, T., Rahman, Z.A. (2017). Soil erosion assessment in Tasik Chini Catchment using remote sensing and GIS techniques. Sains Malaysiana, 46(4): 529-535. https://doi.org/10.17576/jsm-2017-4604-03
[20] Ahmed, G.B., Shariff, A.R.M., Balasundram, S.K., Abdullah, A.F.B. (2018). Estimation of soil loss in Seremban, Malaysia using GIS and remote sensing technique. IOP Conference Series: Earth and Environmental Science, 169(1): 012062. https://doi.org/10.1088/1755-1315/169/1/012062
[21] Islam, M.R., Jaafar, W.Z.W., Hin, L.S., Osman, N., Din, M.A.M., Zuki, F.M., Srivastava, P., Islam, T., Adham, M.I. (2018). Soil erosion assessment on hillslope of GCE using RUSLE model. Journal of Earth System Science, 127: 50. https://doi.org/10.1007/s12040-018-0951-2
[22] Soo, E.Z.X., Wan Jaafar, W.Z., Lai, S.H., Othman, F., Elshafie, A. (2022). Enhancement of satellite precipitation estimations with bias correction and data-merging schemes for flood forecasting. Journal of Hydrologic Engineering, 27(9): 05022009. https://doi.org/10.1061/(ASCE)HE.1943-5584.0002190
[23] Toh, S.C., Lai, S.H., Mirzaei, M., Soo, E.Z.X., Teo, F.Y. (2023). Sequential data processing for IMERG satellite rainfall comparison and improvement using LSTM and ADAM optimizer. Applied Sciences, 13(12): 7237. https://doi.org/10.3390/app13127237
[24] Kim, J.B., Saunders, P., Finn, J.T. (2005). Rapid assessment of soil erosion in the Rio Lempa Basin, Central America, using the Universal Soil Loss Equation and geographic information systems. Journal of Environmental Management, 36(6): 872-885. https://doi.org/10.1007/s00267-002-0065-z
[25] Panagos, P., Meusburger, K., Ballabio, C., Borrelli, P., Alewell, C. (2014). Soil erodibility in Europe: A high-resolution dataset based on LUCAS. Science of the Total Environment, 479-480: 189-200. https://doi.org/10.1016/j.scitotenv.2014.02.010
[26] Abdo, H., Salloum, J. (2017). Spatial assessment of soil erosion in Alqerdaha basin (Syria). Modeling Earth Systems and Environment, 3: 26. https://doi.org/10.1007/s40808-017-0294-z
[27] da Cunha, E.R., Bacani, V.M., Panachuki, E. (2017). Modeling soil erosion using RUSLE and GIS in a watershed occupied by rural settlement in the Brazilian Cerrado. Natural Hazards, 85: 851-868. https://doi.org/10.1007/s11069-016-2607-3
[28] Imamoglu, A., Dengiz, O. (2017). Determination of soil erosion risk using RUSLE model and soil organic carbon loss in Alaca catchment (Central Black Sea region, Turkey). Rendiconti Lincei, 28(1): 11-23. https://doi.org/10.1007/s12210-016-0556-0
[29] Pham, T.G., Degener, J., Kappas, M. (2018). Integrated Universal Soil Loss Equation (USLE) and Geographical Information System (GIS) for soil erosion estimation in A Sap Basin: Central Vietnam. International Soil and Water Conservation Research, 6(2): 99-110. https://doi.org/10.1016/j.iswcr.2018.01.001
[30] Thomas, J., Joseph, S., Thrivikramji, K.P. (2018). Estimation of soil erosion in a rain shadow river basin in the southern Western Ghats, India using RUSLE and transport limited sediment delivery function. International Soil and Water Conservation Research, 6: 111-122. https://doi.org/10.1016/j.iswcr.2017.12.001
[31] Sharir, K., Saidin, A., Roslee, R. (2025). Flood frequency analysis of Kadamaian and Wariu Rivers in Kota Belud, Sabah, Malaysia. Nature Environment and Pollution Technology, 24(2): D1691. https://doi.org/10.46488/NEPT.2025.v24i02.D1691
[32] Zhu, W., Zeng, N., Wang, N. (2010). Sensitivity, specificity, accuracy, associated confidence interval and ROC analysis with practical SAS implementations. In NESUG: Health Care and Life Sciences, 19.
[33] Landis, J.R., Koch, G.G. (1977). The measurement of observer agreement for categorical data. Biometrics, 33(1): 159-174.
[34] Wischmeier, W.H., Smith, D.D. (1978). Predicting Rainfall Erosion Losses: A Guide to Conservation Planning (No. 537). Department of Agriculture, Science and Education Administration.
[35] Wischmeier, W.H., Smith, D.D. (1965). Predicting Rainfall-Erosion Losses from Cropland East of the Rocky Mountains: Guide for Selection of Practices for Soil and Water Conservation (No. 282). Agricultural Research Service, US Department of Agriculture.
[36] Williams, J.R. (1975). Sediment routing for agricultural catchments. Water Resources Bulletin, 11(5): 965-974. https://doi.org/10.1111/j.1752-1688.1975.tb01817.x
[37] Van Remortel, R.D., Hamilton, M.E., Hickey, R.J. (2001). Estimating the LS factor for RUSLE through iterative slope length processing of digital elevation data within ArcInfo Grid. Cartography, 30(1): 27-35. https://doi.org/10.1080/00690805.2001.9714133
[38] Lee, G.S., Lee, K.H. (2006). Scaling effect for estimating soil loss in the RUSLE model using remotely sensed geospatial data in Korea. Hydrology and Earth System Sciences Discussions, 3(1): 135-157. https://doi.org/10.5194/hessd-3-135-2006
[39] Fu, G., Chen, S., McCool, D.K. (2003). Soil erosion and its response to no-till practice estimated with ArcView GIS. Transactions of the ASAE, 46(3): 765-772.
[40] Hrissanthou, V. (2005). Estimate of sediment yield in a basin without sediment data. Catena, 64(2-3): 333-347. https://doi.org/10.1016/j.catena.2005.08.014