Temporal Analysis and Source Apportionment of PM2.5/PM10 Pollution at an Urban Traffic Hotspot: A Comparative Study in Tirana, Albania

Edlira Baraj![]() | Denisa Salillari*
| Denisa Salillari*![]() | Luela Prifti
| Luela Prifti![]() | Raimonda Totoni Lilo
| Raimonda Totoni Lilo![]() | Edlira Tako
| Edlira Tako![]()
© 2025 The authors. This article is published by IIETA and is licensed under the CC BY 4.0 license (http://creativecommons.org/licenses/by/4.0/).
OPEN ACCESS
Nowadays the human health and everyday quality of life are closely related to air quality as one of the major environmental issues. Suspended particles can cause many problems in human health by penetrating deep into the lungs and causing respiratory issues, asthma, allergies, and even severe damage to the cardiovascular system. In this paper, we use statistical analysis to estimate the urban air pollution from PM2.5 and PM10 in Vasil Shanto cross-road in Tirana in the month of April 2024. Sampling filters have been collected every 24 hours during weekdays and 48 hours on the weekends. Concentrations of PM10 range from 25.62 µg/m³ to 69.03 µg/m³, with an average value of 42.96 µg/m³, while the values for PM2.5 range from 13.10 µg/m³ to 63.79 µg/m³, with an average of 30.34 µg/m³. Such concentrations are significantly above the standard limits, indicating a high level of pollution in the Vasil Shanto cross-road area, and the ratio between PM2.5/PM10 indicates that the primary source of pollution in this area is the fuel burning from transport vehicles. The value of Fisher’s test, F=0.39343 and a p-value of 0.03179, indicates that the variances for PM10 concentrations in April 2024 and April 2013 are significantly different at the 0.05 significance level. The results of Welch's t-test with a t-value of -0.7502 and a p-value of 0.4582 indicate a non-statistically significant difference in the mean PM10 concentrations between 2024 and 2013. Human exposure to high levels of air PM could pose significant health risks, necessitating a combination of measures at various levels, from individual actions to governmental policies, to improve air quality in the city.
statistical test, air pollution, PM2.5, PM10
Urban air pollution is the source of many problems, including human health risks from inhalation of gases and particles, accelerated corrosion and deterioration of materials, damage to monuments and historic buildings, and damage to vegetation in and around the cities [1]. Burning wood, diesel, and other fuels and open burning releases particulate matter into the atmosphere, generally in the form of smoke. In addition, dust from agricultural operations, unpaved roads, and dust storms contains significant amounts of PM10 [2-4]. Inhalation of PM10 can cause nose and throat irritation, bronchitis, and damage to lung tissue. Finer particles (PM2.5) travel deep into the lungs and cause or worsen respiratory problems such as asthma and chronic bronchitis [5, 6]. PM2.5 particles are formed mainly by the combustion of fuels in motor vehicles, by the production of energy in thermal power plants, by various industrial processes, and by the use of firewood and gas for cooking and heating. Research has shown that gases such as sulfur dioxide (SO2), nitrogen oxides (NOX), and volatile organic compounds (VOC) interact with other compounds in the air to form fine particulate matter (PM). In Europe, air pollution is seen as the main environmental risk to the health of the population, as it causes respiratory and cardiovascular diseases, which in the most severe cases lead to premature death [7]. This phenomenon affects the entire population, but the most vulnerable groups are most at risk, such as children and the elderly, people with a history of certain diseases, as well as those who live in areas with higher levels of pollution and who, in general, live in more difficult socio-economic conditions [8-10]. The Western Balkans are air pollution hotspots in Europe with levels of PM2.5, PM10, NO2, and O3 that often exceed the EU safety limits of air quality. This isn’t just an environmental issue; it is a serious health crisis. Studies have indicated that air pollution in the Region is directly related to respiratory diseases and other serious health problems [10-12]. Air pollution, especially fine particulate matter, can increase the risk of infection with some viruses, as fine particles can remain in the air for long periods, can travel long distances, and can also penetrate deep into the lungs. Research on SARS-CoV-1 and SARS-CoV-2 has demonstrated that air pollution is a major contributor to disease severity. Such pollution, especially with PM2.5, combined with excessive urbanization and vehicle density in Albania, has been associated with increased risk and severity, not only of viral infections, including COVID-19 [6], but also with a higher rate of Chronic Obstructive Pulmonary Disease (COPD) prevalence in the country [13].
The fact that in 2020, the 96% of the European Union population was exposed to levels of PM higher than those set out in the World Health Organization guidelines [9], imposed the overall objective in the European Commission's action plans that the air pollution in Europe, by 2030, would be reduced to levels that are considered harmless to the health of the population and to natural ecosystems. Therefore, the limits that can be met by our planet will be maintained and respected, and an environment free from toxins will be created [14].
In Albania, for the period 2017– 2024, a significant increase in the number of deaths has been observed for the years 2020 and 2021, by 6.414 and 9.316, respectively, compared to the average of 21.191 deaths in the previous three-year period 2017-2019 [15]. It is likely that this higher number reflects the true number of lives lost due to COVID-19 and/or its consequences.
The categorization and rate of morbidity and mortality in Albania and the evaluation of the main factors, among them those factors related to air pollution and their impact on human diseases, such as tumors, respiratory and circulatory diseases, have carried out in previous studies [11, 13, 16]. According to INSTAT reports [15], we demonstrate that the percentage ratio of these diseases and the mortality rate associated with them have changed in the period 2017-2024 (Figure 1).
Figure 1. Main diseases and rate of mortality in Albania during the period 2017-2024 (Source: INSTAT, Annual reports)
Despite the fact that cardiovascular diseases still remain the main cause of death in Albania, in 2020 and 2021 there is a significant increase, by about 4 times, in respiratory diseases, with an average of 10.35% deaths from respiratory diseases over the total of deaths for those two years, compared to an average of 2.56% for the rest of the period.
In this paper, we have used statistical analysis to estimate the urban air pollution from PM2.5 and PM10 in April 2024, in Vasil Shanto cross-road in Tirana. A comparison between April 2013 and April 2024 data in the same sampling site has been carried out as well, by using statistical tests. The use of statistical analysis for air quality control and monitoring data provides the best way to understand the pollution problems and their sources, so they can be effectively addressed at local, national, and international levels.
Samples of PM10 and PM2.5 were collected during April 2024 in Vasil Shanto cross-road, which is situated in the western part of Tirana city centre, in a relatively high traffic density zone. Sampling was performed by using a Tecora ECHO PM2.5/PM10 simultaneous air sampler with an average flow rate of 38.33 L/min, at a level of 3.2 m from the ground.
Measurements are taken over a sampling period of approximately 24 hours, with some exceptions extending to 48 hours at weekends. The results are expressed in µg/m³, with the air volume being measured under ambient conditions near the sampling inlet at the time of collection. For the determination of PM10 and PM2.5, Sartorius glass fibre filters with a separation efficiency greater than 99.5% are used. Control and blank filters are also included, following the same procedure. Filters were previously placed in a desiccator for 48 hours to remove excess moisture and then weighed (both before and after sampling). The difference in filter weights before and after sampling has been considered for the calculation of PM values.
Descriptive statistics have been used for the content of PM2.5 and PM10 in Vasil Shanto cross-road during the period 01.04.2024 - 02.05.2024. Statistical tests of Fisher and Welch's t-test have been used to compare the content of PM10 in the same sampling site, and for the same period of the year (month of April) in both years 2013 and 2024.
To evaluate the normality of PM10 contents in 2024 and 2013, the Shapiro-Wilk normality test was used. The normality distribution was confirmed at p-value > 0.05. The Fisher test was calculated by taking the ratio of the two groups' variances, as $F=\frac{S_{1}^{2}}{S_{2}^{2}}$ to verify if both populations of PM10 contents in 2024 and 2013 have equal variances. The above statistic follows an $F$ - distribution with degrees of freedom scaled by the ratio of true variances and p-value<0.05, to confirm that the variances are not equal.
To test the null hypothesis that the difference of the mean levels of PM10 between the years 2024 and 2013 is null, Welch's $t$ - test has been defined by the statistic in formula (1):
$t=\frac{{{{\bar{X}}}_{1}}-{{{\bar{X}}}_{2}}}{\sqrt{\frac{S_{1}^{2}}{{{n}_{1}}}\text{ }\!\!~\!\!\text{ }+\text{ }\!\!~\!\!\text{ }\frac{S_{2}^{2}}{{{n}_{2}}}}}$ (1)
where, ${{\bar{X}}_{i}},s_{i}^{2},{{n}_{i}},\text{ }\!\!~\!\!\text{ }i=1,2\text{ }\!\!~\!\!\text{ }$are respectively the sample means, the sample variances, and the sample sizes for each of the two groups under study [17].
For Welch’s t-test, the degrees of freedom (df) are given by formula (2):
$df=\frac{{{\left( \frac{S_{1}^{2}}{{{n}_{1}}}+\frac{S_{2}^{2}}{{{n}_{2}}} \right)}^{2}}}{\frac{{{\left( \frac{S_{1}^{2}}{{{n}_{1}}} \right)}^{2}}}{{{n}_{1}}-1}+\frac{{{\left( \frac{S_{2}^{2}}{{{n}_{2}}} \right)}^{2}}}{{{n}_{2}}-1}}$ (2)
Formula (2), known as Welch Satterthwaite equation, adjusts for unequal variances and sizes between the two samples, providing a more accurate assessment of statistical significance. The hypothesis of Welch’s t-test provides information that there is insufficient evidence in support of the alternative hypothesis that two populations have unequal means, and therefore, the means of PM10 between those years are equal at p-value>0.05.
The measured data of PM10 and PM2.5 at the "Vasil Shanto" cross-road in Tirana, during the period 01.04.2024-02.05.2024, are graphically presented in Figure 2.
Figure 2. Values of PM10 and PM2.5 during the period 01.04.2024-02.05.2024
Both PM10 and PM2.5 values in the abovementioned period and sampling site are generally high, very close to, or even above the limits established in European and Albanian standards.
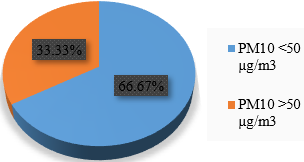
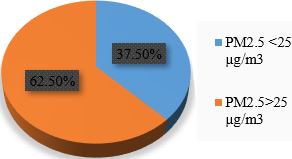
The proportion of PM values within and above the permitted limits (EU standards) is presented schematically in Figure 3. It can be observed that in the time period of our study, the content of PM10 is 66.67% within the EU limits and 33.33% outside them, while 62.50% of PM2.5 values are above the EU limits and only 37.50% comply with them. Such a finding still indicates the high degree of pollution with PM2.5 particles and, therefore, the possible high risks they might present to the health of the population in this area.
Figure 3. Ratio of PM10 and PM2.5 compared with EU standards
Table 1. Summary of descriptive statistics for PM2.5 /PM10 ratio
|
Descriptive Statistics |
PM2.5/PM10 Ratio |
|
Minimum |
0.5040 |
|
1st Quartile |
0.6387 |
|
Median |
0.6936 |
|
Mean |
0.6947 |
|
3rd Quartile |
0.7507 |
|
Maximum |
0.9241 |
The correlation between PM2.5 and PM10 concentrations was remarkably strong, with a correlation coefficient of 0.9158. We can estimate the ratio between PM2.5 and PM10 to gain a deeper understanding of air pollution in the area. Some Descriptive Statistics for the ratio between the daily content of PM10 and PM2.5 are presented in Table 1.
If we look at the ratios between the daily content of PM10 and PM2.5, we notice that PM2.5 occupies a significant part of the total PM10 value (on average 69.47% for the entire period under study), which shows that the main source of urban air pollution in this area is the means of transport. According to INSTAT [18], the number of registered vehicles in the Tirana region increased by 8.7% from 2022 to 2023, followed by an additional 2.3% rise in the first quarter of 2024. By the end of Q1 of 2024, the total number of transport vehicles in Albania had reached 887,321, compared to 445,956 in the same period of 2013, marking a significant rise of 98.9%. Furthermore, over 90% of vehicles on Albanian roads continue to rely on traditional fuels, such as diesel and gasoline [18]. These increases in vehicle numbers and the continued reliance on fossil fuels are key contributors to the air pollution in the area. Additionally, the presence of ongoing construction activities leads to the generation of heavier particulate matter and dust, further exacerbating the situation. The 95% confidence interval for the PM2.5/PM10 ratio is 0.6489536; 0.7403840, indicating that approximately 65% to 74% of the total particulate matter (PM10) consists of fine particles (PM2.5). Ratios above 0.5 are typically associated with anthropogenic sources, such as coal combustion, heavy industrial activity, and urban traffic, all of which emit a higher proportion of fine particles [19].
This observed ratio is considered moderate to high, suggesting a significant level of air pollution, likely dominated by vehicle emissions and industrial pollutants in the area, confirming the above findings.
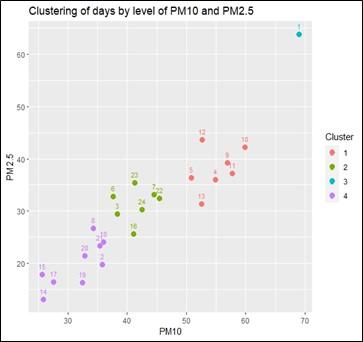
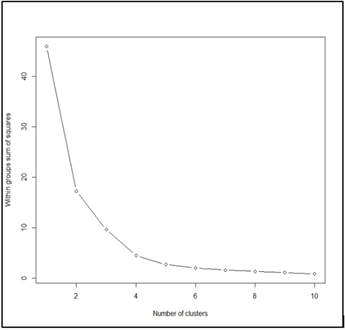
In Figure 4(a), the distribution of days by levels of PM10 and PM2.5 using Cluster Analysis is presented. We have grouped the days into 4 clusters by the levels of PM10 and PM2.5 by applying the K-means algorithm. The optimal number of clusters is achieved using the Elbow method, as it is presented with an elbow at k=4 in Figure 4(b).
(a)
(b)
Figure 4. (a) Classification of levels of PM2.5 and PM10 with the K-means method, (b) Elbow method for optimal clustering in K-means
The highest levels of PM2.5 and PM10 are observed on the first day. The lowest levels with at most 27 µg/m3 of PM2.5 concentration and at most 37µg/m3 of PM10 concentration are observed during nine days, including the consecutive days from the 14th day to the 21st day, presented in Figure 4(a) by dots in purple colour. The cluster with dots in green colour presents seven days with moderate levels of PM2.5 concentration from 25 µg/m3 to 35.5 µg/m3 and PM10 concentration levels between 37.6 µg/m3 to 45.5 µg/m3, including consecutive days from the 9th day to the 12th day.
The seven remaining days exceed the moderate levels. In this cluster, the levels of PM2.5 vary from 31 µg/m3 to 43.7 µg/m3, and levels of PM10 vary from 50 µg/m3 to 60 µg/m3.
All the days in this cluster are sunny days except the 16th day, which is a rainy day. From the clustering analysis, we estimate that particulate matter (PM) levels remained at or below moderate levels 66.67% of the time, while exceeding the moderate levels 33.33% of the time under study.
The Summary of Descriptive Statistics for PM2.5 and PM10 in Vasil Shanto cross-road for the period 01.04.2024-02.05.2024 is presented in Table 2.
Table 2. Summary of descriptive statistics for PM2.5 and PM10
|
Descriptive Statistics |
PM10 (µg/m3) |
PM2.5 (µg/m3) |
|
|
Mean |
42.96186691 |
30.34188 |
|
|
Standard Error |
2.371864073 |
2.265866 |
|
|
Median |
41.20774843 |
30.78777 |
|
|
Standard Deviation |
11.61971344 |
11.10043 |
|
|
Sample Variance |
135.0177403 |
123.2196 |
|
|
Kurtosis |
-0.52333251 |
2.242373 |
|
|
Skewness |
0.432169664 |
0.970009 |
|
|
Range |
43.41311272 |
50.69481 |
|
|
Minimum |
25.61789645 |
13.09505 |
|
|
Maximum |
69.03100917 |
63.78987 |
|
|
Sum |
1031.084806 |
728.205 |
|
|
Count |
24 |
24 |
|
|
Confidence Level (95.0%) |
4.906574665 |
4.687302 |
|
The average value for the content of PM2.5 is 30.34 ± 2.266 (µg/m3), which is above the European and Albanian norms (25 µg/m3), while for PM10 it is 42.96 ± 2.372 (µg/m3), being is an average within the norms (50 µg/m3 for PM10).
However, even PM10 values (averaged) are above the limit of 70% of the maximum value (or 35 µg/m3), as a possible value to be exceeded only 3 days per month [20]. The PM values are much above the WHO guidelines [21], corresponding with the findings in a previous study for the air quality in Tirana [22]. From the graph in Figure 2, it can be clearly observed that these exceedances are to a significant extent for both parameters. The minimum and maximum values for PM2.5 in the period under study have been 13.10 µg/m3 and 63.79 µg/ m3, respectively, whilst a minimum of 25.62 µg/m3 and a maximum of 69.03 µg/m3 have been measured for PM10 during the same period.
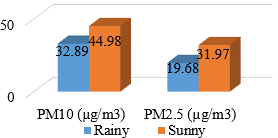
Considering that the values of the above data can be affected by weather conditions, we have also compared the measurements on sunny and rainy days for the PM2.5 and PM10 and presented them in Figure 5. As it is seen in Figure 5 the average value of PM10 content on sunny days turns out to be 44.98 µg/m3, while on rainy days it is 32.89 µg/m3, as for PM2.5, the results are as follows: the average value of PM2.5 content is sunny days is 31.97 µg/m3, whilst in the rainy days is, 19.68 µg/m3.
Figure 5. The average values of PM10 and PM2.5 on sunny and rainy days
It can be clearly observed that on sunny days, the concentrations of PM10 and PM2.5 are higher compared to those on rainy days, as also presented in the boxplots of Figure 6. The average value for PM10 in sunny days is 44.50 µg/m3 and in rainy days 39.88 µg/m3, whilst for PM2.5, such values are 32.43 µg/m3 and 26.17 µg/m3 respectively, due to the rainfall, which can reduce the concentrations of airborne particles by washing them out of the atmosphere. Rain acts like a natural air purifier, washing away pollution particles from the air. This washout effect explains why PM levels drop after rainfall, especially for the tiny, dangerous PM2.5 particles, which decrease 19% compared to just 10% for larger PM10, possibly due to their floating longer in the air.
Figure 6. Boxplots of PM10 and PM2.5 on sunny and rainy days
Additionally, rainfall may alter emission patterns, as wet conditions suppress road dust resuspension and temporarily reduce vehicular emissions. Overall, PM levels have only slightly decreased, likely due to reduced construction activities, particularly roadworks, when comparing 2024 to 2013. However, persistent sources, such as fuel combustion from diesel and gasoline vehicles, continue to dominate, as indicated by the PM2.5/PM10 ratio of 0.65 to 0.74, which remains above 0.5. This finding is further supported by data showing that the number of transport vehicles nearly doubled during the comparative periods [18].
A comparison of the data for the sunny period before the rainy days, with the rainy period itself, has been carried out. The average content of PM10 (for a period of 5 days before the rain) is 55.93 µg/m3 (much higher than the standard) and is almost halved on rainy days, at the value of 28.76 µg/m3. Similar findings are observed for PM2.5, where the averages are 38.73 µg/m3 and 17.88 µg/m3, respectively. The greater variation of PM2.5 and PM10 concentrations on sunny days shows that clear weather conditions can bring different levels of air pollution, perhaps due to other factors such as wind, industrial activities, etc., while the traffic of means of transport is almost the same and, therefore, its impact on urban air pollution remains the same. This is also proven by the fact that we have a smaller variation in PM2.5 concentrations than in PM10 concentrations.
PM10 concentration data for the month of April in two separate years: from 01.04.2013 to 30.04.2013 and from 01.04.2024 to 02.05.2024, have been compared. As presented graphically in Figure 7, there is a difference between the sets of measurements. The data for 2024 shows more stable PM10 values compared to those of 2013. This indicates that factors such as traffic still remain significantly influential and almost unchanged, while the role of other sources of pollution, such as road construction, or possible waste burning in that area in the open air, is reduced.
Figure 7. Boxplots of PM10 in 2024 and 2013
For the data of PM10 contents in 2024 and 2013, the Shapiro-Wilk normality test resulted respectively W=0.96005 at p-value=0.4394 and W=0.95808 at p-value=0.4515, confirming the normal distribution of the PM10 contents in 2024 and 2013.
When comparing the variances of PM10 content in 2024 and 2013, the F test resulted in a value of 0.39343, df=23, and a p-value of 0.03197. This indicates that the variances of the two populations are significantly different at the 0.05 significance level. Given this result, it would be more appropriate to use the Welch's t-test for comparing the means of the two populations [17].
The Welch's t-test value (t=-0.7502, df=34.751, p-value=0.4582) indicates that there is no statistical difference between PM10 values in 2024 and 2013. Therefore, the levels of PM10 between those years are considered statistically similar.
From the evaluation of the measurements for the determination of the content of suspended solid matter in the urban air of the city of Tirana and, respectively, the content of PM10 and PM2.5 in the "Vasil Shanto" cross-road, as well as from the comparison of the results obtained with the results of previous studies in this area, we conclude that:
The values measured in the “Vasil Shanto” cross-road during April 2024 show a daily PM10 content ranging from 25.62 µg/m3 to 69.03 µg/m3, with an average value of 42.96 µg/m3, while for PM2.5, they range from 13.10 µg/m3 to 63.79 µg/m3, with an average of 30.34 µg/m3. It is estimated that the PM10 content is within EU and Albanian standards on 66.67% of the days, while it is above the allowed limit of 50 µg/m3 on 33.33% of the days, and the PM2.5 content exceeds the maximum allowed limits of 25 µg/m3 on 62.5% of the monitored days. This indicates a high level of urban air pollution in this area with PM10 and PM2.5 particles.
The average PM2.5/PM10 ratio of 69.47% indicates that PM2.5 particles dominate suspended particulates, posing significant health risks. This highlights vehicle fuel combustion as the primary source of air pollution in the area.
Despite the fact that there is no statistical difference when comparing the concentration data for PM10 for the same month (April) in 2013 and in 2024 (the Welch's t-test value, t=-0.7502, and p-value=0.4582), more stable PM10 values have been observed in 2024. This indicates that factors such as traffic remain significantly influential and almost unchanged, while the role of other factors, such as pollution due to construction or road works, is lower.
Continuous exposure to PM2.5 and PM10 levels beyond the recommended WHO and EU thresholds is associated with significant health risks and severe diseases. A coordinated, evidence-based approach is crucial for mitigating air pollution and safeguarding public health in Tirana and beyond. Community initiatives, such as expanding green spaces and supporting clean air projects, coupled with government actions like investing in sustainable transport and eco-friendly policies, are essential for improving air quality.
This work is supported by the Polytechnic University of Tirana and NASRI under the Project “Strengthening the Research Infrastructure at the Department of Chemical Engineering, FIMIF-UPT, as a necessary tool to achieve academic and research standards”.
[1] Totoni, R., Baraj, E. (2013). Study of PM10 levels in urban air of Tirana (Vasil Shanto Cross-Road) and statistical analysis of data collected. In the 1st International Conference on Research and Educatıon – Challenges Toward the Future (ICRAE2013), University of Shkodra “Luigj Gurakuqi”, Shkodra, Albania.
[2] Totoni Lilo, R., Baraj, Gjeci, V., Fusha, G.J. (2017). Study of PM2.5 and PM10 mass concentration in Korça City. In ATINER'S Conference Paper Series ENV2017-2302, No: ENV2017-2302.
[3] Mandija, F. (2013). Particulate matter concentrations over the region of North-West of Albania. Journal of Materials and Environmental Science, 4(6): 915-920.
[4] Milošević-Pantović, A., Ignjatović, Z., Stevanović, V. (2024). Air quality evaluation: Insights from case studies in Belgrade. Advanced Technologies, 13(2): 67-75. https://doi.org/10.5937/savteh2402067m
[5] Schraufnagel, D.E. (2020). The health effects of ultrafine particles. Experimental & Molecular Medicine, 52: 311-317. https://doi.org/10.1038/s12276-020-0403-3
[6] Baraj, E., Shehu, S., Totoni, R., Xhaxhiu, K., Baraj, B. (2023). A review regarding the correlation of air pollution with COVID-19. Journal of Hygienic Engineering and Design, 45: 115-121.
[7] Ćujić, M., Ćirović, Ž., Djolić, M., Janković-Mandić, L., Radenković, M., Onjia, A. (2023). Assessment of the burden of disease due to PM2.5 air pollution for the Belgrade district. Thermal Science, 27(3): 2265-2273. https://doi.org/10.2298/tsci220131104c
[8] EEA Report No 22/2018. Unequal exposure and unequal impacts: Social vulnerability to air pollution, noise and extreme temperatures in Europe. Publications Office. https://doi.org/10.2800/324183
[9] EEA 2022/2. Sources of Air Pollution. https://www.eea.europa.eu/publications/air-quality-in-europe-2022/sources-and-emissions-of-air.
[10] Vulović, J., Knežević, S., Jandrić-Kočić, M. (2023). Air pollution and its impact on human health: An overview of the situation in the Republic of Serbia. Medical Bulletin of the Special Hospital for Thyroid and Metabolic Diseases 'Zlatibor', 28(91): 7-32. https://doi.org/10.5937/mgiszm2391007v
[11] Belis, C.A., Ballocci, M., Matković, V., Millo, G., Jevtic, M., Van Dingenen, R. (2022). Costs of air pollution impact on health in the Western Balkans: Preliminary results. European Journal of Public Health, 32(Supplement_3). https://doi.org/10.1093/eurpub/ckac129.144
[12] Babic, A., Pirić, N., Imamović, E. (2024). Analysis of atmospheric concentrations of PM 10 and PM 2.5 and their impact on the health status of the population in urban industrial cities of Bosnia and Herzegovina, In MEDICON’23 and CMBEBIH’23, pp. 877-882. https://doi.org/10.1007/978-3-031-49062-0_91
[13] Shehu, E., Farruku, H., Smaili, H. (2022). Air pollution and socio-economic determinants of chronic obstructive pulmonary disease in Albania. Current Health Sciences Journal, 48(1): 51-56. https://doi.org/10.12865/CHSJ.48.01.07
[14] EU. (2022). Proposal for a directive of the European parliament and of the council on ambient air quality and cleaner air for Europe. COM/2022/542 final. https://eur-lex.europa.eu/legal-content/EN/TXT/?uri=celex:52022PC0542.
[15] INSTAT. Causes of deaths 2017 – 2024. https://www.instat.gov.al/en/themes/social-condition/health/#tab3.
[16] Xhemalaj, D., Gradica, F., Skenduli, I., Tula, J., et al. (2023). Lung cancer in Albania. Journal of Thoracic Oncology, 18(12): 1632-1637. https://doi.org/10.1016/j.jtho.2023.08.023
[17] Freedman, D., Pisani, R., Purves, R. (1998). Roger Purves. University of California, Berkeley.
[18] INSTAT. Road Transport Statistics Q1 - 2024. https://www.instat.gov.al/en/themes/industry-trade-and-services/transport-accidents-and-characteristics-of-road-vehicles/publikimet/2024/road-transport-statistics-q1-2024/.
[19] Cabello-Torres, R.J., Carbo-Bustinza, N., Romero-Cabello, E.A., Ureta Tolentino, J.M., et al. (2024). An exploratory analysis of PM 2.5/PM 10 ratio during spring 2016–2018 in Metropolitan Lima. Scientific Reports, 14(1): 9285. https://doi.org/10.1038/s41598-024-59831-9
[20] EUC. (2019). Communication from the commission to the European parliament, the European council, the council, the European economic and social committee and the committee of the regions the European Green Deal. COM/2019/640 final. https://eur-lex.europa.eu/legal-content/EN/TXT/?uri=CELEX:52019DC0640.
[21] World Health Organization. (2021). WHO global air quality guidelines: Particulate matter (PM2.5 and PM10), ozone, nitrogen dioxide, sulfur dioxide and carbon monoxide. World Health Organization. https://iris.who.int/handle/10665/345329.
[22] Kika, A., Shehu, A., Kane Shehu, S., Lazo, P. (2023). A preliminary study on assessment of air quality in Tirana, Albania. Zastita Materijala, 64(4): 402-412. https://doi.org/10.5937/zasmat2304402K