Haneafa Yahya Najem*![]() | Raad A. Rasool
| Raad A. Rasool![]() | Mohanad Natheer Zubair Mala
| Mohanad Natheer Zubair Mala![]() | Ali M. Saadi*
| Ali M. Saadi*![]()
© 2025 The authors. This article is published by IIETA and is licensed under the CC BY 4.0 license (http://creativecommons.org/licenses/by/4.0/).
OPEN ACCESS
This study indicates that SCAPS-1D software simulated perovskite solar cells to monitor their temperature and light wavelength reactions under monochromatic light at 400 nm, 450 nm, and 500 nm. The short-circuit current density (Jsc), open-circuit voltage (Voc), fill factor (FF %), and power conversion efficiency (PCE) were assessed across a temperature range of 290K to 340K. At 290K, the peak PCE values attained were 25.15% at 450 nm, 24.71% at 500 nm, and 22.30% at 400 nm; however, the open-circuit voltage (Voc) diminished by almost 20% on average across all wavelengths when the temperature rose to 340K. Longer wavelengths, particularly at 450 nm and 500 nm, enhanced performance marginally—by approximately 2–3% in power conversion efficiency—relative to 400nm, owing to greater light penetration and less surface recombination. Nonetheless, elevated temperatures markedly diminished Voc, FF %, and PCE, chiefly due to heightened recombination and reverse saturation current. At 300K, the fill factor (FF %) reached a maximum of 85.3% for 450 nm, 85.3% for 500 nm, and 85.0% for 400 nm, thereafter decreasing to approximately 84.0–84.5%. The results validate that heat degradation and spectrum response are critical determinants influencing the performance of perovskite solar cells. This study underscores the necessity of enhancing thermal stability and spectrum absorption to get high-efficiency and stable perovskite solar cells.
SCAPS-1D modeling, perovskite-based solar cells, thermal performance, spectral response, stability
The rapid advancement of photovoltaic (PV) technology has positioned perovskite solar cells (PSCs) as the foremost next-generation solar energy conversion devices. This is due to its ease of fabrication and high power conversion efficiency (PCE) [1].
Perovskite solar cells (PSCs), identified in the early 2010s, exhibit variable bandgap properties alongside enhanced optoelectronic performance, attaining efficiencies similar to conventional silicon solar cells [2, 3]. The temperature (T) and the incoming light spectrum (λ) significantly influence the performance and longevity of PSC devices. Further investigation is necessary to enhance our understanding of them, which will facilitate improved sales and development. The performance of perovskite solar cells (PSCs) across various spectra is influenced by their morphology and bandgap (Eg). This describes the process by which various wavelengths of light can be converted into electricity. The bandgap (Eg) of perovskite materials typically ranges from 1.1 eV to 2.3 eV and makes available the spectral match with the solar spectrum of the emitted light, allowing for an implementation in a tandem cell configuration [4, 5]. The spectrum of sunlight, which varies based on geographic location and weather conditions, directly influences the operational efficiency and overall performance of the device. The external quantum efficiency (EQE) spectrum is a critical method for analyzing the variation of response with wavelength.
The fundamental photovoltaic process in perovskite solar cells (PSCs) entails the separation and movement of electron-hole pairs (e--h+), resulting in the generation of current. The Shockley-Queisser (SQ) limit, which is the theoretical maximum efficiency threshold of 34.9% for concentrated sunlight and 32.6% for non-concentrated sunlight, is contingent upon the solar spectrum and the band-gap (Eg) [6, 7]. For an optimal device under 1.5G light (1000 W/m²), the greatest theoretical efficiency (ηmax) can be expressed as:
$\eta_{\max }=\frac{q \times V_{o c} \times J_{s c} \times F F}{P_{i n}}$
where,
$q$: elementary charge ($1.602 \times 10^{-19}$ C)
$V_{o c}$: Open-circuit voltage (depends on bandgap (Eg))
$J_{s c}$: Short-circuit current density (depends on (Eg))
FF: Fill factor (depends on (Voc))
$P_{i n}$: Incident solar power density
$\eta_{\max (E g)} \approx E_g^2 \cdot e^{\frac{-E_g}{E_0}}$
where,
E0 ≈ 0.9 eV
This expression reflects the trade-off between increasing voltage (Voc) (with higher Eg) and decreasing current $J_{s c}$ (fewer photons absorbed). The optimum bandgap for maximum efficiency is ≈1.34 eV, yielding ηmax ≈ 33.7% [8].
The temperature dependence of (Voc) is given by:
$V_{o c}(T)=\frac{k B T}{q} \ln \left(\frac{J_{s c}}{J_o(T)}+1\right)$
where,
$k B$: Boltzmann constant (1.38×10⁻²³ j/k).
$T$: Absolute temperature (k).
$J_{s c}$: Short-circuit current density (weakly dependent on t).
$J_o$(T): Temperature-dependent reverse saturation current density [9-11].
Recent advances in bandgap engineering and spectral tuning have enhanced the efficiency and thermal stability of PSCs. Techniques such as compositional texture engineering minimize phase segregation, enabling stable wide-bandgap perovskites with PCEs > 20% and the superior operational lifetimes under thermal stress [12-14]. Meanwhile, advancements in manufacturing processes such as gas-quenched crystal growth have also improved crystal quality and lower defect densities, thus lessening performance losses from temperature (T) and spectral variation ($\lambda$) [15]. This study investigates the coupled effects of temperature (T) and spectrum ($\lambda$) on PSCs performance using SCAPS-1D simulation, of analyzing their impact on fill factor (FF) and efficiency (η).
2.1 Device modeling and structure
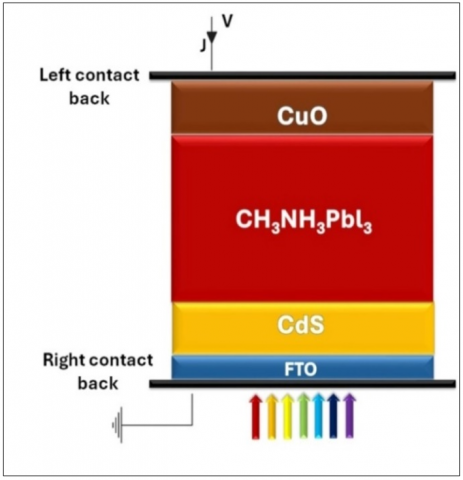
We modeled a generic thin-film perovskite solar cell using the SCAPS-1D simulation software. The device structure consisted of several layers arranged as FTO/CdS/CH3NH3PbI3/CuO, as shown in Figure 1.
Figure 1. SCAPS-1D program for the cell used
The material parameters, such as layer thicknesses, doping concentrations, bandgap energies, permittivity, and defect densities, were chosen according to standard values found in the literature and are presented in Table 1.
Table 1. Material parameters used in the solar cell simulation
|
Parameter/Unit |
FTO |
CdS |
CH₃NH₃PbI₃ (Perovskite) |
CuO |
|
Thickness µm |
0.01 |
1.2 |
3.2 |
1.2 |
|
Bandgap eV |
3.2 |
2.45 |
1.55 |
1.51 |
|
Electron Affinity eV |
4.4 |
4.45 |
3.9 |
4.07 |
|
Relative permittivity — |
9 |
10 |
6.5 |
18.1 |
|
effective density of states CB 1/cm³ |
1.20×10¹⁸ |
1.00×10¹⁸ |
2.20×10¹⁷ |
3.10×10¹⁷ |
|
effective density of states V.B 1/cm³ |
7.80×10¹⁸ |
1.50×10¹⁵ |
1.80×10¹⁷ |
5.50×10¹⁷ |
|
Electron thermal velocity cm/s |
1.00×10⁷ |
1.00×10⁷ |
1.00×10⁷ |
1.00×10⁷ |
|
Hole thermal velocity cm/s |
1.00×10⁷ |
1.00×10⁷ |
1.00×10⁷ |
1.00×10⁷ |
|
Electron Mobility cm²/V·s |
20 |
50 |
2 |
20 |
|
Hole Mobility cm²/V·s |
100 |
20 |
2 |
10 |
|
Shallow uniform donor density Nd 1/cm³ |
1.00×10¹⁹ |
1.00×10¹⁶ |
0 |
0 |
|
Shallow uniform acceptor density Na 1/cm³ |
0 |
0 |
1.00×10¹⁹ |
1.00×10¹⁷ |
|
Defect type — |
Single Donor |
Single Donor |
Single Acceptor |
Single Acceptor |
2.2 Illumination and wavelength selection
The solar cell was exposed to monochromatic light with an intensity of 1 sun (1000 W/m²). We chose three different wavelengths: 400 nm (blue), 450 nm (cyan), and 500 nm (green). This choice was made because these wavelengths are important parts of the visible spectrum that affect how carriers are made and how deeply they can be absorbed in different ways.
Shorter wavelengths (400 nm) don't penetrate very far, so they make carriers close to the surface, which speeds up surface recombination.
Longer wavelengths (450 nm and 500 nm) penetrate more deeply, creating carriers more evenly, which affects charge transport and recombination in different ways.
This focused methodology enables a comprehensive analysis of spectral and thermal effects, free from the unnecessary complexities linked to the entire solar spectrum [16-18].
2.3 Temperature range and simulation settings
Simulations were performed throughout a temperature range of 290 K to 340 K in 10 K increments to assess the impact of temperature on photovoltaic parameters.
For each temperature and wavelength set, we obtained the current-voltage (I-V) behavior of the device [19, 20]. The fill factor (FF) was determined from the ratio of the maximum power output to the product of open-circuit voltage (Voc) and short-circuit current density (Jsc), while the I-V curve supplied information regarding Voc and Jsc [21, 22]. The fill factor (FF) was taken as the proportion of the maximum power output [19, 23].
All electrical quantities flow, voltages, etc. They are per unit area. This method is in line with the established PV analysis methods [22, 23].
2.4 SCAPS-1D simulation model
The SCAPS-1D program, which is free of charge to the research community, is described in the literature. The model is based on incorporating recombination mechanisms to solve the semiconductor Poisson and continuity equations inside the device. This equation is known as the Shockley diode equation with the photo-generated current and describes the current-voltage (I-V) characteristics of a solar cell or p-n junction diode under illumination [24, 25].
$\mathrm{J}(V)=J_o\left(e^{\frac{q V}{n K T}}-1\right)-\mathrm{J}_{p h}$
2.5 External quantum efficiency (EQE)
Photovoltaic devices such as solar cells. It indicates the ability of a device to convert incident light (photons) into useful electrical current (electrons). EQE is defined as:
$\mathrm{EQE}=\frac{\text { Number of collected charge carriers }}{\text { Number of incident photons at wavelength } \lambda}$
This is because EQE tells you how many charge carriers (most often electrons) you collect for each photon that hits at a given wavelength. The EQE value is dependent on the wavelength of light and provides an insight into the spectral response of the solar cell. This also means that the falling photons of different wavelengths are absorbed at different depths of the cell. The higher the EQE, the more the solar cell is effectively turning light into electricity at that wavelength. Through EQE spectrum analysis, material losses stemming from reflection, recombination, or incomplete absorption can be uncovered [26-28]. The parameters of the cell model used in this study are given in Table 1.
3.1 Current-voltage (I-V) characteristics and temperature influence
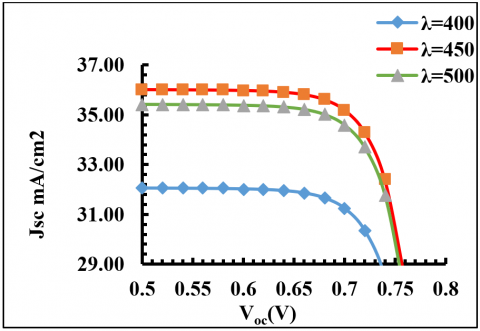
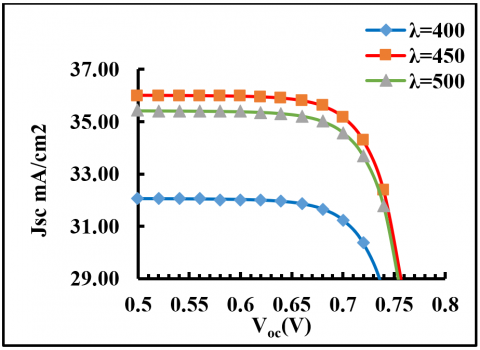
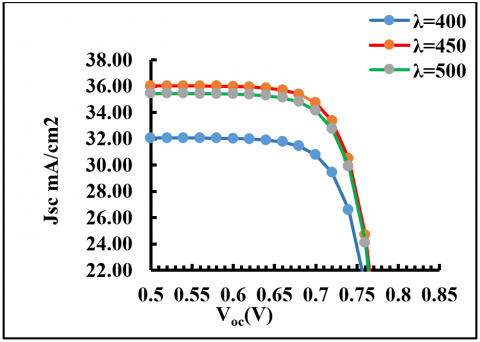
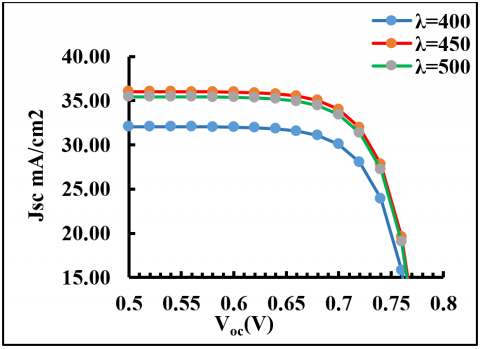
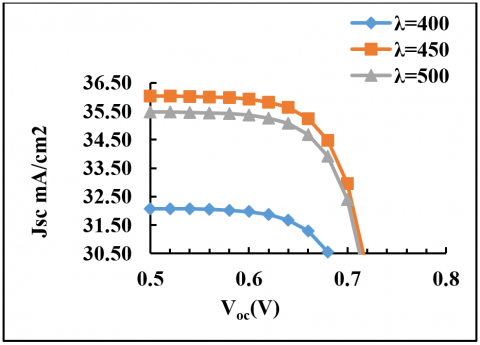
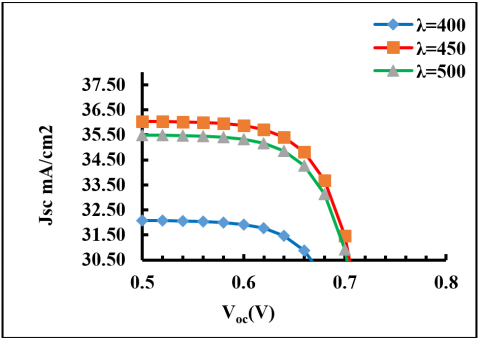
The simulated current-voltage (I-V) characteristics of the FTO/CdS/CH3NH3PbI3/CuO perovskite solar cell under illumination wavelengths of 400 nm, 450 nm, and 500 nm were examined across a temperature range of 290 K to 340 K, as depicted in Figure 2(a-f). The open-circuit voltage (Voc) significantly declines with rising temperature, especially under illumination at 400 nm. The decline is mainly due to the rise in reverse saturation current density (Jo), aligning with the diode equation Ln [29].
$V_{O C}=\frac{n k T}{q} \operatorname{Ln}\left(\frac{J_{s c}}{J_{\mathrm{o}}}+1\right)$
(a) current-voltage characteristics at T = 290 K
(b) current-voltage characteristics at T = 300 K
(c) current-voltage characteristics at T = 310 K
(d) current-voltage characteristics at T = 320 K
(e) current-voltage characteristics at T = 330 K
(f) current-voltage characteristics at T = 340 K
Figure 2. Simulated current-voltage (I-V) characteristics of the FTO/CdS/CH₃NH₃PbI₃/CuO perovskite solar cell under 400 nm, 450 nm, and 500 nm illumination across temperatures ranging from 290 K to 340 K
Such thermal behavior reflects enhanced recombination near the absorber interface, especially for shorter wavelengths with shallow absorption depth [30]. Among all conditions, 450 nm illumination yielded the highest Voc and Jsc, indicating more favorable spectral absorption and charge transport properties [31]. Furthermore, distortion of the I-V curve at elevated temperatures (330-340 K) under 400 nm suggests increased series resistance or interface instability, possibly caused by degradation at the perovskite/transport layer interfaces [32, 33].
3.2 Open-circuit voltage (VOC) characteristics and temperature influence
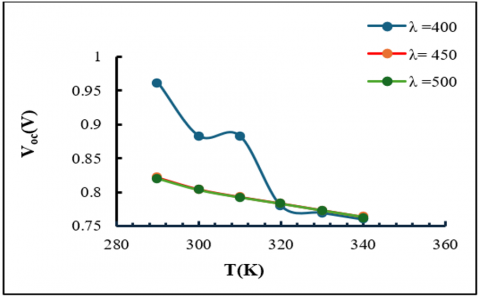
The simulated open-circuit voltage (Voc) of the FTO/CdS/CH₃NH₃PbI₃/CuO perovskite solar cell under illumination wavelengths of 400 nm, 450 nm, and 500 nm was analyzed across temperatures ranging from 290 K to 340 K (Figure 3). Voc exhibits a clear decrease with increasing temperature (Table 2). At 290 K, the maximum (Voc) values were approximately 0.96 V, 0.82 V, and 0.82 V for 400 nm, 450 nm, and 500 nm, respectively. By 340 K, Voc dropped by nearly 20%, consistent with the exponential rise in reverse saturation current density (Jo), explained by the Shockley diode equation [34-36]. The thermal activation of trap-assisted recombination increases with temperature, leading to degradation of Voc.
Figure 3. Open-circuit voltage (Voc) characteristics and temperature influence
Notably, the degradation at 400 nm illumination is more significant due to carriers generated near the surface, prone to higher recombination losses because of shallower penetration depth [37]. Such thermal degradation is mainly and universally caused by an exponential increment of reverse saturation current density (Jo) of a diode with temperature, by evaluating the Shockley diode equation in a wide temperature range.
$V_{O C}=\frac{n k T}{q} \operatorname{Ln}\left(\frac{J_{s c}}{J_0}+1\right)$
Table 2. Open-circuit voltage (Voc) at various temperatures and illumination wavelengths
|
Temperature (K) |
Voc at λ =400 (nm) |
Voc at λ=450 (nm) |
Voc at λ =500 (nm) |
|
290 |
0.961939 |
0.821586 |
0.820658 |
|
300 |
0.883099 |
0.804181 |
0.803511 |
|
310 |
0.883099 |
0.792956 |
0.792489 |
|
320 |
0.780261 |
0.783384 |
0.782936 |
|
330 |
0.770009 |
0.773404 |
0.772924 |
|
340 |
0.760288 |
0.763616 |
0.763155 |
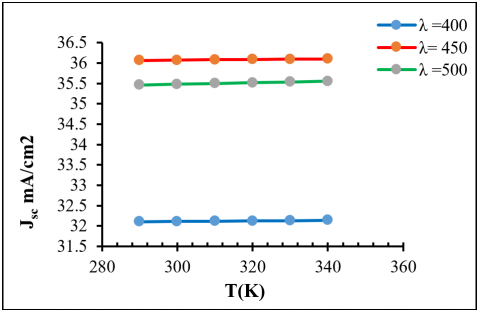
3.3 Short-circuit current density (JSC) characteristics and temperature influence
The short-circuit current density (Jsc) increased slightly with temperature across all wavelengths (Table 3, Figure 4), attributed to enhanced carrier mobility and reduced non-radiative recombination at higher temperatures [37, 38]. The lowest increase occurred at 400 nm, linked to increased surface recombination due to shallower light penetration [37, 39].
Figure 4. The relationship between short-circuit current density (Jsc) and temperature (T)
Table 3. Short-circuit current density (Jsc) at different temperatures and illumination wavelengths
|
Temperature (K) |
Jsc at λ =400 (nm) |
Jsc at λ =450 (nm) |
Jsc at λ =500 (nm) |
|
290 |
32.10384 |
36.06397 |
35.46501 |
|
300 |
32.11215 |
36.07297 |
35.4839 |
|
310 |
32.11986 |
36.08133 |
35.50205 |
|
320 |
32.12703 |
36.08911 |
35.51952 |
|
330 |
32.13371 |
36.09637 |
35.53638 |
|
340 |
32.13995 |
36.10315 |
35.55266 |
Carrier lifetime calculations are typically conducted for minority carriers. Consequently, the carrier lifetime is designated as the minority carrier lifetime. A reduced minority carrier lifetime indicates an increased recombination rate of excess carriers within the semiconductor.
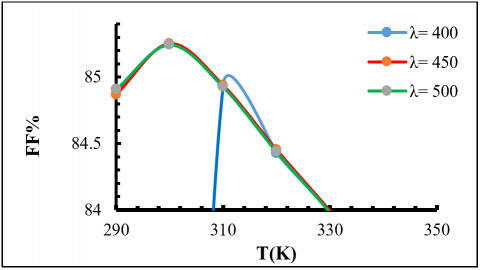
3.4 Fill factor (FF %) as a function of temperature and wavelength
The FF % dependence versus temperature was studied under illumination at 400 nm, 450 nm, and 500 nm. The obtained results are organized in Table 4 and Figure 5, which unveils a nonlinear dependence where FF % increases with temperature until a maximum is achieved at peaking near 300 K and 310 K (~85%), then decreases with continued heating. This suggests the presence of an optimal thermal window that maximizes charge extraction and minimizes resistance and recombination losses.
Table 4. Fill factor (FF %) values at various temperatures and wavelengths
|
Temperature (K) |
FF at λ =400 (nm) |
FF at λ =450 (nm) |
FF at λ =500 (nm) |
|
290 |
72.2214 |
84.8691 |
84.9088 |
|
300 |
77.3167 |
85.2526 |
85.2448 |
|
310 |
84.9348 |
84.9397 |
84.9288 |
|
320 |
84.427 |
84.4532 |
84.4386 |
|
330 |
83.9817 |
83.9931 |
83.9807 |
|
340 |
83.4619 |
83.4956 |
83.4796 |
Figure 5. The relationship between fill factor (FF) and temperature (T)
At 290 K, FF % at 400 nm (72.22%) was further reduced compared with 450 nm (84.87%) and 500 nm (84.91%) due to more significant surface recombination at shorter wavelengths with a shallow optical penetration depth [34]. FF % was also enhanced with temperature and reached the maximum value of ~84.93% at 310 K for all wavelengths, which is due to the increased carrier mobility and decrease in the series resistance [35].
For temperatures above 310K, FF % decreased somewhat to (83.46 % – 83.50%) at 340K, which is attributed to higher ion migration, deterioration of the interface, and non-radiative recombination processes [36].
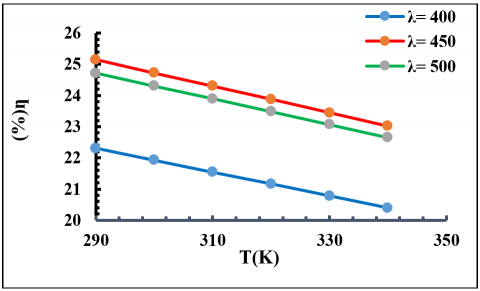
3.5 Temperature dependence of power conversion efficiency (PCE)
The power conversion efficiency (PCE) of the solar cell was evaluated across a temperature range from 290 K to 340 K under three illumination wavelengths (400 nm, 450 nm, and 500 nm). As shown in Figure 6 and summarized in Table 5, PCE decreases consistently with increasing temperature for all wavelengths.
Figure 6. The relationship between power conversion efficiency (PCE) and temperature (T)
Table 5. Power conversion efficiency (PCE) values at various temperatures and illumination wavelengths
|
Temperature (K) |
η at λ =400 (nm) |
η at λ =450 (nm) |
η at λ =500 (nm) |
|
290 |
22.3034 |
25.1464 |
24.7124 |
|
300 |
21.9256 |
24.7253 |
24.3048 |
|
310 |
21.5456 |
24.302 |
23.8947 |
|
320 |
21.1637 |
23.8763 |
23.482 |
|
330 |
20.7798 |
23.4484 |
23.0669 |
|
340 |
20.3944 |
23.0189 |
22.6499 |
Specifically, PCE declines by approximately 8–9% when the temperature rises from 290 K to 340 K, reflecting the detrimental effect of thermal stress on device performance [34, 39].
Of the wavelengths examined, 450 nm illumination yields the highest efficiency, reaching 25.15% at 290 K. This phenomenon is due to the beneficial overlap between the photon energy at this wavelength and the absorption spectrum of the perovskite active layer. This results in optimal charge carrier generation and minimal recombination losses, thereby enhancing photovoltaic performance [37, 40].
Conversely, 400 nm light exhibits the lowest power conversion efficiency values despite possessing higher photon energy. This occurs primarily because shorter-wavelength photons exhibit limited penetration depth, resulting in the generation of charge carriers near the surface, where surface recombination and defect-induced trapping are more pronounced. This reduces the effective carrier collection efficiency [41]. The performance at 500 nm lies between that of the other two wavelengths. Photons at 500 nm exhibit greater penetration into the absorber layer, facilitating the generation of bulk carriers. Nonetheless, due to their lower energy compared to 450 nm photons, the PCE is marginally reduced [41].
The reduction in PCE with increasing temperature is fundamentally associated with enhanced trap-assisted recombination caused by thermal energy, which reduces the open-circuit voltage (Voc) and fill factor (FF) [35, 38]. Increased reverse saturation current density (Jo) leading to higher recombination rates [34]. Thermal effects cause variations in series resistance (Rs) and shunt resistance (RSh), increasing resistive losses and further degrading efficiency [42].
Overall, these findings highlight the critical influence of both spectral illumination and temperature on perovskite solar cell performance. Engineering the device to optimize spectral response and improve thermal stability is essential for enhancing real-world operational efficiency [43, 44].
3.6 Temperature and light spectrum range effect on carrier lifetime and resistances
The lifetime of the minority carrier has a big effect on the recombination rates and the overall efficiency of perovskite solar cells. This study did not directly assess carrier lifetime; however, its effects were integrated into the SCAPS-1D simulation via recombination parameters aligned with experimental literature [44, 45]. Longer carrier lifetimes are linked to lower recombination losses, which improve the short-circuit current density (Jsc) and fill factor (FF) [46]. The observed decrease in fill factor (FF) and alteration of the current-voltage (I-V) characteristics at elevated temperatures signify an increase in series resistance (Rs) and shunt resistance (RSh). The resistances are mainly caused by interface degradation, ion migration, and defect formation due to heat, which speed up recombination and slow down charge transport [44, 47]. Resistive losses increase as the series resistance (Rs) goes up. This lowers the fill factor and the power conversion efficiency (PCE) when the temperature rises.
This study comprehensively investigated the effects of temperature and illumination wavelength on the photovoltaic performance of the FTO/CdS/CH₃NH₃PbI₃/CuO perovskite solar cell using high-precision SCAPS-1D simulations. The results demonstrated that the open-circuit voltage (Voc) is significantly influenced by temperature, exhibiting a decrease of approximately 20% as the temperature increased from 290 K to 340 K. This decline is primarily attributed to the rise in reverse saturation current and enhanced trap-assisted recombination processes induced by thermal activation.
Conversely, a slight improvement in the short-circuit current density (Jsc) was observed with increasing temperature, which can be ascribed to enhanced carrier mobility and a reduction in non-radiative recombination. The fill factor (FF) displayed a non-linear dependence on temperature, reaching its maximum near 310 K, reflecting a balance between improved charge transport and thermal degradation effects, such as ion migration and interface deterioration.
Regarding power conversion efficiency (PCE), a steady decline was noted with rising temperature, with optimal performance achieved at 450 nm illumination and lower temperatures, underscoring the critical importance of precise control over operational conditions to maximize device efficiency.
These findings highlight the necessity for advanced interface engineering to mitigate ion migration and trap-related recombination, spectral optimization to enhance carrier generation, and the development of thermally stable materials and device architectures. Additionally, supplementary experimental studies—such as carrier lifetime assessments and comprehensive resistive parameter analyses—are highly advisable to enhance comprehension and enable the practical implementation of perovskite solar cells in realistic operating conditions.
[1] Sharma, S., Jain, K.K., Sharma, A. (2015). Solar cells: In research and applications—A review. Materjials Sciences and Applications, 6(12): 1145-1155. https://doi.org/10.4236/msa.2015.612113
[2] Afre, R.A., Pugliese, D. (2024). Perovskite solar cells: A review of the latest advances in materials, fabrication techniques, and stability enhancement strategies. Micromachines, 15(2): 192. https://doi.org/10.3390/mi15020192
[3] Rong, Y., Ming, Y., Ji, W., Li, D., Mei, A., Hu, Y., Han, H. (2018). Toward industrial-scale production of perovskite solar cells: Screen printing, slot-die coating, and emerging techniques. The Journal of Physical Chemistry Letters, 9(10): 2707-2713. https://doi.org/10.1021/acs.jpclett.8b00912
[4] Jena, A.K., Kulkarni, A., Miyasaka, T. (2019). Halide perovskite photovoltaics: Background, status, and future prospects. Chemical Reviews, 119(5): 3036-3103. https://doi.org/10.1021/acs.chemrev.8b00539
[5] Albrecht, S., Saliba, M., Baena, J.P.C., Lang, F., et al. (2016). Monolithic perovskite/silicon-heterojunction tandem solar cells processed at low temperature. Energy & Environmental Science, 9(1): 81-88. https://doi.org/10.1039/C5EE02965A
[6] Shockley, W., Queisser, H. (2018). Detailed balance limit of efficiency of p–n junction solar cells. In Renewable Energy.
[7] Rühle, S. (2016). Tabulated values of the Shockley–Queisser limit for single junction solar cells. Solar Energy, 130: 139-147. https://doi.org/10.1016/j.solener.2016.02.015
[8] Green, M.A., Dunlop, E.D., Hohl-Ebinger, J., Yoshita, M., Kopidakis, N., Hao, X. (2021). Solar cell efficiency tables (Version 58). Progress in Photovoltaics, 29(7): 657.
[9] Nelson, J.A. (2003). The Physics of Solar Cells. World Scientific Publishing Company.
[10] Green, M.A. (1981). Solar cell fill factors: General graph and empirical expressions. Solid-State Electronics, 24(8): 788-789.
[11] Smets, A., Jäger, K., Isabella, O., Van Swaaij, R., Zeman, M. (2016). Solar Energy: The Physics and Engineering of Photovoltaic Conversion, Technologies and Systems. Bloomsbury Publishing.
[12] Ouyang, Z., Abrams, H., Bergstone, R., Li, Q., Zhu, F., Li, D. (2020). Rapid layer-Specific annealing enabled by ultraviolet led with estimation of crystallization energy for high-Performance perovskite solar cells. Advanced Energy Materials, 10(4): 1902898. https://doi.org/10.1002/aenm.201902898
[13] Zhang, L., Ding, S.A., Qin, G. (2019). Efficiency simulations on perovskite solar cells only using experimentally determined reflectance and transmittance data. Solar Energy Materials and Solar Cells, 201: 110039. https://doi.org/10.1016/j.solmat.2019.110039
[14] Jiang, Q., Zhu, K. (2024). Rapid advances enabling high-performance inverted perovskite solar cells. Nature Reviews Materials, 9(6): 399-419. https://doi.org/10.1038/s41578-024-00678-x
[15] Tress, W. (2017). Perovskite solar cells on the way to their radiative efficiency limit-insights into a success story of high open-circuit voltage and low recombination. Advanced Energy Materials, 7(14): 1602358. https://doi.org/10.1002/aenm.201602358
[16] Shadabroo, M.S., Abdizadeh, H., Golobostanfard, M.R. (2021). Elpasolite structures based on A2AgBiX6 (A: MA, Cs, X: I, Br): Application in double perovskite solar cells. Materials Science in Semiconductor Processing, 125: 105639. https://doi.org/10.1016/j.mssp.2020.105639
[17] Li, X., Xie, F., Rafique, S., Wang, H., et al. (2023). Spectral response regulation strategy by downshifting materials to improve efficiency of flexible perovskite solar cells. Nano Energy, 114: 108619. https://doi.org/10.1016/j.nanoen.2023.108619
[18] Lee, H., Lee, C., Song, H.J. (2019). Influence of electrical traps on the current density degradation of inverted perovskite solar cells. Materials, 12(10): 1644. https://doi.org/10.3390/ma12101644
[19] Kim, J.C., Cheong, S.K. (2014). I–V curve characteristics of solar cells on composite substrate under mechanical loading. Journal of Mechanical Science and Technology, 28(5): 1691-1696. https://doi.org/10.1007/s12206-014-0115-5
[20] Park, N.G. (2015). Perovskite solar cells: An emerging photovoltaic technology. Materials Today, 18(2): 65-72. https://doi.org/10.1016/j.mattod.2014.07.007
[21] Nelson, J.A. (2003). The Physics of Solar Cells. World Scientific Publishing Company.
[22] Christians, J.A., Manser, J.S., Kamat, P.V. (2015). Best practices in perovskite solar cell efficiency measurements. Avoiding the error of making bad cells look good. The journal of physical chemistry letters, 6(5): 852-857. https://doi.org/10.1021/acs.jpclett.5b00289
[23] Fonash, S.J. (2012). Solar Cell Device Physics. Elsevier.
[24] Aliaghayee, M. (2023). Optimization of the perovskite solar cell design with layer thickness engineering for improving the photovoltaic response using SCAPS-1D. Journal of Electronic Materials, 52: 2475-2491. https://doi.org/10.1007/s11664-022-10203-x
[25] Imran, S., Khalid, M. (2025). Simulations and performance analysis of CH3NH3SnI3 perovskite solar cell: Modeling thickness and temperature effects using SCAPS-1D. Next Materials, 7: 100439. https://doi.org/10.1016/j.nxmate.2024.100439
[26] ul Rehman, A., Afzal, S., Naeem, I., Munir, T., Sarwar, S.G., Saleem, M., Obodo, R.M. (2025). A study on CIGS thin-film solar cells through SCAPS-1D simulations. Proceedings of the Pakistan Academy of Sciences: A. Physical and Computational Sciences, 62(1): 81-95.
[27] Tang, H., Bai, Y., Zhao, H., Qin, X., Hu, Z., Zhou, C., Huang, F., Cao, Y. (2024). Interface engineering for highly efficient organic solar cells. Advanced Materials, 36(16): 2212236. https://doi.org/10.1002/adma.202212236
[28] Chaudhary, J.K., Kanth, R., Skön, J.P., Heikkonen, J. (2019). Analysis and enhancement of quantum efficiency for multi-junction solar cell. In 2019 IEEE 46th Photovoltaic Specialists Conference (PVSC). https://doi.org/10.1109/PVSC40753.2019.8980684
[29] Stolterfoht, M., Wolff, C.M., Amir, Y., Paulke, A., Perdigón-Toro, L., Caprioglio, P., Neher, D. (2017). Approaching the fill factor Shockley–Queisser limit in stable, dopant-free triple cation perovskite solar cells. Energy & Environmental Science, 10(6): 1530-1539. https://doi.org/10.1039/C7EE00899F
[30] Kumar, A., Singh, S., Sharma, A., Ahmed, E.M. (2022). Efficient and stable perovskite solar cells by interface engineering at the interface of electron transport layer/perovskite. Optical Materials, 132: 112846. https://doi.org/10.1016/j.optmat.2022.112846
[31] Liu, X.P. (2023). Highly efficient and stable halide perovskite solar cells. Doctoral dissertation, University of Surrey.
[32] Wan, Z., Li, C., Jia, C., Su, J., et al. (2025). Suppressing ion migration through dual interface engineering toward efficient and stable perovskite solar modules. ACS Energy Letters, 10(4): 1585-1595. https://doi.org/10.1021/acsenergylett.5c00074
[33] Huang, Y., Shen, C., Cai, C., Zhu, W., Liang, Y., Kalogirou, S.A., Wang, J. (2025). Fabrication, efficiency loss analysis, and simulation-based optimization of semi-transparent perovskite solar cell modules for photovoltaic windows. Solar Energy, 299: 113721. https://doi.org/10.1016/j.solener.2025.113721
[34] Qu, H., Li, X. (2019). Temperature dependency of the fill factor in PV modules between 6 and 40 C. Journal of Mechanical Science and Technology, 33(4): 1981-1986. https://doi.org/10.1007/s12206-019-0348-4
[35] Minemoto, T., Murata, M. (2014). Device modeling of perovskite solar cells based on structural similarity with thin film inorganic semiconductor solar cells. Journal of Applied Physics, 116(5): 054505. https://doi.org/10.1063/1.4891982
[36] Castell, N., Guerreiro, C., Denby, B.R., Ortiz, G.A. (2015). The role of air quality modelling in particulate matter management in cities. Results from the Air Implementation Pilot. Chemical Industry and Chemical Engineering Quarterly, 21(1-2): 221-227. https://doi.org/10.2298/CICEQ140217036C
[37] Yuan, Y., Huang, J. (2016). Ion migration in organometal trihalide perovskite and its impact on photovoltaic efficiency and stability. Accounts of Chemical Research, 49(2): 286-293. https://doi.org/10.1021/acs.accounts.5b00420
[38] Meng, Q., Chen, Y., Xiao, Y.Y., Sun, J., Zhang, X., Han, C.B., Gao, H.L., Zhang, Y.Z., Yan, H. (2021). Effect of temperature on the performance of perovskite solar cells. Journal of Materials Science: Materials in Electronics, 32(10): 12784-12792. https://doi.org/10.1007/s10854-020-03029-y
[39] Tress, W. (2017). Metal halide perovskites as mixed electronic-ionic conductors: Challenges and opportunities-from hysteresis to memristivity. The Journal of Physical Chemistry Letters, 8(13): 3106-3114. https://doi.org/10.1021/acs.jpclett.7b00975
[40] Zhao, Y., Zhu, K. (2016). Organic–inorganic hybrid lead halide perovskites for optoelectronic and electronic applications. Chemical Society Reviews, 45(3): 655-689. https://doi.org/10.1039/C4CS00458B
[41] Dong, Q., Fang, Y., Shao, Y., Mulligan, P., Qiu, J., Cao, L., Huang, J. (2015). Electron-hole diffusion lengths> 175 μm in solution-grown CH3NH3PbI3 single crystals. Science, 347(6225): 967-970. https://doi.org/10.1126/science.aaa5760
[42] Zhang, H., Qiao, X., Shen, Y., Wang, M. (2015). Effect of temperature on the efficiency of organometallic perovskite solar cells. Journal of Energy Chemistry, 24(6): 729-735. https://doi.org/10.1016/j.jechem.2015.10.007
[43] Yang, W.S., Park, B.W., Jung, E.H., Jeon, N.J., et al. (2017). Iodide management in formamidinium-lead-halide–based perovskite layers for efficient solar cells. Science, 356(6345): 1376-1379. https://doi.org/10.1126/science.aan2301
[44] Correa-Baena, J.P., Abate, A., Saliba, M., Tress, W., Jacobsson, T.J., Grätzel, M., Hagfeldt, A. (2017). The rapid evolution of highly efficient perovskite solar cells. Energy & Environmental Science, 10(3): 710-727. https://doi.org/10.1039/C6EE03397K
[45] Saliba, M., Correa-Baena, J.P., Wolff, C.M., Stolterfoht, M., Phung, N., Albrecht, S., Neher, D., Abate, A. (2018). How to make over 20% efficient perovskite solar cells in regular (n–i–p) and inverted (p–i–n) architectures. Chemistry of Materials, 30(13): 4193-4201. https://doi.org/10.1021/acs.chemmater.8b00136
[46] Jeon, N.J., Noh, J.H., Kim, Y.C., Yang, W.S., Ryu, S., Seok, S.I. (2014). Solvent engineering for high-performance inorganic–organic hybrid perovskite solar cells. Nature Materials, 13(9): 897-903. https://doi.org/10.1038/nmat4014
[47] Stranks, S.D., Eperon, G.E., Grancini, G., Menelaou, C., Alcocer, M.J., Leijtens, T., Herz, L.M., Petrozza, A., Snaith, H.J. (2013). Electron-hole diffusion lengths exceeding 1 micrometer in an organometal trihalide perovskite absorber. Science, 342(6156): 341-344. https://doi.org/10.1126/science.1243982