Agusriansyah Saputra![]() | Herpandi Herpandi
| Herpandi Herpandi![]() | Agus Supriadi
| Agus Supriadi![]() | Daniel Saputra*
| Daniel Saputra*![]()
© 2025 The authors. This article is published by IIETA and is licensed under the CC BY 4.0 license (http://creativecommons.org/licenses/by/4.0/).
OPEN ACCESS
Pempek is a traditional food from Palembang that is easily perishable. This condition poses a challenge in terms of efficiently monitoring product quality. Therefore, there is a need for measurement techniques that are fast, inexpensive, and non-destructive. This study used Fourier Transform Infrared Spectroscopy (FT-IR) to characterize changes in functional groups of pempek Palembang during storage. Pempek samples were packaged using two methods: (1) Semi-aseptic (SA) and (2) Sterile (ST). The pempek was sterilized using an autoclave at 121℃ for 15 minutes, and sealed using a vacuum sealer with or without negative pressure (A1=0 MPa, A2=-0.08 for 8 seconds, A3=-0.1 for 30 seconds). The data were analyzed both descriptively and statistically, with repeated two times using Principal Component Analysis (PCA) with the OriginPro 2025 software. The results showed that significant changes in functional groups began to occur between days 12 and 18 of storage. The sterile pempek (ST) treatment exhibited higher chemical consistency compared to the semi-aseptic pempek (SA). The combination of FT-IR and PCA proved effective as a non-destructive method for monitoring changes in functional groups and estimating the shelf life of pempek in real-time. These findings contribute to the development of more efficient methods for measuring food products.
functional group, sterilization, vacuum packaging, FT-IR, PCA
Pempek, a traditional culinary product from Palembang, has a relatively short shelf life, lasting approximately two days at room temperature [1-7]. Several methods have been used to extend the shelf life of pempek. Traditionally, the techniques used include coating the pempek with flour to reduce water activity (Aw) and using oil as a barrier against the oxidation process [8]. Meanwhile, modern methods include the application of edible film [9], edible coating [4, 7], freezing [10], freeze-drying [11], vacuum packaging, and thermal processing [12]. Thermal treatments are often required to maintain product quality, with sterilization serving as a pre-treatment before vacuum packaging to improve storage stability. During the sterilization of preserved food, which usually happens at temperatures of 115-121℃, processes that substantially change the initial chemical composition [13].
Thermal sterilization is widely applied in industrial food processing due to its simplicity, controllability, and cost-effectiveness. High-temperature treatments can profoundly influence the microbiological and physicochemical properties of food products [13-20]. The elevated temperatures generate sufficient vapor pressure to eliminate heat-resistant bacterial spores while also inactivating enzymes responsible for food deterioration during storage [21, 22]. A sterilization temperature of 121℃ for 15 minutes has been proven effective in inactivating pathogenic microorganisms, thereby ensuring the safety of food products for consumption. This sterilization protocol aligns with the D-value standard for Clostridium botulinum, which is approximately 0.21 minutes, indicating that within 15 minutes, the process can effectively reduce microbial populations. Furthermore, the Z-value for this microorganism is 10℃, meaning that every 10℃ increase in temperature significantly enhances the microbial death rate [23]. In addition to sterilization, vacuum packaging under negative pressure is an effective method for extending the shelf life of food products. Vacuum packaging reduces oxidation and inhibits the growth of aerobic microorganisms [24]. However, combining vacuum packaging with thermal sterilization may provide synergistic effects, yielding optimal preservation outcomes.
Measurement of physical and chemical properties of pempek has been studied in previous studies using wet laboratory-based methods [3, 11, 12, 25, 26]. Generally, the measurement of physical and chemical properties analysis requires high costs, is time-consuming, and involves a lengthy procedure. These limitations present significant challenges for the efficient monitoring of product quality, particularly for traditional food items like pempek that have a relatively short shelf life [11, 12, 25-27]. Consequently, there is a pressing need for alternative analytical techniques that are rapid, cost-effective, and non-destructive.
Various spectroscopic methods have been developed to enable rapid and cost-efficient measurements in analyzing changes in physical and chemical properties of food products. These methods play an important role in improving the precision of component identification non-destructively. Near-infrared spectroscopy (NIRS) has a sensitivity comparable to FT-IR; however, NIRS is unable to provide detailed molecular structure information, as the signals tend to overlap and lack specificity. On the other hand, Raman spectroscopy offers the advantage of low sensitivity to water content, making it useful in samples with high water content. Nonetheless, this technique has lower signal sensitivity and can be affected by fluorescence, limiting its application in some food matrices [27-29]. FT-IR spectroscopy is emerging as the most suitable method due to its ability to detect changes in physical and chemical properties with high precision.
FT-IR demonstrates significant potential for application across foods due to its analytical capabilities. This technique is particularly well-suited for quality control and production process monitoring, as it allows for real-time identification of chemical components without causing damage to the sample. Furthermore, the ability of FT-IR spectroscopy to perform online detection enables direct assessment of both raw materials and finished products, ensuring compliance with safety standards and enhancing operational efficiency. These features make FT-IR highly relevant in multiple sectors, including the food industry, pharmaceutical manufacturing, and environmental monitoring [28].
Several studies have utilized FT-IR techniques in the analysis of food products such as surimi. Hou et al. [29] used FT-IR to detect foreign substances added to surimi, and the results showed that this technique was able to accurately predict the starch content in surimi. Meanwhile, Wei et al. [30] investigated changes in protein structure during the gelation process of surimi using an FT-IR approach. A similar study by Kobayashi et al. [31] also used FT-IR to observe changes in protein structure in tilapia fish protein isolates and surimi during comminution and gelation. Additionally, Zhang et al. [32] utilized FT-IR to distinguish between species of marine surimi based on their chemical composition.
One of the main challenges in the application of spectroscopy (FT-IR) is the large number of spectral variables, which can complicate the data analysis process. This high dimensionality often hinders the effective implementation of multivariate statistical methods, as it increases data complexity and lengthens result interpretation. Principal Component Analysis (PCA) is often used to reduce the dimensionality of large datasets by transforming correlated variables into a smaller number of uncorrelated principal components, while retaining most of the essential information. This approach facilitates more efficient identification of patterns, relationships, and underlying structures within the data [28, 33-37].
Despite its potential, research on the application of FT-IR spectroscopy and PCA for analyzing pempek Palembang has not been previously reported. Therefore, the objective of this study was to characterize changes in functional groups of pempek during storage through FT-IR spectra and PCA statistical analysis. This study provides scientific information that could be used as a basis for developing methods for monitoring the quality of food products during storage, which can then be applied in the food industry.
2.1 Materials and instruments
The pempek Palembang samples were obtained from a branded retailer in Palembang City. The pempek used in this study was cylindrically shaped and cut radially with dimensions of 4±0.2 cm in diameter and 2±0.1 cm in height. In addition, sterilization of pempek was conducted using an autoclave (HVE-50, Hirayama, Japan), followed by vacuum sealing with a vacuum packaging machine (Double Leopard DZ-280), and the FT-IR spectra were obtained using a spectroscopy instrument (Bruker Vertex 80, Germany). The resulting spectra were interpreted using OPUS 8.5 software.
2.2 Sample preparation
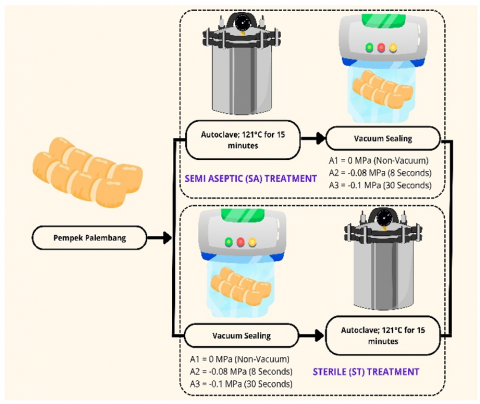
The process of preserving food through thermal processing is determined by the duration and temperature of the sterilization process. In compliance with the Indonesian Food and Drug Administration (IFDA/BPOM) Regulation No. 27 of 2021, the sterilization value must meet the thermal standard (F0, minutes), specifically F0 ≥ 3. In this study, the F0 value was recorded at 15 minutes at 121℃, which is sufficient to eliminate bacteria and thereby extend the shelf life of the food product. Pempek samples were packaged using two methods: (1) Semi-aseptic (SA) and (2) Sterile (ST), as shown in Figure 1. In the first method, pempek was sterilized using an autoclave based on IFDA/BPOM Regulation No. 27 of 2021. Following sterilization, the samples were aseptically removed and packaged into nylon plastic packaging and sealed using a vacuum sealer with or without negative pressure (A1=0 MPa, A2=-0.08 for 8 seconds, A3=-0.1 for 30 seconds). In the second method, pempek was packaged in nylon plastic and sealed using the same vacuum pressure, with or without negative pressure (A1=0MPa, A2=-0.08 for 8 seconds, A3=-0.1 for 30 seconds). Pempek was sterilized using an autoclave based on IFDA/BPOM Regulation No. 27 of 2021. The samples were then stored at 25±0.3℃ for 30 days, simulating the typical storage conditions employed by pempek vendors during the marketing period.
Figure 1. Methodical schematic of this study
2.3 Characterization of FT-IR and statistical analysis
The FT-IR spectra were analyzed in the wavenumber range of 4000 cm⁻¹ to 500 cm⁻¹ with a resolution of 8 cm⁻¹ and scan numbers of 32× at specific storage periods on days 3, 6, 9, 12, 18, 24, and 30. The samples were placed directly on the ATR crystal, and the crystal was cleaned using ethanol solvent (2 mL) after each sample measurement.
The FT-IR spectra obtained in the wavenumber range of 4000-500 cm⁻¹ were analyzed descriptively and statistically, with repeated two times using PCA with OriginPro 2025 software.
3.1 Fourier transform infrared spectroscopy (FT-IR)
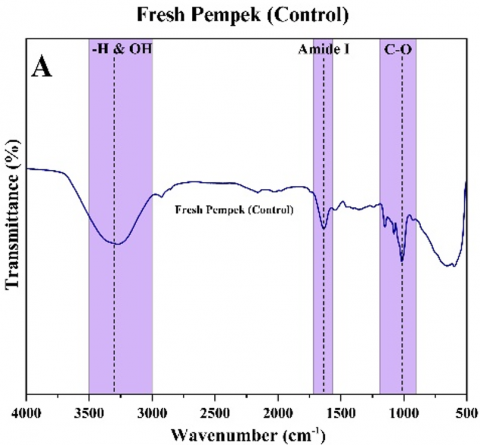
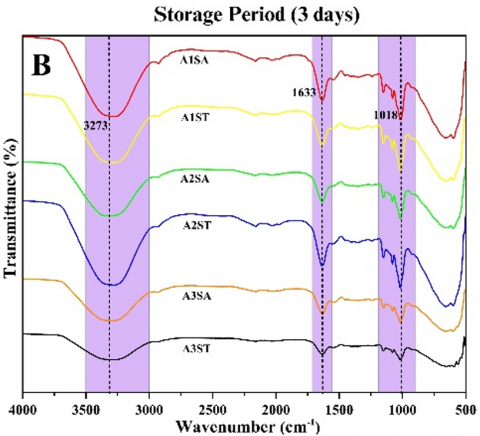
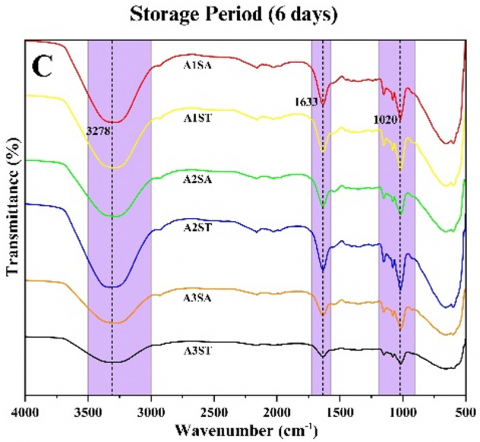
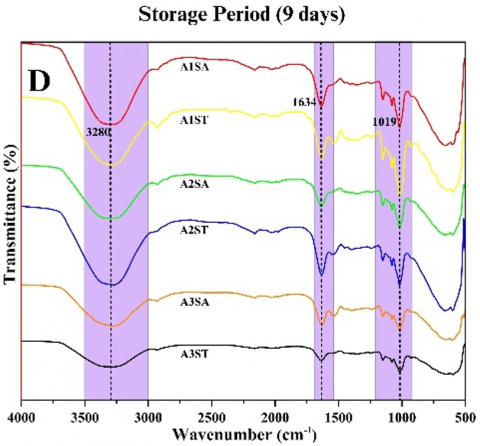
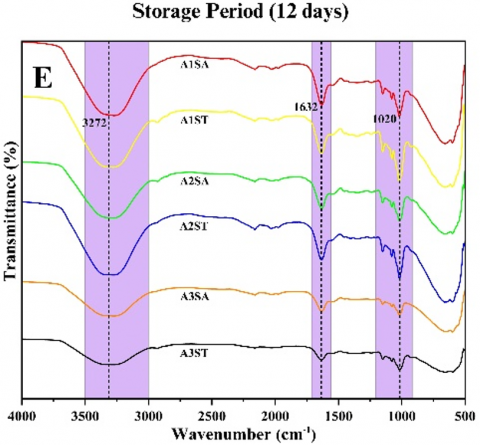
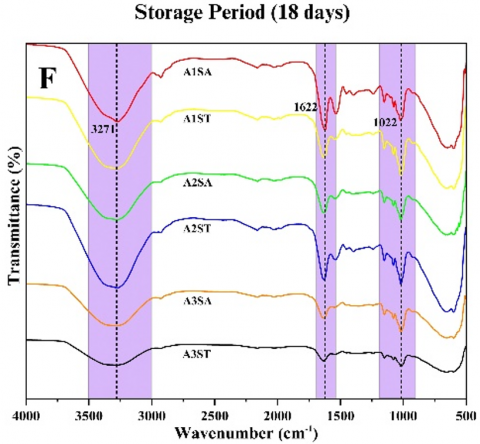
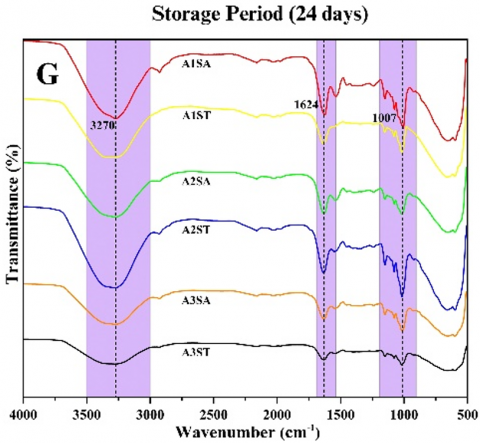
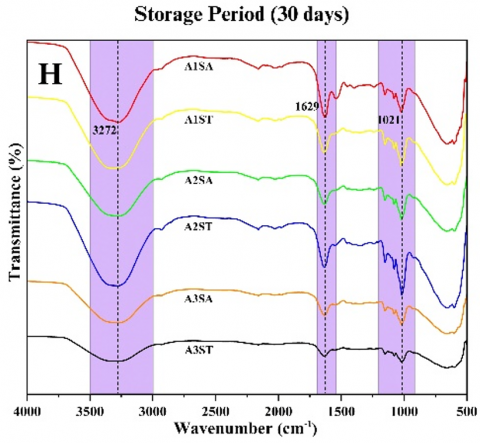
The spectra illustrating the effects of pre-treatment and storage on pempek (Figure 2). Pempek Palembang is a traditional food made from minced fish, tapioca flour, water, protein, and carbohydrates as its primary nutritional components [8, 26, 38]. FT-IR spectral analysis enables the identification of specific macronutrients based on their characteristic absorption bands [28]. In this study, distinct band regions were observed for moisture, protein, and carbohydrate content. Moisture content was identified within the 3000-3500 cm⁻¹ range, protein (amide I) within 1600-1700 cm⁻¹, and carbohydrates (starch) within 800-1200 cm⁻¹ [39, 40]. The spectra obtained from the control sample (fresh pempek) exhibit characteristic absorption bands in the wavenumber ranges of 3200-3400 cm⁻¹, 1600-1700 cm⁻¹, and 1000-1200 cm⁻¹. The absorption band at 3200-3400 cm⁻¹ corresponds to the stretching vibrations of –OH groups, indicating the presence of hydroxyl-containing compounds. The region between 1600-1700 cm⁻¹ is typically associated with C=O (carbonyl) stretching vibrations, suggesting the presence of proteins or amide groups. Meanwhile, the absorption band at 1000-1200 cm⁻¹ is attributed to C-O vibrations, which are characteristic of carbohydrate content [12].
Figure 2. FT-IR analysis of the storage period of 0 days (A), 3 days (B), 6 days (C), 9 days (D), 12 days (E), 18 days (F), 24 days (G), and 30 days (H) of the effect of pre-treatment and storage of pempek Palembang
Moisture plays a crucial role in determining the quality of pempek, particularly in terms of texture and product stability. The stretching vibrations of –H and –OH bonds indicate the influence of water mobility on moisture–starch–protein interactions, which are essential in the formation of hydrogen bonds. These interactions are influenced by factors such as starch, protein concentrations, temperature, and humidity [41, 42]. The findings indicate that hydrogen bonding occurs between water, starch, and protein molecules in pempek during storage. This observation was discussed in greater detail in the PCA analysis. The observed shift in vibrational wavenumber suggests strong interactions between starch and water within the pempek matrix.
The spectral region between 1600-1700 cm⁻¹ corresponds to the amide I band and provides insight into protein dynamics in pempek during storage. This region primarily reflects the stretching vibrations of the -C=O (carbonyl) bonds in protein backbones, which are indicative of protein mobility and its interaction with starch and oxygen-containing groups. These molecular interactions can influence the physical and chemical properties of pempek throughout storage. Protein mobility, and consequently its interaction potential, is affected by factors such as temperature, concentration, and environmental conditions [39, 43]. The results demonstrated that protein-hydrogen bonding interactions varied between the 3 and 9 days of storage period, after which the interactions stabilized. This vibrational shift suggests structural changes likely resulting from stretching interactions between mobile protein structures and hydrogen bonds. Amide I and II bands are commonly used to determine the secondary structure of proteins and to evaluate internal hydrogen bonding. In particular, the amide I band provides characteristic absorption peaks that are widely employed for analyzing protein secondary structures. The specific absorption ranges are as follows: 1650-1658 cm⁻¹ for α-helix, 1610-1640 cm⁻¹ for β-fold, 1660-1695 cm⁻¹ for β-corner, and 1640-1650 cm⁻¹ for the random coil. As shown in Figure 2, the dominant secondary structure of the protein in pempek is a β-fold. This finding is consistent with previous studies on pollock surimi [44-46]. During storage, the β-fold content in pempek proteins decreases, indicating degradation of the secondary structure. This breakdown leads to protein polymerization, which contributes to the observed changes in pempek texture over time.
The stretching vibration of the C-O bond reflects the influence of carbohydrate mobility on starch–oxygen–protein interactions. This bond, commonly found in organic compounds such as carbohydrates, plays a key role in molecular interactions during storage. Carbohydrate mobility refers to the ability of starch molecules to move and interact with other components, including oxygen and proteins [40, 47]. These interactions can significantly impact the structural stability and functional properties of pempek during storage. The results indicated a shift in C-O bond vibrations throughout the storage period, which is attributed to protein interactions occurring during starch retrogradation.
3.2 Principal component analysis (PCA)
PCA is a statistical technique used to explore similarities and differences among functional groups in pempek samples during storage, which elucidate relationships among the measured spectral properties [48]. The variables used in the PCA include functional groups corresponding to –H and –OH (associated with moisture content), amide I (related to protein structures), and C–O (representing carbohydrate components). In this study, principal components analysis was selected based on the criteria of Eigenvalues >1 and with a cumulative variance >60% [33-35]. The PCA results explained a substantial proportion of the total variance in the FT-IR data (Table 1). The variability of pempek on day 3 of strorage period was 85.6% (PC1=51.1% and PC2=34.5%), on day 6 was 76.6% (PC1=40.9% and PC2=35.7%), on day 9 was 97.4% (PC1=54.4% and PC2=43%), on day 12 was 93% (PC1=70.3% and PC2=22.7%), on day 18 was 97.6% (PC1=87.5% and PC2=10.1%), on day 24 was 97.5% (PC1=72.4% and PC2=25.1%), and on day 30 of storage period was 94.4% (PC1=64% and PC2=30.4%).
Table 1. Eigenvalues, percentage, and cumulative variation of the effect of pre-treatment and storage of pempek
|
Sample |
Eigenvalue |
Percentage of Variance (%) |
Cumulative (%) |
|
|
3 Days |
PC1 |
1.53 |
51.10 |
51.10 |
|
PC2 |
1.03 |
34.45 |
85.55 |
|
|
PC3 |
0.43 |
14.45 |
100.00 |
|
|
6 Days |
PC1 |
1.23 |
40.90 |
40.90 |
|
PC2 |
1.07 |
35.67 |
76.57 |
|
|
PC3 |
0.70 |
23.43 |
100.00 |
|
|
9 Days |
PC1 |
1.63 |
54.36 |
54.36 |
|
PC2 |
1.29 |
42.96 |
97.32 |
|
|
PC3 |
0.08 |
2.68 |
100.00 |
|
|
12 Days |
PC1 |
2.11 |
70.33 |
70.33 |
|
PC2 |
0.68 |
22.69 |
93.02 |
|
|
PC3 |
0.21 |
6.98 |
100.00 |
|
|
18 Days |
PC1 |
2.62 |
87.47 |
87.47 |
|
PC2 |
0.30 |
10.07 |
97.54 |
|
|
PC3 |
0.07 |
2.46 |
100.00 |
|
|
24 Days |
PC1 |
2.17 |
72.38 |
72.38 |
|
PC2 |
0.75 |
25.10 |
97.48 |
|
|
PC3 |
0.08 |
2.52 |
100.00 |
|
|
30 Days |
PC1 |
1.92 |
64.00 |
64.00 |
|
PC2 |
0.91 |
30.43 |
94.43 |
|
|
PC3 |
0.17 |
5.57 |
100.00 |
|
The eigenvector values obtained from Principal Component Analysis (PCA) were used to determine the direction of the greatest variability in the total variance of the FT-IR spectral data (Table 2). On day 3 of storage, the principal component (PC1) showed positive values for the –H and –OH functional groups (0.68), along with lower values for the amide I (0.16) and C–O (-0.72) bands. By day 6, the PC1 values for –H and –OH increased to 0.74, whereas the amide I value declined to -0.65. On day 9, a slight decrease in the –H and –OH values (0.69) was observed, accompanied by a positive shift in the amide I value to 0.45. From days 12 to 30, the PC1 value for –H and –OH progressively decreased, reaching 0.36 on day 30, while the second principal component (PC2) showed an increased amide I value of 0.69. These results suggest that the molecular configuration of Palembang pempek undergoes dynamic changes during storage, with notable fluctuations in the spectral features associated with –H and –OH, amide I, and C–O bonds. The initial treatment and storage duration significantly influence the product’s molecular stability and potentially its sensory and physicochemical properties.
Table 2. Eigenvector of the effect of pre-treatment and storage of pempek
|
Sample |
-H & OH |
Amide I |
C-O |
|
|
3 Days |
PC1 |
0.68 |
0.16 |
-0.72 |
|
PC2 |
-0.31 |
0.95 |
-0.08 |
|
|
6 Days |
PC1 |
0.74 |
-0.65 |
0.18 |
|
PC2 |
0.19 |
0.45 |
0.87 |
|
|
9 Days |
PC1 |
0.69 |
0.72 |
-0.04 |
|
PC2 |
0.38 |
-0.31 |
0.87 |
|
|
12 Days |
PC1 |
0.47 |
0.62 |
-0.62 |
|
PC2 |
0.88 |
-0.35 |
0.32 |
|
|
18 Days |
PC1 |
0.55 |
0.58 |
-0.60 |
|
PC2 |
0.81 |
-0.54 |
0.22 |
|
|
24 Days |
PC1 |
0.45 |
0.66 |
0.61 |
|
PC2 |
0.87 |
-0.14 |
-0.48 |
|
|
30 Days |
PC1 |
0.36 |
0.69 |
-0.63 |
|
PC2 |
0.91 |
-0.08 |
0.42 |
|
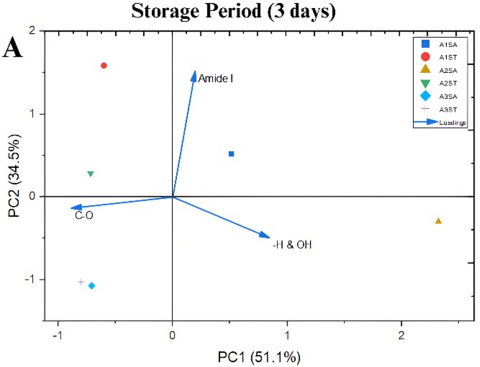
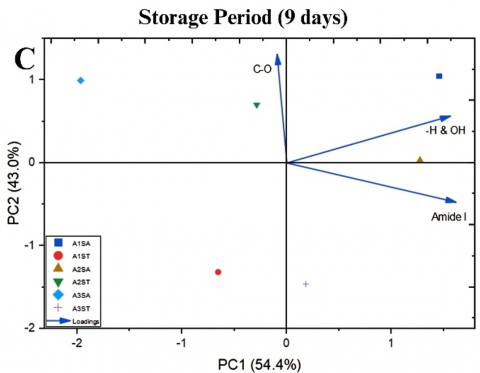
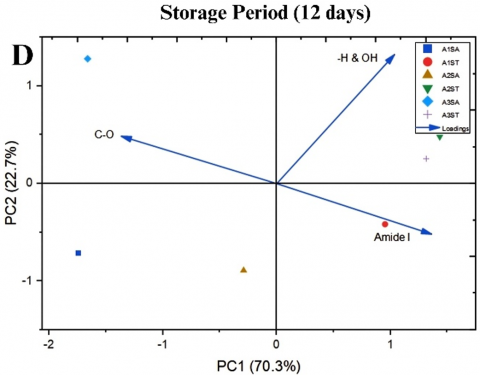
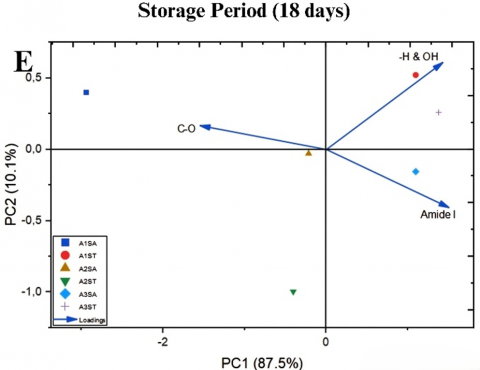
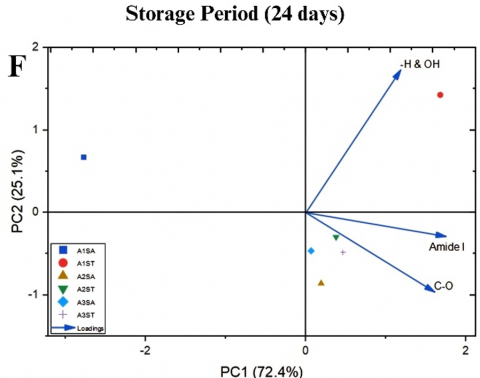
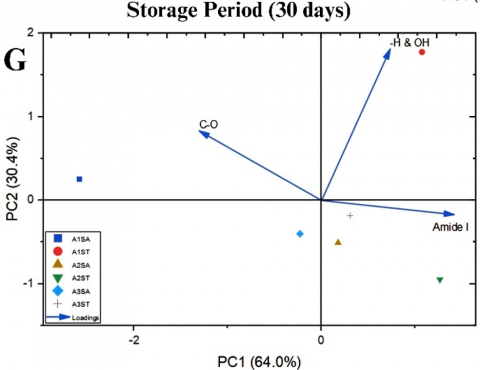
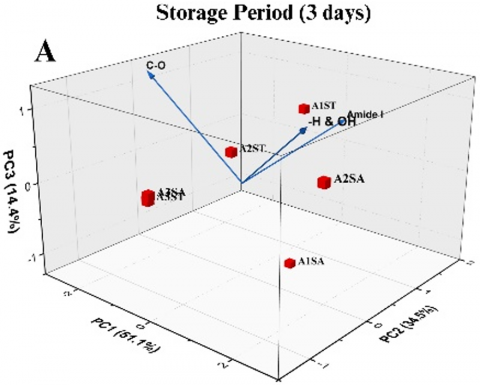
The 2D and 3D biplots (Figures 3 and 4) illustrate the correlation between functional groups and sample attributes (loadings), providing insight into how specific chemical bonds and pre-treatment methods affect changes in pempek quality during storage [36, 37]. These biplots enhance the understanding of the functional group dynamics by visualizing their relationships with treatment variations through correlation coefficients. On the 6th day of storage, a distinct cluster was observed involving the -H & -OH and C–O functional groups, indicating a strong positive correlation. Similarly, on the 24th day, the Amide I and C–O groups showed a positive association with other variables. The spatial distance between variables on the score plot reflects the degree of similarity or divergence in their chemical characteristics. The pre-treatment variation shows a cluster formation pattern with positive correlation at various pempek storage periods. On day 3, variables A1ST and A2ST formed a cluster, followed by A3SA and A3ST. On day 6, a cluster formed between A1SA and A2ST, followed by A1ST and A2SA. On day 9, the variables A1SA and A2SA form a cluster with a positive correlation, followed by A2ST and A3SA. On day 12, a cluster formed between A3ST and A2ST, followed by A1SA and A2SA. Day 18 shows a cluster between A3ST and A1ST, followed by A2SA and A2ST. On day 24, the variables A2SA, A2ST, A3SA, and A3ST formed one cluster with a positive correlation. On day 30, a similar cluster is formed between A2SA, A2ST, and A3ST.
Figure 3. 2D biplot of storage period of 3 days (A), 6 days (B), 9 days (C), 12 days (D), 18 days (E), 24 days (F), and 30 days (G) from the principal component analysis of the FT-IR spectra of the pempek Palembang
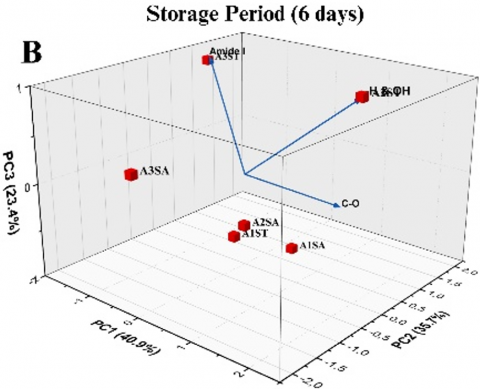
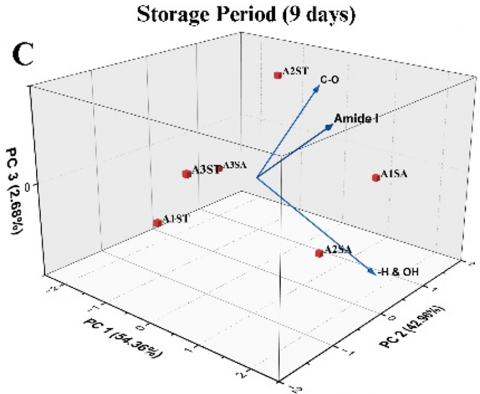
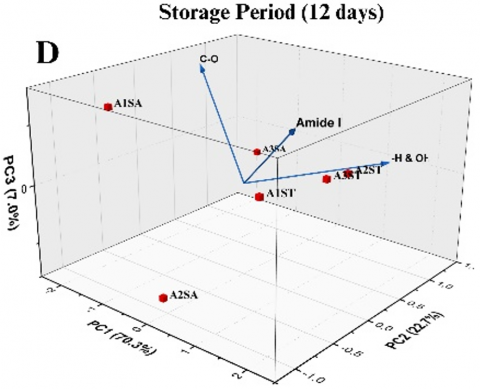
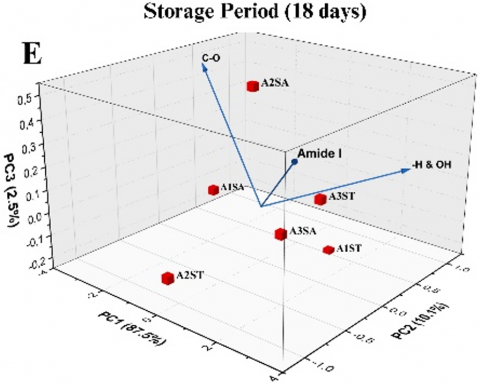
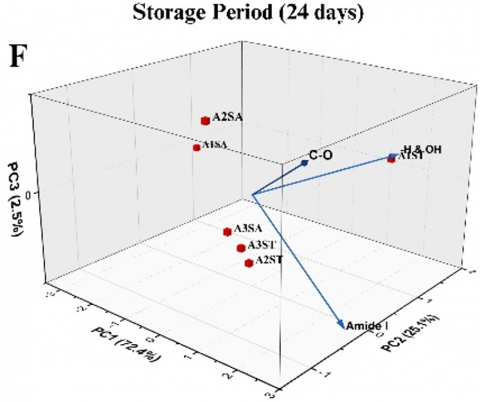
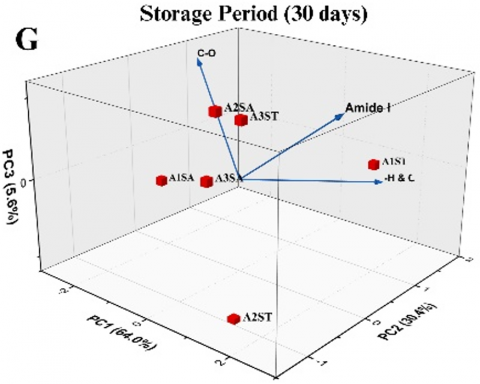
Figure 4. 3D biplot of storage period of 3 days (A), 6 days (B), 9 days (C), 12 days (D), 18 days (E), 24 days (F), and 30 days (G) from the principal component analysis of the FT-IR spectra of the pempek Palembang
On the third day of storage, the amide I functional group appeared in Quadrant I and was positioned distinctly away from the –H & OH and C-O groups, suggesting that protein structures contributed more dominantly than water and carbohydrate components at this stage. Furthermore, the formation of two separate clusters representing the semi-aseptic (SA) and sterile (ST) treatments indicated that initial packaging conditions significantly influenced product stability during storage. By day six, the –H & OH and C-O groups had shifted to quadrant I and moved closer to the amide I group, suggesting increased interactions between water and carbohydrates, likely due to retrogradation processes. This stage was associated with a noticeable change in texture, as the pempek began to harden and lose its elasticity due to moisture migration from the matrix. On the ninth day, the amide I functional group moved to a different quadrant (quadrant IV), indicating the onset of protein denaturation and the release of water from the tissue matrix. On the other hand, the C–O group showed ongoing structural modifications in the carbohydrate components.
On days 12 and 18 of storage, the –H & OH functional groups became more dominant than the amide I and C–O groups, indicating an increase in hydrogen bonding between starch molecules and water. This phenomenon contributed to enhanced gel rigidity, resulting in a firmer, denser, and less elastic pempek texture. Concurrently, shifts in the absorption bands of the amide I and C-O groups suggest progressive protein degradation and alterations in carbohydrate structural integrity. The sterile treatment (ST) appeared to play a more significant role in influencing changes in the functional groups during storage, as evidenced by the distinct positional shifts cluster within the PCA plot. On day 24 of storage, the three functional groups –H & OH, amide I, and C-O formed relatively large angles with one another in the PCA plot, suggesting increased molecular differentiation and consistent behavior under various storage conditions. The –H & OH group remained in its previous quadrant, while the amide I and C-O groups shifted to quadrant IV. This spatial separation indicates a significant alteration in the molecular interactions, particularly involving water content, as evidenced by the angular displacement observed in the PCA plot compared to earlier storage days.
On day 30 of storage, significant shifts in the structural configuration of proteins and carbohydrates were observed, consistent with a significant decline in product quality. Principal component analysis (PCA) confirmed significant chemical changes in pempek during storage, particularly in the functional groups –H & OH, Amide I, and C–O. The most notable changes occurred between days 12 and 18, as indicated by the increase in PC1 values and variable vectors. Pre-treatment methods played a critical role in influencing molecular stability, with sterilized pempek (ST) showing higher consistency compared to semi-aseptic pempek (SA).
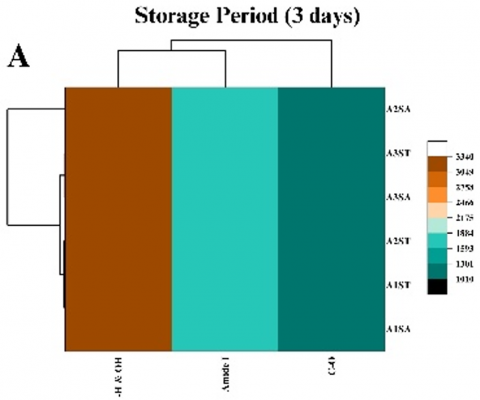
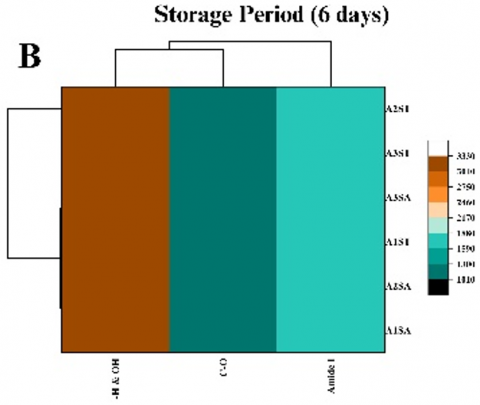
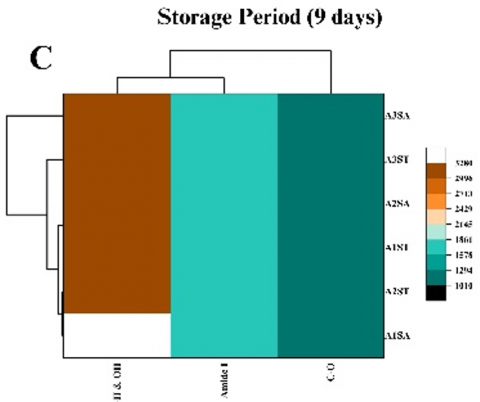
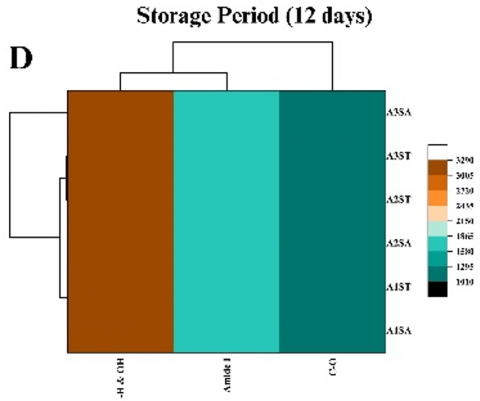
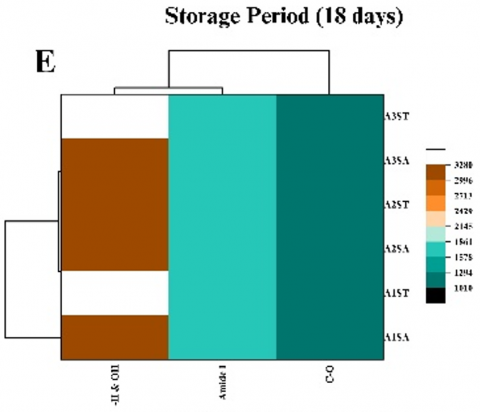
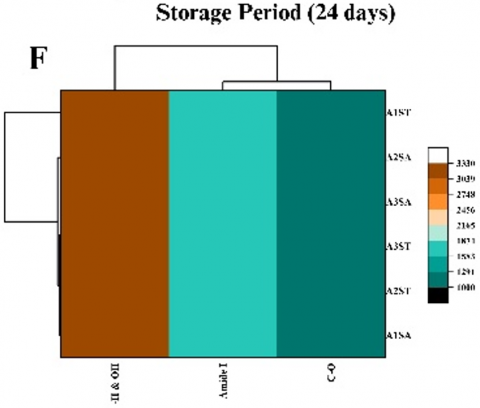
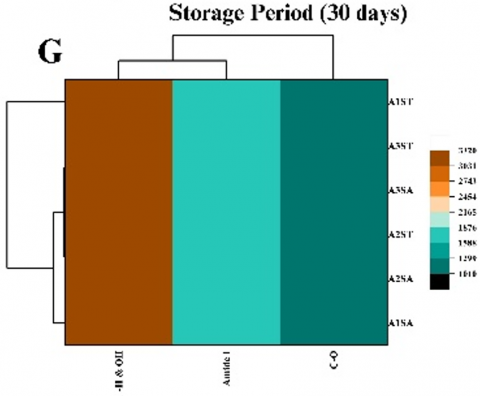
Figure 5. The heat map and dendrogram of hierarchical clustering analysis on storage period of 3 days (A), 6 days (B), 9 days (C), 12 days (D), 18 days (E), 24 days (F), and 30 days (G) from the principal component analysis of the pempek Palembang
Heat maps accompanied by dendrograms were employed in this study to visualize the patterns and relationships among variables derived from Principal Component Analysis (PCA) (Figure 5). The results indicate that storage on day 3 exhibited a relatively balanced distribution of parameters across clusters. By day 6, a consolidation of data within groups was observed, indicating improved homogeneity compared to earlier storage. On day 9, increased stability was evident in two main clusters, although some fluctuations in specific parameters persisted. Storage on day 12 revealed further shifts, suggesting potential declines in product quality. Data from days 18 and 24 demonstrated greater consistency and clearer parameter variation, marked by distinct cluster separations. However, by day 30, a significant decline in data values was observed, indicating potential product degradation and reduced suitability for consumption. These findings highlight the considerable impact of storage duration on the physicochemical properties of Palembang pempek, with implications for its shelf-life and quality maintenance.
In this study, FT-IR spectroscopy was successfully applied to characterize the functional groups in Palembang pempek during storage. Principal Component Analysis (PCA) further revealed changes in the chemical properties of the product during storage. The results indicated that the quality and molecular stability of pempek were maintained up to the 18th day of storage. Moreover, sterilized pempek (ST) demonstrated greater consistency and stability compared to semi-aseptic pempek (SA). Specifically, significant changes were detected in the Amide I absorption band, which is associated with protein structure, and the C-O absorption band, which corresponds to carbohydrate components. These changes reflect structural and chemical modifications that occurred during storage. The findings provide a scientific foundation for the development of quality monitoring methods for traditional food products using FT-IR spectroscopy, highlighting its potential as an effective tool for real-time and non-destructive quality assessment in the food industry.
Due to the limitations of this study, future research could be focused on several topics, such as the effects of pH, texture profiles, volatile components, and pathogenic bacteria profiles during storage.
The research in this article was funded by the Ministry of Education, Culture, Research and Technology, Republic of Indonesia through HIBAH PMDSU Number: 0088/UN9/SB3.LP2M.PT/2024. Additionally, the authors would like to thank the Agriculture Faculty, Universitas Sriwijaya, for their support.
[1] Supriadi, A., Saputra, D., Priyanto, G., Baehaki, A., Pambayun, R. (2020). The profile of pempek as a determining factor of quality, originality and ethnicity. Journal of Physics: Conference Series, 1485(1): 012032. https://doi.org/10.1088/1742-6596/1485/1/012032
[2] Hanidah, I.I., Sumanti, D.M., Mulyono, A.T., Yusuf, N.P. (2021). Shelf-life estimation of instant pempek rajungan (Portunus pelagicus) Rancidity with the Arrhenius Acceleration Method. Industria: Jurnal Teknologi dan Manajemen Agroindustri, 10(1): 59-66. https://doi.org/10.21776/ub.industria.2021.010.01.7
[3] Saputra, D., Yuliati, K. (2003). Extending the shelf life of pempek pelembang without preservative using hot filled packaging. Prosiding The DGHE_JSPS Intern H. Workshop on “The Quality Improvenat of Traditional Fisheries Product in Asia Region".
[4] Moulia, M.N., Syarief, R., Suyatma, N.E., Iriani, E.S., Kusumaningrum, H.D. (2019). Aplikasi edible coating bionanokomposit untuk produk pempek pada penyimpanan suhu ruang. Jurnal Teknologi dan Industri Pangan, 30(1): 11-19. https://doi.org/10.6066/jtip.2019.30.1.11
[5] Novidiyanto, Enardi, O.P. (2021). Proximate of pempek instant flour and sensory evaluation of pempek from mackerel fish (Scomberomorus Commersonii). In Proceedings of the First International Conference on Health, Social Sciences and Technology (ICoHSST 2020), pp. 155-159. https://doi.org/10.2991/assehr.k.210415.034
[6] Karneta, R., Rejo, A., Priyanto, G., Pambayun, R. (2013). Difusivitas panas dan umur simpan pempek lenjer. Jurnal Keteknikan Pertanian, 1(1): 131-141. https://doi.org/10.19028/jtep.01.1.%25p
[7] Pitayati, P.A., Herpandi, H., Lestari, S., Ulfadillah, S.A. (2021). Perendaman pempek dengan larutan kitosan sebagai edible coating dan pengaruhnya terhadap umur simpan. Jurnal FishtecH, 10(1): 35-52. https://doi.org/10.36706/fishtech.v10i1.14418
[8] Wargadalem, F.R., Wasino, Yulifar, L. (2023). Pempek Palembang: History, food making tradition, and ethnic identity. Journal of Ethnic Foods, 10(1): 45. https://doi.org/10.1186/s42779-023-00209-z
[9] Baehaki, A., Lestari, S.D., Violita, L. (2020). Penggunaan edible film yang ditambahkan ekstrak purun tikus (Eleocharis dulcis) pada Pempek yang Disimpan pada Suhu Ruang. Jurnal Pengolahan Hasil Perikanan Indonesia, 23(1): 186-195. https://doi.org/10.17844/jphpi.v23i1.31065
[10] Guttifera, G., Sari, S.R., Yesi, D. (2023). Karakteristik pempek dengan penambahan karagenan sebagai bahan aditif untuk mempertahankan kekenyalan selama proses penyimpanan suhu rendah (Frozen). Publikasi Penelitian Terapan dan Kebijakan, 6(2): 143-150. https://doi.org/10.46774/pptk.v6i2.540
[11] Alhanannasir, A., Rejo, A., Saputra, D., Priyanto, G. (2018). Karakteristik lama masak dan warna pempek instan dengan metode freeze drying. Jurnal Agroteknologi, 12(02): 158-166. https://doi.org/10.19184/j-agt.v12i02.9281
[12] Supriadi, A., Saputra, D., Priyanto, G., Lidiasari, E., Nurhasanah, S., Purwanto, S. (2023). Evaluating Tyndallisation's potential for composite food products and quality considerations. World Journal of Advanced Research and Reviews, 18(2): 1052-1062. https://doi.org/10.30574/wjarr.2023.18.2.0888
[13] Krylova, V.B., Gustova, T.V., Kudryashov, L.S. (2019). The effect of sterilization modes used for pork preserved in polymeric consumer packaging on the destruction of fatty acids. IOP Conference Series: Earth and Environmental Science, 315(7): 072032. https://doi.org/10.1088/1755-1315/315/7/072032
[14] Truong, B.Q., Buckow, R., Nguyen, M.H., Nguyen, H.T. (2021). High pressure thermal sterilization of barramundi (Lates calcarifer) muscles in brine: Effects on selected physicochemical properties. Journal of Food Processing and Preservation, 45(6): e15523. https://doi.org/10.1111/jfpp.15523
[15] Wang, W., Chen, H., Ke, D., Chen, W., Zhong, Q., Chen, W., Yun, Y.H. (2020). Effect of sterilization and storage on volatile compounds, sensory properties and physicochemical properties of coconut milk. Microchemical Journal, 153: 104532. https://doi.org/10.1016/j.microc.2019.104532
[16] Sarifudin, A., Desnilasari, D., Kristanti, D., Setiaboma, W., Putri, D.P., Surahman, D.N., Putri, S.K.D.F.A., Santosa, T., Gandara, D., Mochamad, M. (2022). Effect of different sterilization time on the quality properties and sensory acceptance of fishball of mackerel fish (rastrelliger kanagurta) packaged in retort pouch. In IOP Conference Series: Earth and Environmental Science. IOP Publishing, 995(1): 012019. https://doi.org/10.1088/1755-1315/995/1/012019
[17] Guillard, V., Mauricio-Iglesias, M., Gontard, N. (2010). Effect of novel food processing methods on packaging: Structure, composition, and migration properties. Critical Reviews in Food Science and Nutrition, 50(10): 969-988. https://doi.org/10.1080/10408390903001768
[18] Park, J.G., Song, B.S., Kim, J.H., Han, I.J., Yoon, Y., Chung, H.W., Kim, E.J., Gao, M., Lee, J.W. (2012). Effect of high-dose irradiation and autoclave treatment on microbial safety and quality of ready-to-eat Bulgogi sauce. Radiation Physics and Chemistry, 81(8): 1118-1120. https://doi.org/10.1016/j.radphyschem.2012.01.012
[19] Huang, T.C., Fu, H.Y., Ho, C.T. (2003). Comparative studies on some quality attributes of firm tofu sterilized with traditional and autoclaving methods. Journal of Agricultural and Food Chemistry, 51(1): 254-259. https://doi.org/10.1021/jf0206419
[20] Ibrahim, O.O. (2020). Thermal and nonthermal food processing technologies for food preservation and their effects on food chemistry and nutritional values. EC Nutr, 15: 88-105.
[21] Farag, M.A., Mesak, M.A., Saied, D.B., Ezzelarab, N.M. (2021). Uncovering the dormant food hazards, a review of foodborne microbial spores' detection and inactivation methods with emphasis on their application in the food industry. Trends in Food Science & Technology, 107: 252-267. https://doi.org/10.1016/j.tifs.2020.10.037
[22] Black, E.P., Setlow, P., Hocking, A.D., Stewart, C.M., Kelly, A.L., Hoover, D.G. (2007). Response of spores to high‐pressure processing. Comprehensive Reviews in Food Science and Food Safety, 6(4): 103-119. https://doi.org/10.1111/j.1541-4337.2007.00021.x
[23] Diao, M.M., André, S., Membré, J.M. (2014). Meta-analysis of D-values of proteolytic Clostridium botulinum and its surrogate strain Clostridium sporogenes PA 3679. International Journal of Food Microbiology, 174: 23-30. https://doi.org/10.1016/j.ijfoodmicro.2013.12.029
[24] De Corato, U. (2020). Improving the shelf-life and quality of fresh and minimally-processed fruits and vegetables for a modern food industry: A comprehensive critical review from the traditional technologies into the most promising advancements. Critical Reviews in Food Science and Nutrition, 60(6): 940-975. https://doi.org/10.1080/10408398.2018.1553025
[25] Supriadi, A., Saputra, D., Priyanto, G., Pambayun, R., Oswari, L.D. (2018). Mapping and development strategy of pempek-a specialty traditional food of south sumatra, indonesia. Slovak Journal of Food Sciences/Potravinarstvo, 12(1): 707-715. https://doi.org/10.5219/975
[26] Supriadi, A., Ridhowati, S., Saputra, D., Lestari, S.D. (2025). Untargeted metabolomics profiling for the geographical authentication of traditional pempek using high-resolution orbitrap mass spectrometry. Food Chemistry Advances, 6: 100914. https://doi.org/10.1016/j.focha.2025.100914
[27] Alhanannasir, A.R., Daniel, S., Gatot, P. (2017). Physical characteristics: Rehydration, porosity diameter, and colors of instant pempek out of treatment with freeze drying pressure. Food Science and Quality Management, 67, 64-70. https://iiste.org/Journals/index.php/FSQM/article/view/38649/39748.
[28] Szymanska-Chargot, M., Zdunek, A. (2013). Use of FT-IR spectra and PCA to the bulk characterization of cell wall residues of fruits and vegetables along a fraction process. Food Biophysics, 8: 29-42. https://doi.org/10.1007/s11483-012-9279-7
[29] Hou, S.W., Wei, W., Wang, Y., Gan, J.H., Lu, Y., Tao, N.P., Wang, X.C., Liu, Y., Xu, C.H. (2019). Integrated recognition and quantitative detection of starch in surimi by infrared spectroscopy and spectroscopic imaging. Spectrochimica Acta Part A: Molecular and Biomolecular Spectroscopy, 215: 1-8. https://doi.org/10.1016/j.saa.2019.02.080
[30] Wei, W., Hu, W., Zhang, X.Y., Zhang, F.P., Sun, S.Q., Liu, Y., Xu, C.H. (2018). Analysis of protein structure changes and quality regulation of surimi during gelation based on infrared spectroscopy and microscopic imaging. Scientific Reports, 8(1): 5566. https://doi.org/10.1038/s41598-018-23645-3
[31] Kobayashi, Y., Mayer, S.G., Park, J.W. (2017). FT-IR and Raman spectroscopies determine structural changes of tilapia fish protein isolate and surimi under different comminution conditions. Food Chemistry, 226: 156-164. https://doi.org/10.1016/j.foodchem.2017.01.068
[32] Zhang, X., Wei, W., Hu, W., Wang, X., Yu, P., Gan, J., Liu, Y., Xu, C. (2017). Accelerated chemotaxonomic discrimination of marine fish surimi based on Tri-step FT-IR spectroscopy and electronic sensory. Food Control, 73: 1124-1133. https://doi.org/10.1016/j.foodcont.2016.10.030
[33] Girgel, U. (2021). Principle component analysis (PCA) of bean genotypes (Phaseolus vulgaris L.) concerning agronomic, morphological and biochemical characteristics. Applied Ecology and Environmental Research, 19(3): 1999-2011. https://doi.org/10.15666/aeer/1903_19992011
[34] Mane, S., Desai, S., Kishore, A., Singh, A. (2025). Comprehensive lipid extract characterization of Chlorella vulgaris microalgae: A multi-analytical approach. Algal Research, 86: 103919. https://doi.org/10.1016/j.algal.2025.103919
[35] Ávila, S., Hornung, P.S., Teixeira, G.L., Malunga, L.N., Apea-Bah, F.B., Beux, M.R., Beta, T., Ribani, R.H. (2019). Bioactive compounds and biological properties of Brazilian stingless bee honey have a strong relationship with the pollen floral origin. Food Research International, 123: 1-10. https://doi.org/10.1016/j.foodres.2019.01.068
[36] Saputra, A., Oktriani, H., Supriadi, A. (2024). Identifikasi asam amino pembentuk tekstur dan viskositas daging ikan belida (Chitala lopis), ikan patin (Pangasius pangasius), dan Ikan Gabus (Channa striata). Samakia: Jurnal Ilmu Perikanan, 15(1): 121-130. https://doi.org/10.35316/jsapi.v15i1.3395
[37] Čopíková, J., Barros, A.S., Šmídová, I., Černá, M., Teixeira, D.H., Delgadillo, I., Synytsya, A., Coimbra, M.A. (2006). Influence of hydration of food additive polysaccharides on FT-IR spectra distinction. Carbohydrate Polymers, 63(3): 355-359. https://doi.org/10.1016/j.carbpol.2005.08.049
[38] Surya, R., Destifen, W., Stephanie, S. (2023). Review on pempek, a traditional fishcake from South Sumatra, Indonesia: History, nutritional aspects, current development, and innovation. International Journal of Gastronomy and Food Science, 34: 100828. https://doi.org/10.1016/j.ijgfs.2023.100828
[39] Li, J., Lu, S., Wu, S., Zhang, W., Hua, M., Pan, B. (2022). The breakdown of protein hydrogen bonding networks facilitates biotransformation of protein wastewaters during anaerobic digestion methanogenesis: Focus on protein structure and conformation. Environmental Research, 208: 112735. https://doi.org/10.1016/j.envres.2022.112735
[40] Hu, N., Qi, W., Zhu, J., Zhao, F., Xiu, L., Zheng, M., Liu, J. (2025). Mechanistic studies on the effect of endogenous proteins on the starch retrogradation characteristics of corn before and after postharvest ripening. Food Chemistry: X, 25: 102088. https://doi.org/10.1016/j.fochx.2024.102088
[41] Shivaraju, V.K., Vallayil Appukuttan, S. (2019). The influence of bound water on the FTIR characteristics of starch and starch nanocrystals obtained from selected natural sources. Starch‐Stärke, 71(5-6): 1700026. https://doi.org/10.1002/star.201700026
[42] Al-Mahsaneh, M., Aljarrah, M., Rababah, T., Alu’datt, M. (2018). Using MR‐FTIR and texture profile to track the effect of storage time and temperature on pita bread staling. Journal of Food Quality, 2018(1): 8252570. https://doi.org/10.1155/2018/8252570
[43] Teobaldi, A.G., Carrillo Parra, E.J., Barrera, G.N., Ribotta, P.D. (2024). The properties of damaged starch granules: The relationship between granule structure and water-starch polymer interactions. Foods, 14(1): 21. https://doi.org/10.3390/foods14010021
[44] Zhang, L., Zhang, F., Wang, X. (2016). Changes of protein secondary structures of pollock surimi gels under high-temperature (100 C and 120 C) treatment. Journal of Food Engineering, 171: 159-163. https://doi.org/10.1016/j.jfoodeng.2015.10.025
[45] Liu, Y., Hu, W., Guo, X.X., Wang, X.C., Sun, S.Q., Xu, C.H. (2015). Rapid discrimination of three marine fish surimi by Tri-step infrared spectroscopy combined with Principle Component Regression. Spectrochimica Acta Part A: Molecular and Biomolecular Spectroscopy, 149: 516-522. https://doi.org/10.1016/j.saa.2015.04.116
[46] Zhang, H., Zhu, Y., Chen, S., Xu, C., Yu, Y., Wang, X., Shi, W. (2018). Determination of the effects of different high‐temperature treatments on texture and aroma characteristics in Alaska pollock surimi. Food Science & Nutrition, 6(8): 2079-2091. https://doi.org/10.1002/fsn3.763
[47] Dankar, I., Haddarah, A., Pujolà, M., Sepulcre, F. (2024). Hydrogen bond integration in potato microstructure: Effects of water removal, thermal treatment, and cooking techniques. Polysaccharides, 5(4): 609-629. https://doi.org/10.3390/polysaccharides5040039
[48] Shamim, M.A.H., Wang, J., Hossain, K.B., Rayhan, A.S., Islam, M.M., Chen, K., Ke, H., Zheng, X., Wang, C., Chen, D., Cai, M. (2025). Integrated analysis of microplastics origins and impact on prominent aquaculture ecosystems in Bangladesh. Science of The Total Environment, 977: 179334. https://doi.org/10.1016/j.scitotenv.2025.179334